AWS DevOps & Developer Productivity Blog
Tag: memory leak
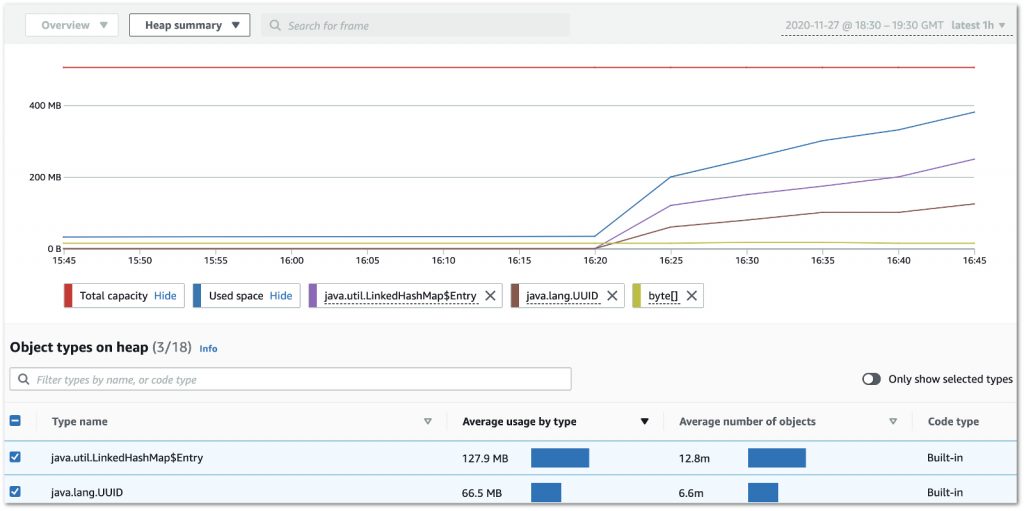
Understanding memory usage in your Java application with Amazon CodeGuru Profiler
“Where has all that free memory gone?” This is the question we ask ourselves every time our application emits that dreaded OutOfMemoryError just before it crashes. Amazon CodeGuru Profiler can help you find the answer. Thanks to its brand-new memory profiling capabilities, troubleshooting and resolving memory issues in Java applications (or almost anything that runs […]