.NET on AWS Blog
Adding Observability to .NET Microservices on EKS with ADOT Auto-Instrumentation and Helm
Introduction
This post walks you through the process of adding telemetry to your .NET applications running on Kubernetes using AWS Distro for OpenTelemetry (ADOT) to gain observability into your applications, which allows you to find and fix operational issues quickly. ADOT uses OpenTelemetry, an open-source, vendor-neutral observability framework that standardizes how you instrument applications to generate, collect, and export telemetry data to any backend you choose.
Your .NET microservices running on Amazon Elastic Kubernetes Service (Amazon EKS) work fine until a request takes 3 seconds instead of the average 300 milliseconds, or errors spike on Fridays. Where do you look? There is no observability instrumentation, and you don’t want to rearchitect running applications by adding NuGet packages to every project, wrapping every HTTP/gRPC call in manual spans, and maintaining instrumentation code alongside business logic.
The Three Pillars of Observability
The three pillars of observability are traces, metrics, and logs. Each of these answer different questions:
- Traces: Where is time spent across service boundaries?
- Metrics: How often and how much? Request rates, error percentages, latency percentiles.
- Logs: What happened in a specific instance?
Without telemetry, debugging a distributed system is guesswork. Telemetry piped to Amazon CloudWatch gives service maps, latency breakdowns, and anomaly detection out of the box.
The challenge: Most existing applications don’t have instrumentation for observability. Retrofitting SDK calls into every service is expensive and error-prone. That’s where auto-instrumentation comes in.
How ADOT auto-instrumentation works
ADOT’s .NET auto-instrumentation works at the CLR level. The ADOT Operator injects an init container that copies the OpenTelemetry profiler agent into a shared volume and sets the profiler environment variables (CORECLR_ENABLE_PROFILING, CORECLR_PROFILER). On startup, the CLR profiler automatically instruments HTTP clients, gRPC calls, and ASP.NET Core requests.
Your code remains untouched. The only change is a single annotation on your pod spec.
Solution Overview
Figure 1 shows the architecture diagram. Application pods emit telemetry via OTLP to the ADOT Collector, which exports traces to AWS X-Ray and metrics to Amazon CloudWatch. The ADOT Operator injects the .NET profiler automatically the only requirement is the annotation instrumentation.opentelemetry.io/inject-dotnet: “true” on the pod template, which both helm charts already included in the helm/template/deployment.yaml of the grpc-hello-service and hello-world-api projects. The “true” value tells the Operator to use the Instrumentation resource in the pod’s own namespace, which each chart ships alongside its Deployment.
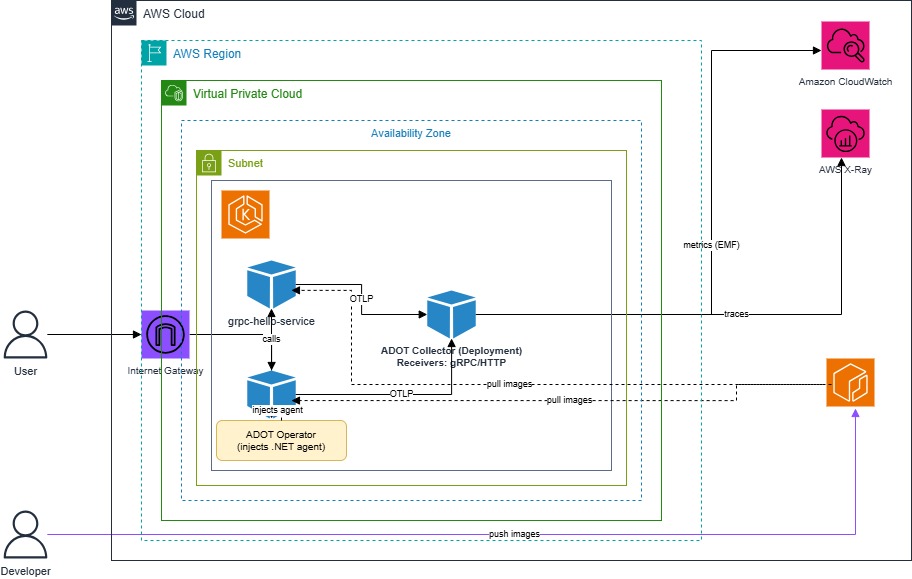
Figure 1: ADOT auto-instrumentation architecture on Amazon EKS
Walkthrough / Running
Prerequisites
Before you begin, ensure you have:
- An Amazon EKS cluster having minimum two nodes.
- AWS Distro for OpenTelemetry EKS Add-On installed on your cluster.
- Kubectl installed.
- Cert-manager installed with a self-signed ClusterIssuer applied on your cluster.
- An IAM OIDC identity provider associated with the cluster (required for IAM Role for Service Accounts (IRSA))
Check with aws eks describe-cluster –name <cluster> –query “cluster.identity.oidc.issuer”; associate one with eksctl utils associate-iam-oidc-provider –cluster <cluster> –approve if missing. - Helm v3 installed.
- AWS CLI v2 installed.
- Docker (with buildx) or finch for building images.
- An Amazon Elastic Container Registry (ECR) repository (or permission to create one) per service.
- Familiarity with .NET 10 and Kubernetes.
- Clone Repo
git clone https://github.com/aws-samples/dotnet-genai-samples/tree/dotnet-adot-auto-instrumentation-and-helm
In our scenario, we’ll take two existing .NET 10 microservices that have no observability built in and add full distributed tracing and metrics export to Amazon CloudWatch without modifying application code. We’ll use:
- ADOT for auto-instrumentation.
- Helm charts for repeatable, production-grade deployments to EKS.
- Amazon CloudWatch as our observability backend.
Our project, dotcore-adot-instrumentation, consists of:
| Service | Type | Role |
| grpc-hello-service | gRPC backend | Handles gRPC requests |
| hello-world-api | REST API | Calls the gRPC service |
By the end of this walkthrough, you’ll have traces flowing between both services and metrics visible in CloudWatch all driven by a single pod annotation and a Helm deploy.
Architecture: The container images you deploy to EKS must match the CPU architecture of your nodes, x86_64 or arm64. This applies to both your .NET application image and the ADOT auto-instrumentation init container, since both are architecture-specific. Choose x86_64 instances (e.g. m5.large) or Graviton arm64 instances (e.g. m6g.large) and build your images accordingly. The ADOT Collector image is multi-arch, so it works on either.
Windows / PowerShell: Commands in this walkthrough use bash. Windows users: see the accompanying README.md for the equivalent PowerShell commands (using $env:VAR and backtick line-continuation) plus tool-installation and cluster-creation steps.
Step 1: Set the environment variables required for the setup
Run:
# Edit these three for your environment:
export AWS_REGION=<region-id> #Update region as appropriate - this walkthrough uses us- west -2
export CLUSTER_NAME=<my-cluster> #Update cluster name to anything you like
export AWS_ACCOUNT_ID=$(aws sts get-caller-identity --query Account --output text)

# Derived — no need to edit:
export ECR_REGISTRY=${AWS_ACCOUNT_ID}.dkr.ecr.${AWS_REGION}.amazonaws.com
Step 2: Build and Push Images to ECR
We will make use of the Amazon ECR repository from the pre-requisites to build and push the images to ECR:
Run:
# Authenticate
aws ecr get-login-password --region ${AWS_REGION} | \
  docker login --username AWS --password-stdin ${ECR_REGISTRY}

# Build for both EKS node architectures (linux/amd64 for x86 and linux/arm64 for Graviton)

# grpc-hello-service builds with its own folder as the context:
docker build --platform linux/amd64,linux/arm64 -t grpc-hello-service:latest -f ./grpc-hello-service/Dockerfile .
docker tag grpc-hello-service:latest "$ECR_REGISTRY/grpc-hello-service:latest"
docker push "$ECR_REGISTRY/grpc-hello-service:latest"

# hello-world-api needs the REPO ROOT as context (its Dockerfile
# references the shared proto in grpc-hello-service/protos), so pass
# the Dockerfile with -f and use "." (repo root) as the context:
docker build --platform linux/amd64,linux/arm64 -t hello-world-api:latest -f ./hello-world-api/Dockerfile .
docker tag hello-world-api:latest "$ECR_REGISTRY/hello-world-api:latest"
docker push "$ECR_REGISTRY/hello-world-api:latest"
Build context differs per service: grpc-hello-service is self-contained and builds with ./grpc-hello-service as the context. hello-world-api’s Dockerfile copies the shared greet.proto from grpc-hello-service/protos, so it must be built from the repo root (context “.”) with -f ./hello-world-api/Dockerfile. Building it with ./hello-world-api as the context fails with “greet.proto: not found”.
Multi-arch tip: The build command produces a single image that runs on both x86_64 and Graviton nodes, pass --platform linux/amd64,linux/arm64. This allows you to deploy your image across both x86 and arm processors.
Step 3: Create the IAM policy and role for the OIDC provider (required for IRSA):
Collector IAM (IRSA): The ADOT Collector needs AWS permissions. Create the IAM policy, enable an IAM OIDC provider (eksctl utils associate-iam-oidc-provider), and attach a policy with those actions to the collector’s service account via IRSA.
Run:
cat > adot-collector-policy.json <<'EOF'
{
  "Version": "2012-10-17",
  "Statement": [{
    "Effect": "Allow",
    "Action": [
      "xray:PutTraceSegments",
      "xray:PutTelemetryRecords",
      "logs:CreateLogGroup",
      "logs:CreateLogStream",
      "logs:PutLogEvents",
      "logs:DescribeLogGroups",
      "logs:DescribeLogStreams",
      "cloudwatch:PutMetricData"
    ],
    "Resource": "*"
  }]
}
EOF
Run:
# Create the iam policy.
aws iam create-policy  --policy-name ADOTCollectorPolicy  --policy-document file://adot-collector-policy.json
export POLICY_ARN="arn:aws:iam::${ACCOUNT_ID}:policy/ADOTCollectorPolicy"

export OIDC_PROVIDER=$(aws eks describe-cluster --name ${CLUSTER_NAME} \
  --query "cluster.identity.oidc.issuer" --output text | sed -e "s/^https:\/\///")

cat > trust-policy.json <<EOF
{
  "Version": "2012-10-17",
  "Statement": [{
    "Effect": "Allow",
    "Principal": {
      "Federated": "arn:aws:iam::${ACCOUNT_ID}:oidc-provider/${OIDC_PROVIDER}"
    },
    "Action": "sts:AssumeRoleWithWebIdentity",
    "Condition": {
      "StringEquals": {
        "${OIDC_PROVIDER}:aud": "sts.amazonaws.com",
        "${OIDC_PROVIDER}:sub": [
          "system:serviceaccount:hello-world-api:adot-collector-collector",
          "system:serviceaccount:grpc-hello-service:adot-collector-collector"
        ]
      }
    }
  }]
}
EOF

aws iam create-role \
  --role-name ADOTCollectorRole \
  --assume-role-policy-document file://trust-policy.json

aws iam attach-role-policy \
  --role-name ADOTCollectorRole \
  --policy-arn ${POLICY_ARN}

export ROLE_ARN=$(aws iam get-role --role-name ADOTCollectorRole --query "Role.Arn" --output text)
Step 4: Deploy with Helm
Injection ordering: Make sure the Instrumentation custom resource exists before your application pods start, or the operator will not inject the agent init container (opentelemetry-auto-instrumentation-dotnet). If your chart bundles the Instrumentation CR, add the Helm hook annotation helm.sh/hook: pre-install,pre-upgrade to it. If a pod ever starts without the init container, recreate it (kubectl rollout restart) once the operator is healthy.
Run:
helm install grpc-hello-service ./grpc-hello-service/helm/grpc-hello-service \
  -n grpc-hello-service --create-namespace \
  --set image.repository=${ECR_REGISTRY}/grpc-hello-service \
  --set image.tag=latest \
  --set collector.serviceAccount.roleArn=$ROLE_ARN \
  --set collector.cloudwatch.region=$AWS_REGION \
  --set collector.xray.region=$AWS_REGION


helm install hello-world-api ./hello-world-api/helm/hello-world-api service \
  -n hello-world-api --create-namespace \
  --set image.repository=${ECR_REGISTRY}/hello-world-api \
  --set image.tag=latest \
  --set collector.serviceAccount.roleArn=$ROLE_ARN \
  --set collector.cloudwatch.region=$AWS_REGION \
  --set collector.xray.region=$AWS_REGION
Step 5: Verify the Deployment
Run:
kubectl get pods -n grpc-hello-service
kkubectl get pods -n hello-world-api

# Confirm the ADOT init container was injected
kubectl describe pod -n hello-world-api -l app=hello-world-api | grep "Init Containers" -A 10
Step 6: Generate Test Traffic
Telemetry only appears once requests flow. Port-forward the REST API and send a burst of requests:
Run:
# In one terminal, port-forward the REST API:
kubectl port-forward -n hello-world-api svc/hello-world-api 8080:80

# In another terminal, send 50 requests:
for i in $(seq 1 50); do
  curl -s http://localhost:8080/hello/world > /dev/null
  echo "request $i"
done
Built-in chaos: To make the observability data meaningful, the gRPC backend (grpc-hello-service) deliberately injects failures in its SayHello handler. It keeps a static request counter (incremented atomically with Interlocked.Increment), and on that count it does two things: every 5th request pauses for a random 2–5 second delay, and every 10th request throws a gRPC Internal error (“Simulated internal server error”). Each event is logged to standard output with a [Chaos] prefix, so you can correlate it with what you see in CloudWatch. The behavior is hardcoded in the sample application (grpc-hello-service/Services/GreeterService.cs), not exposed as a configuration flag, so it is always on. This allows you to see elevated p99 latency and a non-zero error rate in the metrics and traces.
Checking Metrics in Amazon CloudWatch
To pinpoint which part of the application is taking the longest time, we need to look at client request duration for each of the components. You can see the client request duration metrics captured by Amazon CloudWatch in Figure 2 and Figure 3.
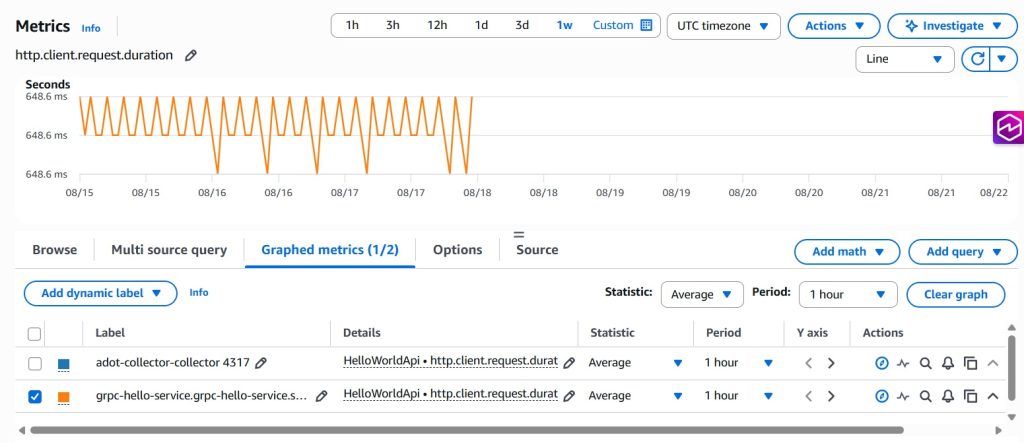
Figure 2: Cloudwatch Metrics – grpc-hello-service client request duration
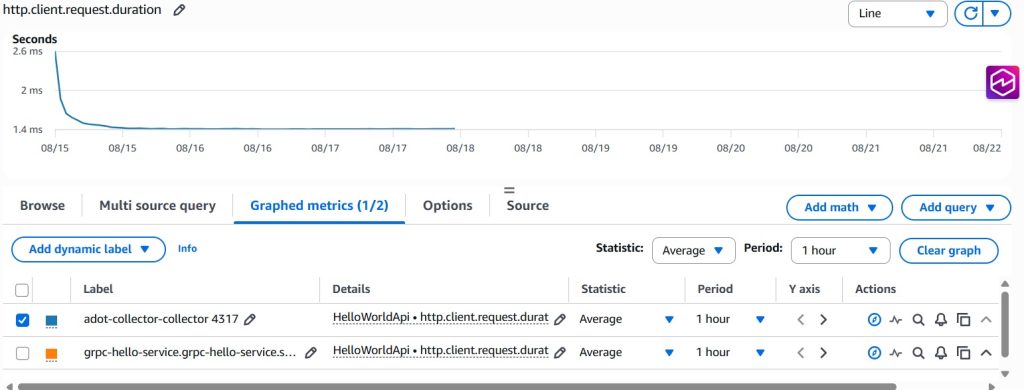
Figure 3: Cloudwatch Metrics – hello-world-api client request duration
- Open the Amazon CloudWatch console
- On the left hand menu scroll down to Metrics
- Select Classic metrics in the sub-menu
- On the Metrics Page (in the right hand main window) find the custom namespaces GrpcHelloService and HelloWorldApi (each service publishes to its own namespace in its chart values.yaml).
- You’ll see metrics like http.server.request.duration, rpc.server.duration, and your custom payload metrics.
X-Ray Traces
Navigate to Amazon CloudWatch console → Application Signals (APM) → Traces. You’ll see hello-world-api calling grpc-hello-service, with request rate, latency, and error rate between the two services. (Traces are exported to AWS X-Ray by the collector’s awsxray exporter and appear under Traces. Confirm the console Region matches your deployment in the variable ${AWS_REGION}, e.g., us-west-2.)
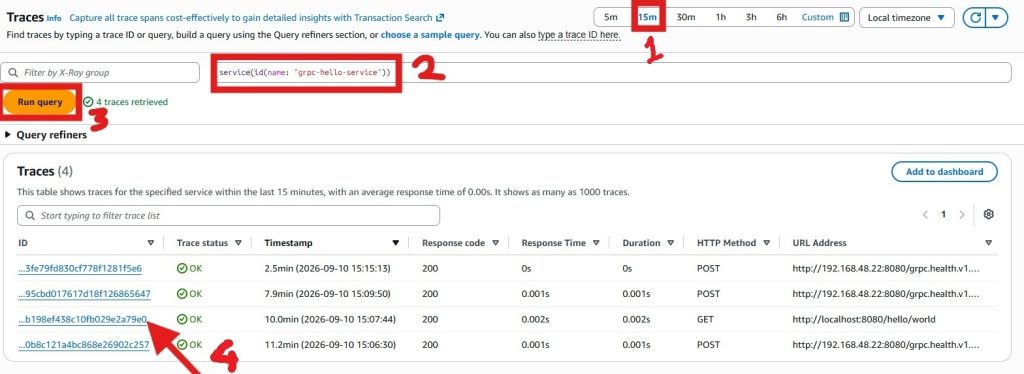
Figure 4: Cloudwatch X-Ray
In the console
- Time range: set to Last 15 minutes (not a custom window that may miss recent traffic)
- Query filter to the real service path: service(id(name: “grpc-hello-service”))
- Click on Run Query
- Every trace here is a real end-to-end call (probes hit / on the API, never the gRPC service as a traced parent). Click one of these traces. You’ll see the 3-span waterfall: hello-world-api
GET /hello/{name}→ POST (gRPC client) → grpc-hello-servicePOST /greet.Greeter/SayHello
Cleanup
To avoid incurring future charges, delete the resources you created:
# Uninstall the Helm releases - removes the Deployments, Services, ADOT Collectors, Instrumentation resources, and the per-service namespaces)
helm uninstall hello-world-api -n hello-world-api
helm uninstall grpc-hello-service -n grpc-hello-service

# Delete the IRSA service accounts and their IAM roles created with eksctl
for NS in grpc-hello-service hello-world-api; do
  eksctl delete iamserviceaccount \
    --cluster ${CLUSTER_NAME} \
    --namespace ${NS} \
    --name adot-collector-collector \
    --region ${AWS_REGION}
done

# Delete the IAM policy:
ACCOUNT_ID=$(aws sts get-caller-identity --query Account --output text)
aws iam delete-policy \
  --policy-arn arn:aws:iam::${AWS_ACCOUNT_ID}:policy/ADOTCollectorPolicy

# Delete the ECR repositories and their images:
for REPO in grpc-hello-service hello-world-api; do
  aws ecr delete-repository --repository-name ${REPO} --force --region ${AWS_REGION}
done

# Delete CloudWatch log groups (/metrics/GrpcHelloService and /metrics/HelloWorldApi)
aws logs delete-log-group --log-group-name /metrics/HelloWorldApi --region ${AWS_REGION}
aws logs delete-log-group --log-group-name /metrics/GrpcHelloService --region ${AWS_REGION}
Conclusion
In this post, we added full observability to two existing .NET 10 microservices on Amazon EKS using AWS Distro for OpenTelemetry (ADOT) auto-instrumentation and Helm charts without touching application code. We deployed the ADOT Operator and a per-service Collector, enabled auto-instrumentation with a single pod annotation (already included in the sample charts), and watched distributed traces flow to AWS X-Ray and metrics to Amazon CloudWatch automatically. We didn’t change a single line of the application code for tracing and metrics; to enable it on your own services, the only requirement is a single annotation on the pod template.
With telemetry signals in Amazon CloudWatch, you can set CloudWatch alarms on the incoming metrics emitted by OpenTelemetry instrumentation. Try setting an alarm on http.server.request.duration latency and http.server.active_requests metrics to alert when either service breaches its SLA threshold. This requires no code changes, only a CloudWatch Alarms configuration targeting the OpenTelemetry-generated metric namespace.
To try this yourself, clone the sample repository and follow the walkthrough. To go further, see the ADOT auto-instrumentation documentation, the OpenTelemetry .NET guide, and Amazon CloudWatch container observability. This pattern scales to any number of .NET services on Amazon EKS.