Front-End Web & Mobile
Unlocking deeper insights with enhanced monitoring in AWS AppSync
In today’s digital landscape, how well your APIs work is important for a good user experience. Monitoring your APIs isn’t just smart—it’s needed to keep your apps running well.
AWS AppSync, a managed GraphQL service, is a popular choice for developers building scalable, real-time applications. With the introduction of Enhanced Monitoring, AppSync now provides deeper insights and more detailed metrics. In this blog post, we’ll show how this feature can help you monitor and optimise your APIs more effectively. We’ll also compare it to current monitoring tools, guide you through a sample API implementation, and break down the associated costs.
AWS AppSync overview
AWS AppSync simplifies the process of building and deploying secure, high-performance APIs. It’s a managed service for GraphQL and Pub/Sub APIs that abstracts away the complexities of infrastructure, allowing you to focus on what matters—building innovative applications.
With AppSync, you can create a unified data graph that brings together data from multiple sources. Whether you’re synchronizing real-time data, enabling offline access, or managing conflict resolution, AppSync provides the tools to make it happen. Its built-in security features and serverless architecture mean you can deploy APIs that are both robust and secure, without worrying about the underlying infrastructure.
The importance of monitoring in API management
Monitoring is a critical aspect of API management. It ensures that APIs are performing optimally, meeting service level objectives, and maintaining security standards. By regularly keeping a close eye on key metrics, you ensure that your APIs meet your service-level objectives (SLOs) and comply with security standards, ensuring a smooth and reliable experience. When you monitor metrics like latency, error rates, and request counts, you can detect anomalies early, troubleshoot root causes, and prevent small issues from escalating into user-facing problems. This approach of using telemetry from metrics to take proactive action aligns with best practices like OPS09-BP03 and is essential for the long-term reliability and scalability of your APIs.
Understanding existing monitoring in AWS AppSync
Basic monitoring with AWS CloudWatch
AWS AppSync integrates with Amazon CloudWatch, providing essential metrics that offer a high-level overview of your API’s performance. These include request latency, counts and error rates and more.
AppSync’s real-time subscriptions are a powerful feature, enabling push notifications and live updates. To monitor these, Amazon CloudWatch offers metrics such as the number of active real-time subscriptions, number of messages sent via subscription and more.
Check the full list of built-in metrics to identify overall trends and spikes at a glance.
Introducing enhanced monitoring in AWS AppSync
As applications become more complex and user demands grow, there is a growing need for more granular insights. Developers increasingly require additional metrics to pinpoint the precise stages of request processing that might contribute to latency or errors.
For instance, understanding the performance at the resolver level or tracking how individual data sources perform under load can be critical for fine-tuning and optimizing API operations. These detailed metrics empower developers to not only detect issues but also to understand the root causes, enabling more targeted and effective optimizations.
On February 12, 2024, AWS announced Enhanced Monitoring for AWS AppSync, Enhanced Monitoring in AWS AppSync gives developers access to a more detailed view of their API’s performance. This feature provides real-time insights and granular metrics, allowing you to drill down into specific operations, resolvers, and data sources.
Key features of enhanced monitoring
- Resolver-Level Metrics: Track the performance of individual resolvers to pinpoint latency and errors. This allows for targeted optimizations, ensuring your API performs efficiently at every stage.
- Data Source Monitoring: Gain detailed insights into how your data sources—whether Amazon DynamoDB, Amazon RDS, or AWS Lambda—are performing. Identifying performance bottlenecks at the source level becomes easier, allowing you to take corrective action quickly.
- Operational metrics: Get detailed metrics on GraphQL operation-level (Mutations & Queries) metrics.
In total, 10 new CloudWatch metrics were added under the “Enhanced metrics” section of the official documentation.
Sample API implementation with enhanced monitoring
To demonstrate the power of Enhanced Monitoring, let’s walk through a sample AWS AppSync API implementation. This API will include three queries and two mutations, connected to four different data sources: Amazon DynamoDB, AWS Lambda, and Amazon OpenSearch Service.
We will create an API that supports the following operations:
Queries:
getUser: Retrieve user details by ID.listUsers: List all users.searchUsers: Search users by a specific attribute.
Mutations:
createUser: Add a new user.updateUser: Update existing user details.
Data Sources:
- DynamoDB: To store user data.
- AWS Lambda: For complex business logic processing (used for
createUserandupdateUsermutations). - Amazon OpenSearch Service: To enable search functionality.
Step-by-step setup
Prerequisites:
- An active AWS account: If you don’t have one, you can create an AWS account to get started.
- Valid AWS credentials: You need an IAM user with permissions to manage AWS AppSync APIs (create, update, delete, view) and to view related CloudWatch metrics and alarms. This can be granted by attaching the AWS managed policies
AWSAppSyncAdministratorandCloudWatchReadOnlyAccess, or equivalent custom permissions. You will use these credentials to sign in to AWS Management Console.
Here’s how you can enable enhanced monitoring in AWS AppSync using different methods:
Method 1: Enabling enhanced monitoring via the AWS Management Console:
- Navigate to the AppSync Console:
- Sign in to the AWS Management Console.
- Navigate to the AppSync service by searching for “AppSync” in the AWS services search bar.
- Select Your GraphQL API:
- In the AppSync console, click on the API for which you want to enable enhanced monitoring.
- Go to the Settings:
- Select “Settings” from the left-hand menu.
- Enable Enhanced Monitoring:

Figure 1: AWS AppSync Console ‘Settings’ tab showing the toggles for Enhanced Monitoring
- In the API Configuration section, you’ll see an option to enable Enhanced Monitoring.
- Here you can either enable metrics for all resolvers and data sources or can choose to manually select them by choosing “
PER_RESOLVER_METRICS” and “PER_DATA_SOURCE_METRICS”, respectively, as stated in the documentation. - For per-resolver and per-data source metrics, metrics need to be enabled individually on each resolver and data source.
Method 2: Enabling enhanced monitoring via the AWS CLI
aws appsync update-graphql-api \
--api-id <API_ID> \
--name "<API_NAME>" \
--authentication-type API_KEY \
--enhanced-metrics-config resolverLevelMetricsBehavior=FULL_REQUEST_RESOLVER_METRICS,dataSourceLevelMetricsBehavior=FULL_REQUEST_DATA_SOURCE_METRICS,operationLevelMetricsConfig=ENABLE
Method 3: Enabling enhanced monitoring via Terraform
Following the AWS Provider documentation, adding the block enhanced_metrics_configto an existing resource will enable enhanced monitoring, eg:
resource "aws_appsync_graphql_api" "api" {
  authentication_type = "API_KEY"
  name                = "<API_NAME>"
  enhanced_metrics_config {
    resolver_level_metrics_behavior     = "FULL_REQUEST_RESOLVER_METRICS"
    data_source_level_metrics_behavior  = "FULL_REQUEST_DATA_SOURCE_METRICS"
    operation_level_metrics_config      = "ENABLED"
  }
}
Metrics dashboard
With Enhanced Monitoring enabled, you can now observe detailed metrics in the Amazon CloudWatch dashboard. For example, if the SearchUsers query is experiencing high latency, you can quickly identify whether the issue lies with the Amazon OpenSearch Service data source or the Lambda resolver. The Amazon CloudWatch dashboard will display metrics such as resolver execution time and data source response time, allowing you to pinpoint the exact cause of any performance issues.
Additional API metrics in Amazon CloudWatch metrics
Useful dimensions and metrics include:
- DataSource, GraphQLAPIId
- API Metrics by Operation
- GraphQLAPIId, Resolver
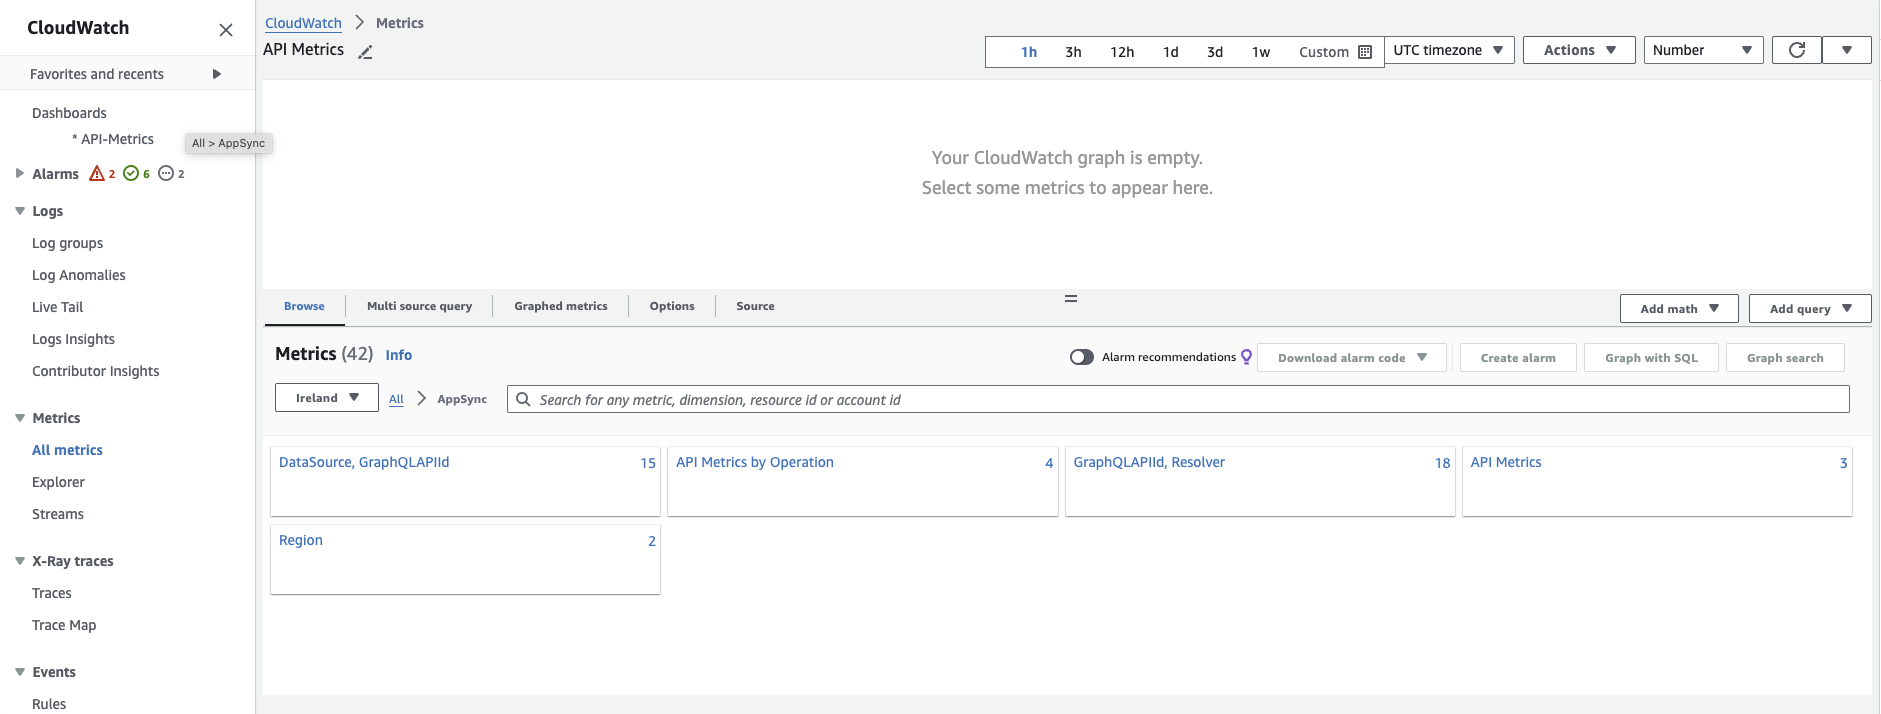
Figure 2: A screenshot of AWS AppSync API Metrics in Amazon CloudWatch
API Metrics per resolver
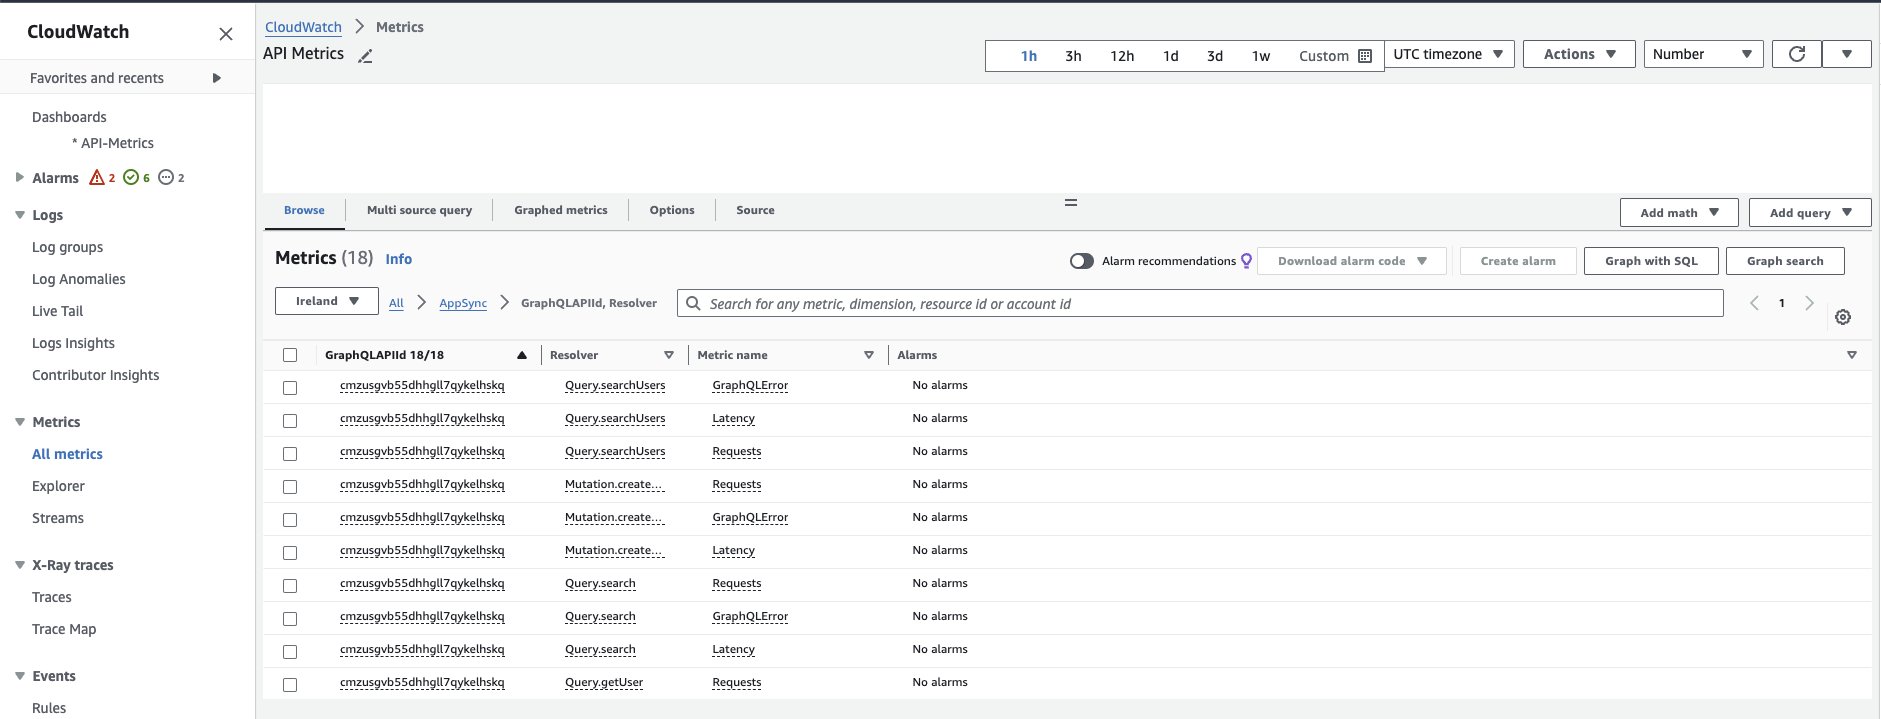
Figure 3: AWS AppSync API Metrics by Resolver
API Metrics per DataSource
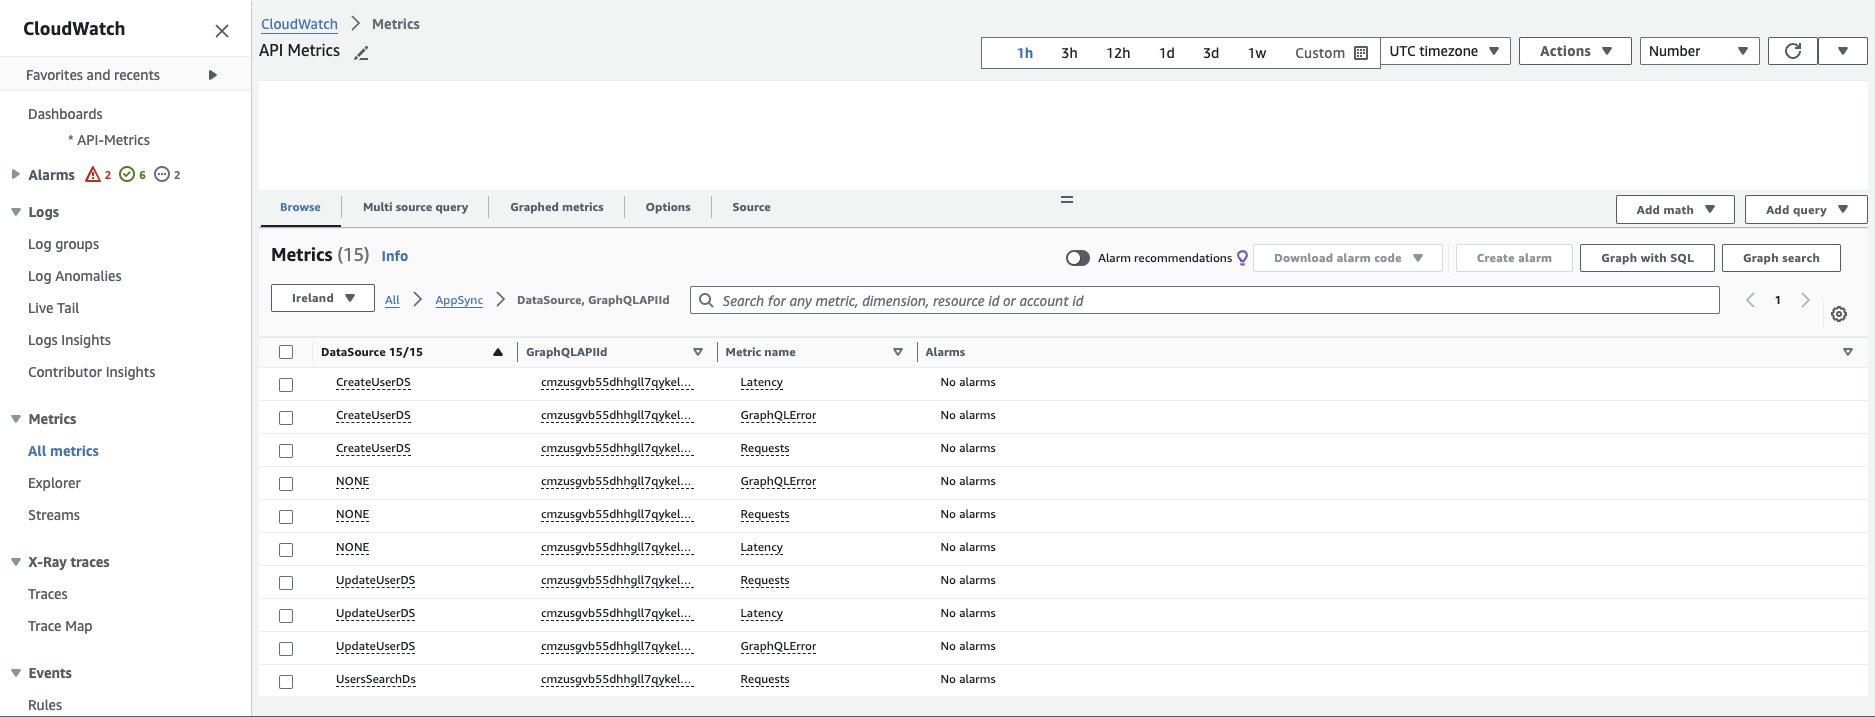
Figure 4: AWS AppSync API Metrics by Datasource
API Metrics per Operation
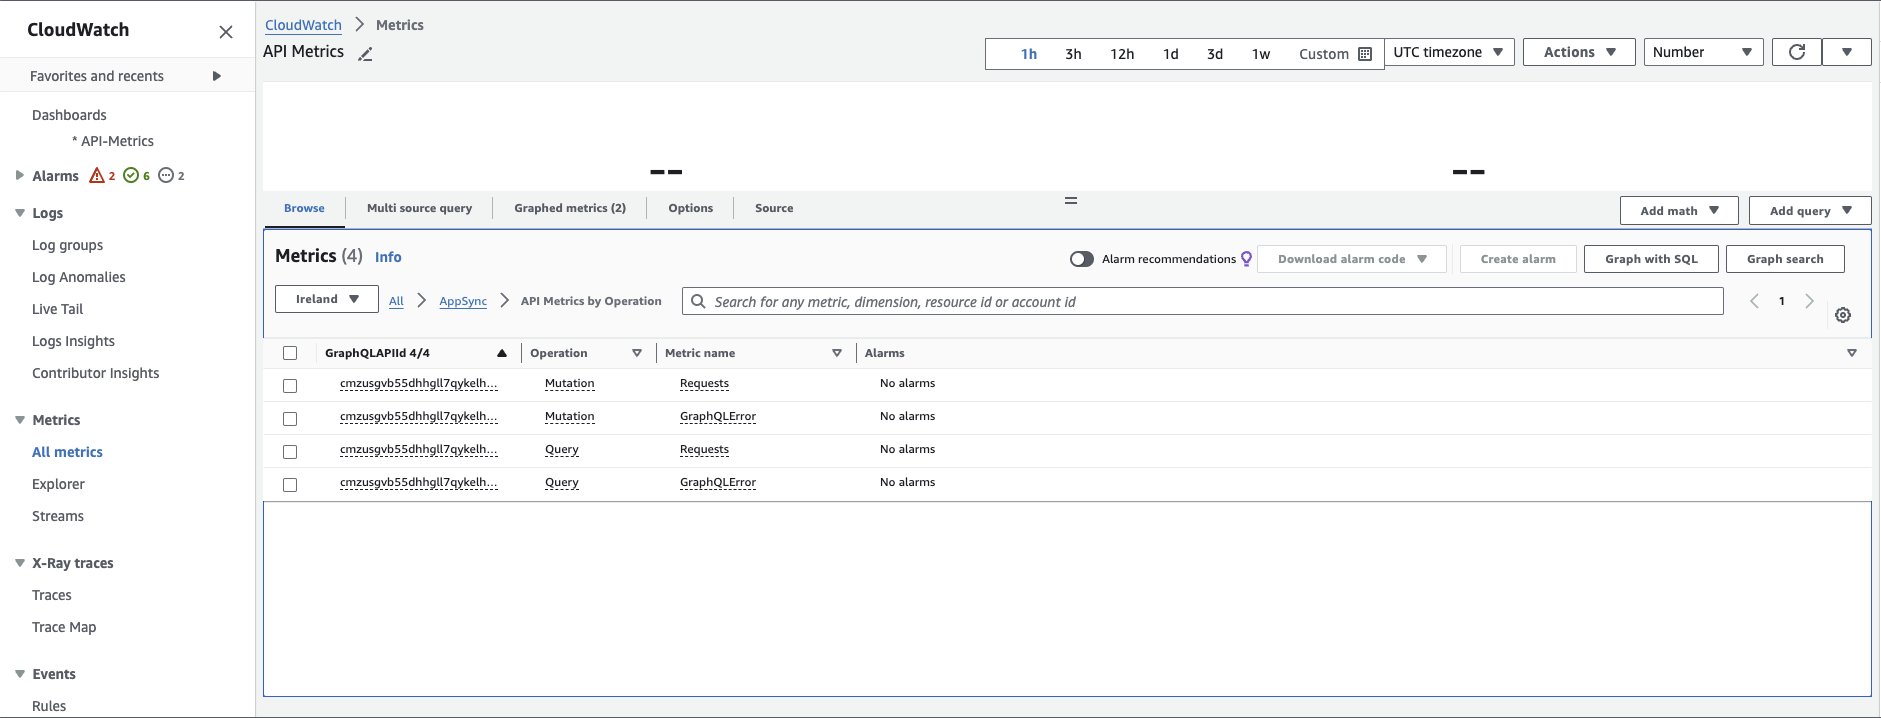
Figure 5: AWS AppSync API Metrics by Operation
API metrics custom dashboard with enhanced metrics
With AWS AppSync’s enhanced monitoring metrics, you can create a custom CloudWatch dashboard to get a real-time view of your API’s performance and display key KPIs like resolver latency, error rates, throttling, and data source performance. This helps quickly identify bottlenecks, track usage patterns, and optimise API efficiency.
For example, you can set up widgets on your Amazon CloudWatch dashboard to monitor:
- Resolver Request Count: This will provide insights into usage patterns, guiding the team to optimise the most frequently used data sources and resolvers.
- Resolver Latency: Track the time taken by each resolver to process requests, helping you pinpoint areas that may require optimisation.
- Data Source Performance: Visualise the interaction between your API and its data sources, such as DynamoDB or Lambda, to ensure they are performing within acceptable thresholds.
- Error Rates: Display the number of errors encountered by each resolver or data source, enabling you to identify and address issues before they impact users.
By aggregating these metrics into a single dashboard, you gain a holistic view of your API’s health, enabling proactive management and optimisation to deliver a seamless user experience.
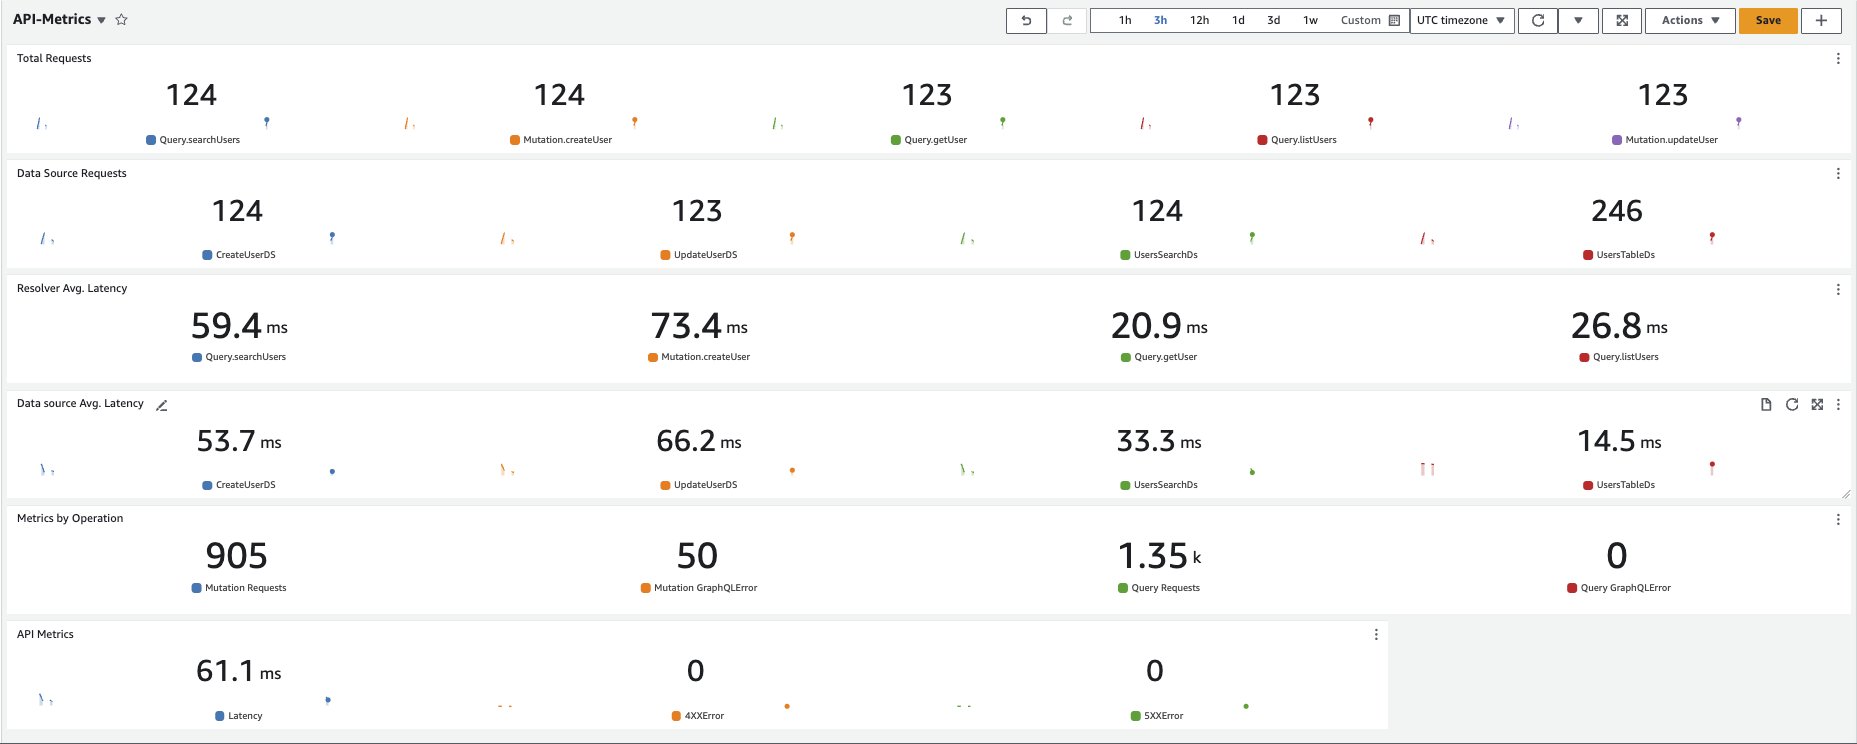
Figure 6: Custom Amazon CloudWatch dashboard to show API Metrics
Actionable insights from API monitoring
Using the insights from an API metrics dashboard with enhanced metrics like those provided by AWS AppSync, you can take several actions to improve your API’s performance and reliability. Here are some specific actions you can take based on the metrics you monitor:
High resolver request count
- Enable AppSync Caching: Use AppSync’s built-in caching to store results of frequently requested resolvers, reducing load on data sources. Set an appropriate TTL (Time to Live) for optimal balance between freshness and performance.
- Smaller Functional Units: Break down complex resolvers into smaller units. This improves visibility and makes it easier to identify and optimse specific tasks within your API.
High resolver latency
- Implement AppSync Caching: Cache responses for expensive queries to reduce latency for repeated requests.
- Optimise Resolvers: Refactor resolver logic to minimise processing time, such as reducing unnecessary computations or data transformations.
- Optimise Data Fetching: Ensure efficient database queries. Use indexes in DynamoDB and optimise SQL queries with proper indexing.
- Batch Operations: Use batch operations to minimise the number of data source calls. For example, use DynamoDB’s BatchGetItem for fetching multiple items in one request.
Poor data source performance
- Optimise AWS Lambda Functions: Increase memory allocation or refactor code for more efficient execution. Use Lambda’s metrics to identify performance issues.
- Use DynamoDB Accelerator (DAX): Integrate DAX to reduce read latency for high-traffic DynamoDB data sources by caching responses in-memory.
- RDS Optimisation: Utilise RDS read replicas for distributing read load and optimise queries with proper indexing.
Increased error rates
- Investigate and Resolve Issues: Use CloudWatch and AppSync logs to pinpoint and fix resolver or data source errors.
- Implement Retry Mechanisms: Use retry logic for transient errors or AWS SDK’s automatic retries to handle network interruptions.
- Improve Input Validation: Add validation to catch invalid or malformed requests early, preventing errors and providing informative messages to clients.
Frequent throttling occurrences
- Increase Throttling Limits: Adjust throttling limits in AppSync (using AWS WAF) or data sources like DynamoDB for legitimate high traffic.
- Optimise API Usage: Guide clients to reduce redundant requests and use efficient query structures.
- Implement Rate Limiting and Backoff: Apply rate limiting and exponential backoff on the client side to manage request rates and prevent hitting throttling limits.
Cost considerations
Enhanced Monitoring emits additional metrics that incur charges in Amazon CloudWatch. Here’s a breakdown based on the sample API:
Calculating costs — Example estimation using the sample API
Example calculation:
Total no. of new metrics = 5 (3 queries + 2 mutations) * 5 (additional enhanced metrics) + 4 (No. of Data sources) * 3 (additional enhanced metrics) = 37
Monthly Amazon CloudWatch Metrics Charges @ $0.30 per custom metric = 37 * $0.30 = $11.10
Note: Once you exceed 10,000 total metrics then volume pricing tiers will apply – To see the detailed pricing table, click the Metrics tab on the Amazon CloudWatch pricing page.
Reviewing costs
Using AWS Data Exports you can get an approximate cost breakdown of an existing AWS AppSync API by following these steps:
- Enable the enhanced monitoring temporarily on an AppSync API as seen above.
- Execute queries or mutations against the AppSync API.
- Setup Cost Data Export
- Use Amazon Athena to process Data Exports using the Crawlers.
- Run the Crawler (see Crawler docs), and wait until it completes its run.
- Replace with the Crawler’s target table.
- Replace placeholders in the query below:
<glue table>: Crawler’s target Glue table<account>: AWS account where AppSync is set up<region>: Region where AppSync is set up
- Query Athena with the SQL query below by adjusting
line_item_usage_start_date,line_item_usage_end_dateto compare the following datasets:- During a timeframe when enhanced metrics were not yet used.
- During a timeframe when enhanced metrics were already active.
Sample Athena SQL (adjust placeholders):
SELECT
line_item_operation,
SUM(CAST(line_item_unblended_cost AS decimal(16,8))) AS TotalSpend
FROM ''
WHERE
product_product_name = 'AmazonCloudWatch'
AND line_item_usage_account_id = ''
AND product_region = ''
AND line_item_operation in ('MetricStorage:AWS/AppSync', 'GetMetricData', 'ListMetrics', 'GetMetricStatistics', 'PutMetricData')
AND line_item_line_item_type NOT IN ('Tax','Credit','Refund','EdpDiscount','Fee','RIFee')
AND line_item_usage_start_date > DATE('2024-07-20')
AND line_item_usage_end_date < DATE('2024-07-30')
GROUP BY line_item_operation
ORDER BY TotalSpend DESC;
Example output:
# line_item_operation TotalSpend
1 GetMetricData 59.11682000
2 MetricStorage:AWS/AppSync 0.56626344
3 PutMetricData 0.42279000
4 ListMetrics 0.00248000
5 GetMetricStatistics 0.00028000
You can extract other details out of the data export by reviewing the Line item details and Usage types.
Metrics retention
CloudWatch retains metrics data as follows:
Data points with a period of less than 60 seconds are available for 3 hours. These data points are high-resolution custom metrics.
- Data points with a period of 60 seconds (1 minute) are available for 15 days
- Data points with a period of 300 seconds (5 minutes) are available for 63 days
- Data points with a period of 3600 seconds (1 hour) are available for 455 days (15 months)
Data points that are initially published with a shorter period are aggregated together for long-term storage. For example, if you collect data using a period of 1 minute, the data remains available for 15 days with 1-minute resolution. After 15 days this data is still available, but is aggregated and is retrievable only with a resolution of 5 minutes. After 63 days, the data is further aggregated and is available with a resolution of 1 hour.
Conclusion
AWS AppSync’s Enhanced Monitoring is a powerful tool that provides deeper insights into your API’s performance, delivering granular visibility to accelerate issue detection and remediation and reduce mean time to resolution. While there is an associated cost, the value it brings in terms of operational efficiency and improved user experience is substantial. By leveraging Enhanced Monitoring, you can ensure that your AWS AppSync APIs are optimised, reliable, and scalable.
Monitoring provides valuable data that empowers you to make informed decisions and drive your business forward. Ready to take your API performance to the next level? Activate Enhanced Monitoring in AWS AppSync for the detailed insights you need to keep your APIs running smoothly.