AWS Cloud Operations Blog
AWS observability maturity assessment: from guesswork to a blueprint
Introduction
Most teams know they should have good observability. Few can answer the two questions that matter: How good is our observability posture today, and what should we fix first? Without an objective way to measure, prioritization defaults to intuition, tribal knowledge, and the most recent escalation. The service that paged someone last night gets attention, while quieter gaps go unaddressed until they become the next incident.
Observability maturity is not a single switch you flip. It is a journey across several dimensions: logs, metrics, traces, dashboards, alerting, and organizational practices. Most teams land at different points on that journey in each dimension. The hard part is seeing the whole picture objectively instead of guessing. As modern AI and machine learning workloads enter the picture, the surface area grows further, making a structured baseline more important than ever.
This post introduces a read-only, open-source assessment that scores your AWS observability against a maturity model and hands you a prioritized blueprint in minutes. The post covers two things in order: first the maturity model that defines what “good” looks like, then the assessment that measures where you stand and turns the result into a roadmap.
By the end of this post, you can:
- Describe the three maturity stages and five categories the model measures
- Deploy and run the assessment against your own AWS account
- Interpret the report to identify improvements and prioritize next steps
The observability maturity model
A maturity model is a shared frame of reference. It describes what increasing capability looks like in concrete, measurable terms, so a team can place itself and agree on what “better” means. Observability needs a maturity model because the gap between reactive and proactive operations is not about buying more tooling; it is about how consistently and intelligently you use what you have.
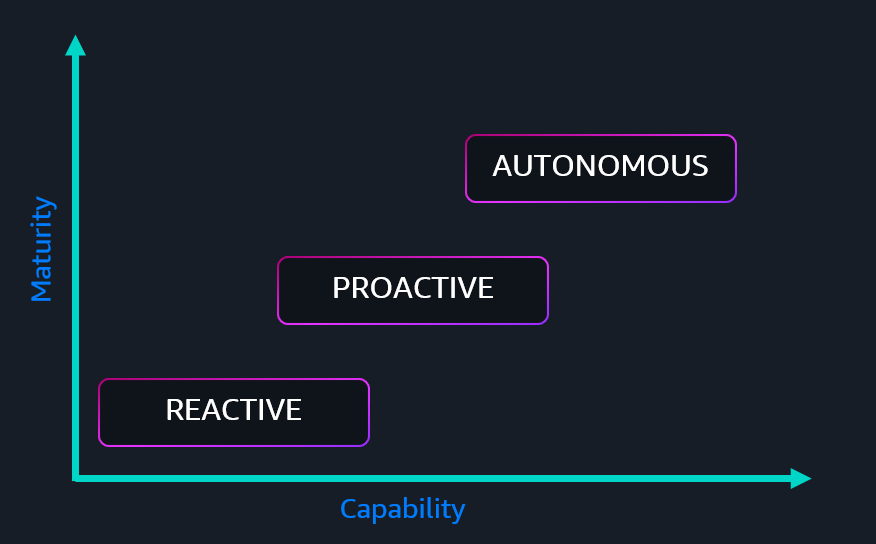
Figure 1: AWS Observability Maturity Model Stages
The five categories the model measures
The model evaluates observability across five dimensions:
Logs: collection coverage across compute types, structured logging, centralized and cross-account access, and retention policies for Amazon CloudWatch Logs.
Metrics: infrastructure, custom, and application metric collection; how metrics are used; and centralized, cross-account access for Amazon CloudWatch Metrics.
Traces: distributed tracing instrumentation (AWS X-Ray, the AWS Distro for OpenTelemetry, and OpenTelemetry), and whether traces are correlated with logs and metrics for root-cause analysis.
Dashboards & Alerting: alarm strategy, the use of adaptive or anomaly-based thresholds rather than static ones for Amazon CloudWatch alarms, and Amazon CloudWatch dashboards maturity.
Organization: enterprise observability strategy across your AWS Organizations, service level objectives (SLOs), return-on-investment awareness, AI-assisted operations, and real user monitoring.
The three maturity stages
Across those categories, the model describes a journey through three stages, from firefighting to self-healing:
Reactive: Observability is manual, inconsistent, and used mostly after something breaks. Teams often learn about problems from their customers, and troubleshooting is after-the-fact log diving.
Proactive: Instrumentation is consistent and standardized across the environment. Dashboards, alarms, and SLOs surface issues before customers feel them, so teams detect and respond ahead of impact.
Autonomous: Observability is automated and self-improving. Adaptive and anomaly-based detection, automated remediation, and AI-assisted root-cause analysis mean the system detects, diagnoses, and corrects on its own. AWS services are already making this stage tangible. Amazon CloudWatch Omni brings AI-powered, natural-language querying across logs, metrics, and traces, while Amazon CloudWatch Investigations accelerates root-cause analysis. AWS DevOps Agent goes a step further, autonomously triaging incidents, suggesting mitigations, and driving remediation end to end.
You can be operating at different stages in each category, and that is expected. You might be Proactive on metrics and dashboards but still Reactive on tracing. That unevenness is the signal you use to decide where to invest next.
The assessment that measures against the model
Knowing the stages is only half the picture; you also need to know where you stand. The open-source assessment answers that question by inspecting your AWS environment and scoring it against the model.
How it works
The assessment runs 52 read-only discovery checks mapped to 17 questions across the five categories. Each question is scored on evidence gathered from your environment, and the scores roll up into a per-category maturity stage and an overall picture. Internally, each question is scored on a 1.0–4.0 scale, and the tool translates those numbers into the three stages from the model:
Reactive (below 2.0): little or ad-hoc, after-the-fact observability.
Proactive (2.0 to below 3.5): standardized instrumentation, dashboards, alarms, and SLOs.
Autonomous (3.5 and above): adaptive and anomaly-based detection, automation, and AI/ML-assisted operations.
What it inspects
The checks look at the signals you would expect an observability review to cover, including logs, metrics, traces, dashboards, alarms, and SLOs across your compute services, plus AI-assisted operations capabilities such as Amazon CloudWatch Investigations, Amazon CloudWatch Omni and AWS DevOps Agent
Running the assessment
The assessment runs inside AWS CodeBuild, provisioned by a single AWS CloudFormation template. Deployment takes roughly five minutes; the scan itself runs in about fifteen minutes depending on the number of resources in your account.
Prerequisites
- AWS Command Line Interface (AWS CLI) installed and configured with a principal that can create CloudFormation stacks in the target AWS workload account with AWS Identity and Access Management (IAM) resources (CAPABILITY_NAMED_IAM).
- Primary AWS Region: Identify the Region where your workloads run.
- Read-only access: the assessment uses only read-only API calls (Describe, List, Get). One exception is the Amazon Elastic Compute Cloud (Amazon EC2) CloudWatch agent check uses the AWS Systems Manager (SSM) ssm:SendCommand action to verify agent status. For the complete IAM policy, see IAM Permissions.
Scoping the run
The assessment supports both single-account and multi-account modes. In multi-account mode, a central account assumes a read-only role in each target account and produces a consolidated summary. The steps below walk through a single-account assessment.
For detailed instructions and multi-account setup options, see the repository: https://github.com/aws-samples/sample-aws-observability-assessment.
Get the template
Clone or download the repository at https://github.com/aws-samples/sample-aws-observability-assessment.
Create the stack
For a single-account assessment, deploy only the CodeBuild template. The default configuration creates the assessment role in the same account:aws cloudformation create-stack \ --stack-name ObservabilityAssessmentCodeBuild \ --template-body file://2-observability-assessment-codebuild.yaml \ --parameters ParameterKey=AssessmentRegion,ParameterValue=<region> \ ParameterKey=CreateAssessmentRole,ParameterValue=yes \ --capabilities CAPABILITY_NAMED_IAM \ --region <region>
Stack creation triggers the first build automatically. Wait for the build to finish.
Download the HTML report
Look up the ReportBucketName value in the stack outputs. CodeBuild uploads the HTML report file to the bucket. Download the HTML file from the Amazon Simple Storage Service (Amazon S3) bucket and open it locally in a browser. The report is self-contained, with no external dependencies.
The assessment output
The assessment produces an interactive HTML report with bar charts, per-category and per-question maturity scores, the evidence behind each score, and actionable recommendations linked to AWS documentation.
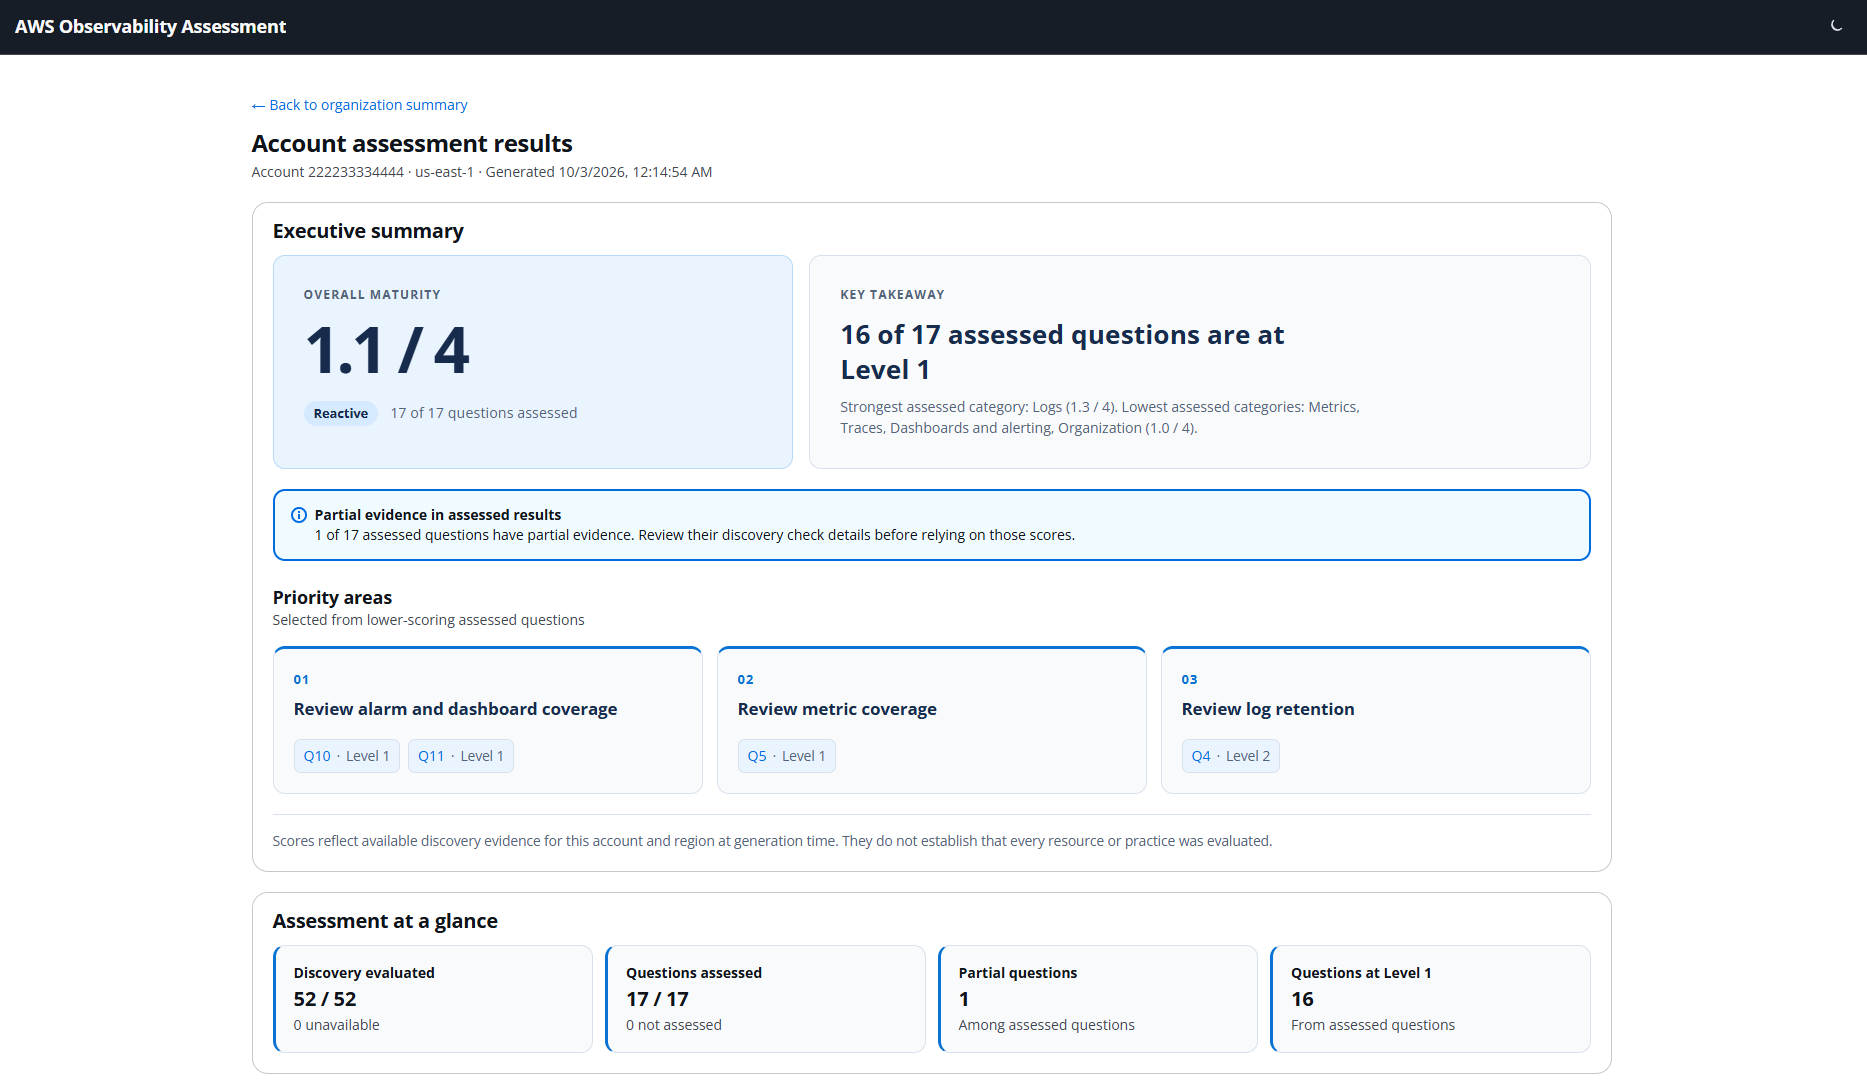
Figure 2: AWS Observability Maturity Assessment Executive Summary
Figure 2 shows what the executive summary looks like for a sample account. The overall maturity score is 1.1 out of 4, meaning the environment is firmly in the Reactive stage. 16 of 17 assessed questions scored at Level 1, and the tool flags three priority areas: review alarm and dashboard coverage, review metric coverage, and review log retention.
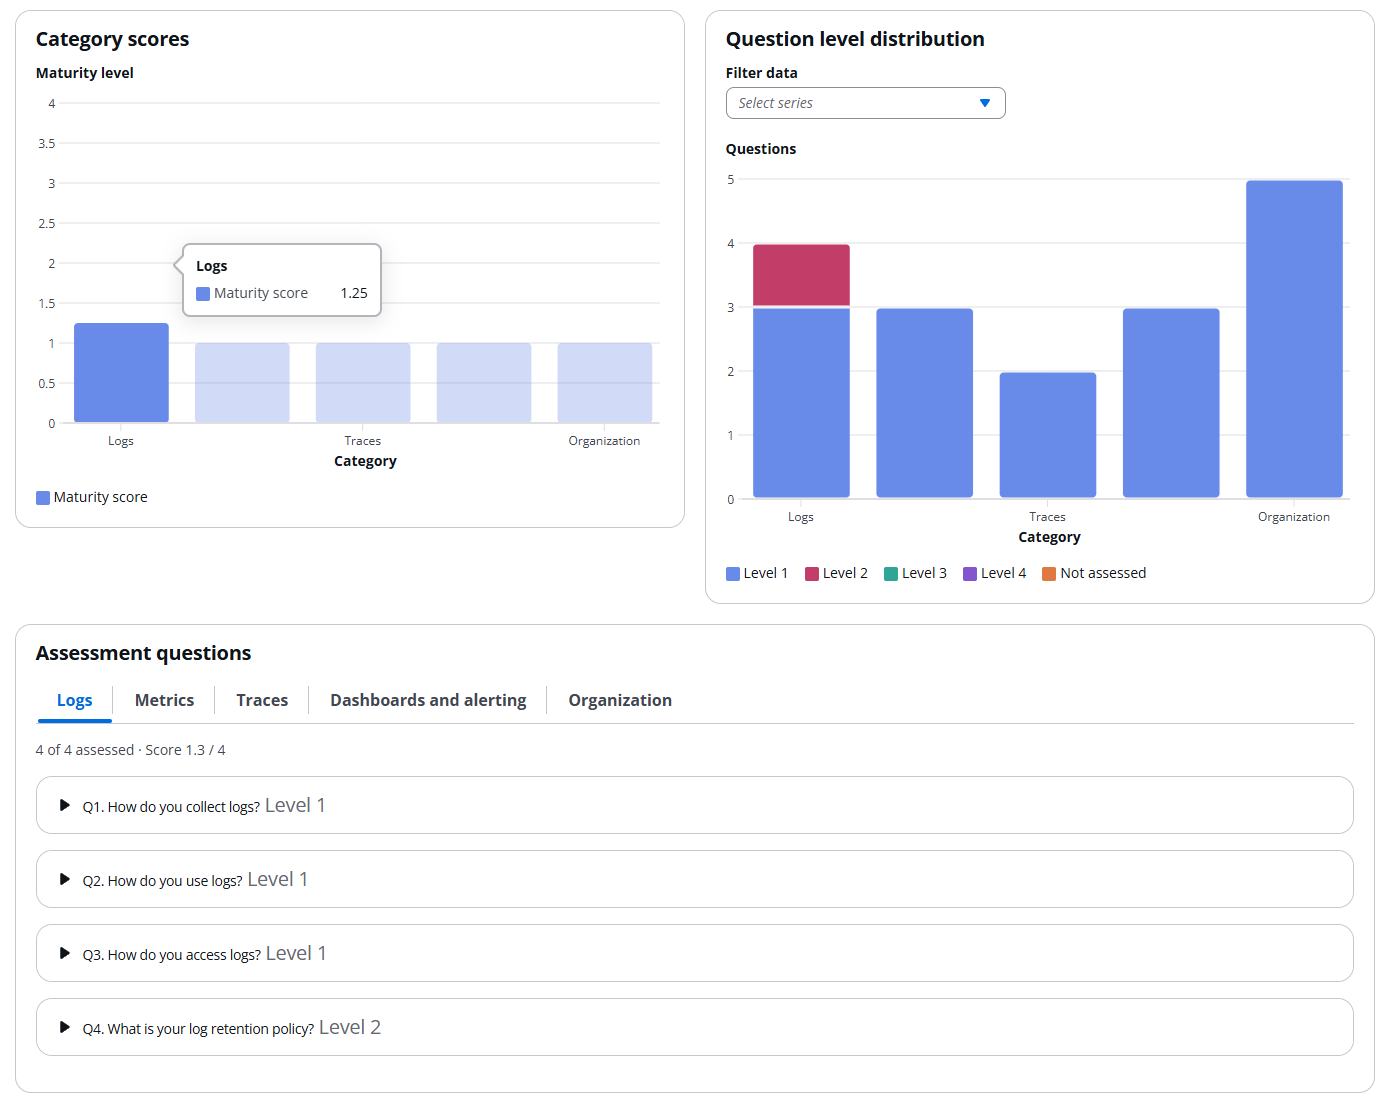
Figure 3: Observability Maturity Assessment category level maturity
Figure 3 shows the results breakdown by category. A bar chart ranks each of the five categories by maturity score, making it easy to spot the weakest area at a glance. In the sample report, Logs scores 1.3, Metrics and Traces sit near 1.0, and the Dashboards & Alerting and Organization categories are similarly low. A stacked column chart beside it shows how many questions in each category fall at Level 1, 2, 3, or 4. Below the charts, the assessment questions panel lets you drill into individual questions, their scores, and the evidence behind them.
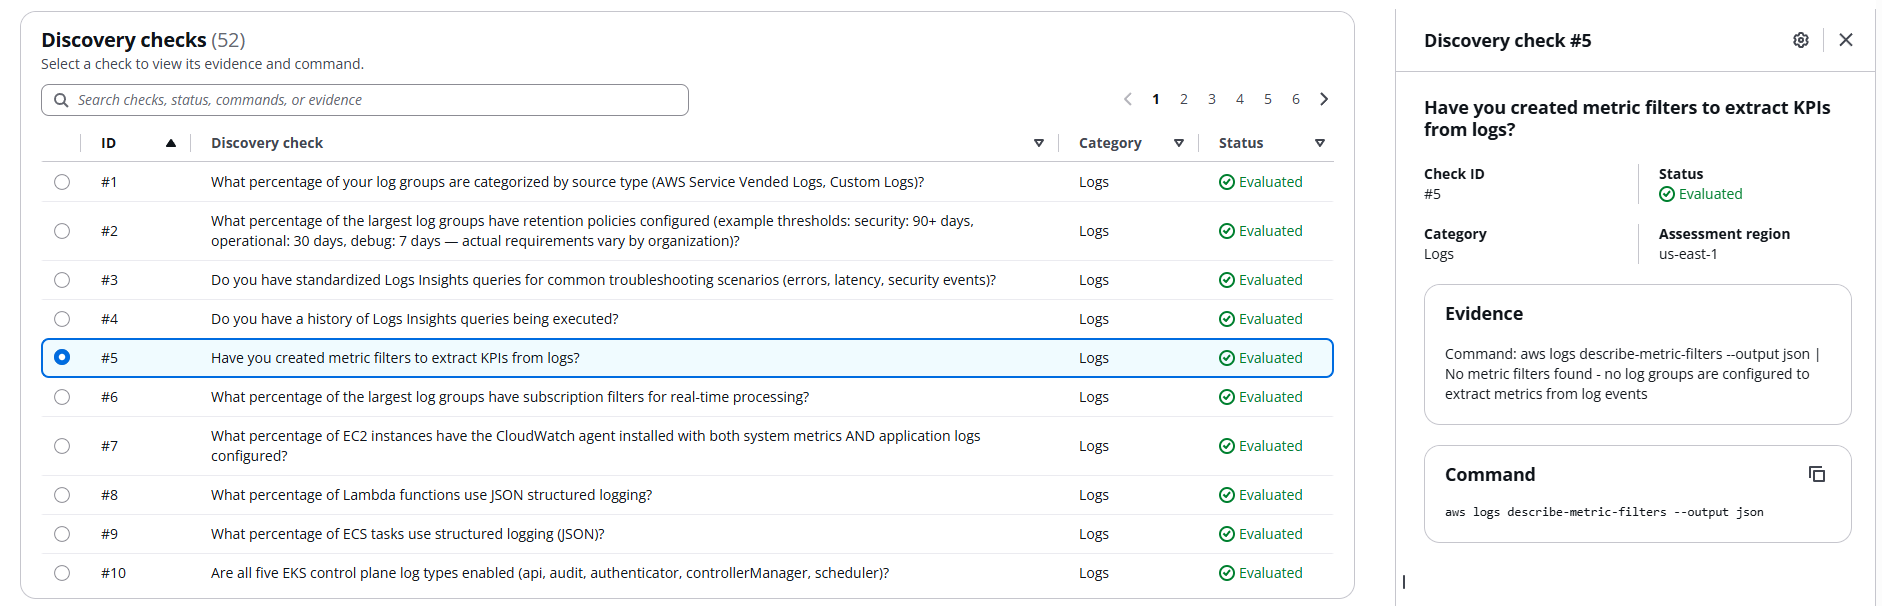
Figure 4: Observability Maturity Assessment discovery checks and evidence
Figure 4 shows the discovery checks interface. The left panel lists all 52 checks with their evaluation status and category label. Selecting a check reveals its detail on the right: the category, stage, level, the evidence the tool collected, and the CLI command it ran. This transparency lets you audit exactly what the assessment found and verify each score against your own environment.
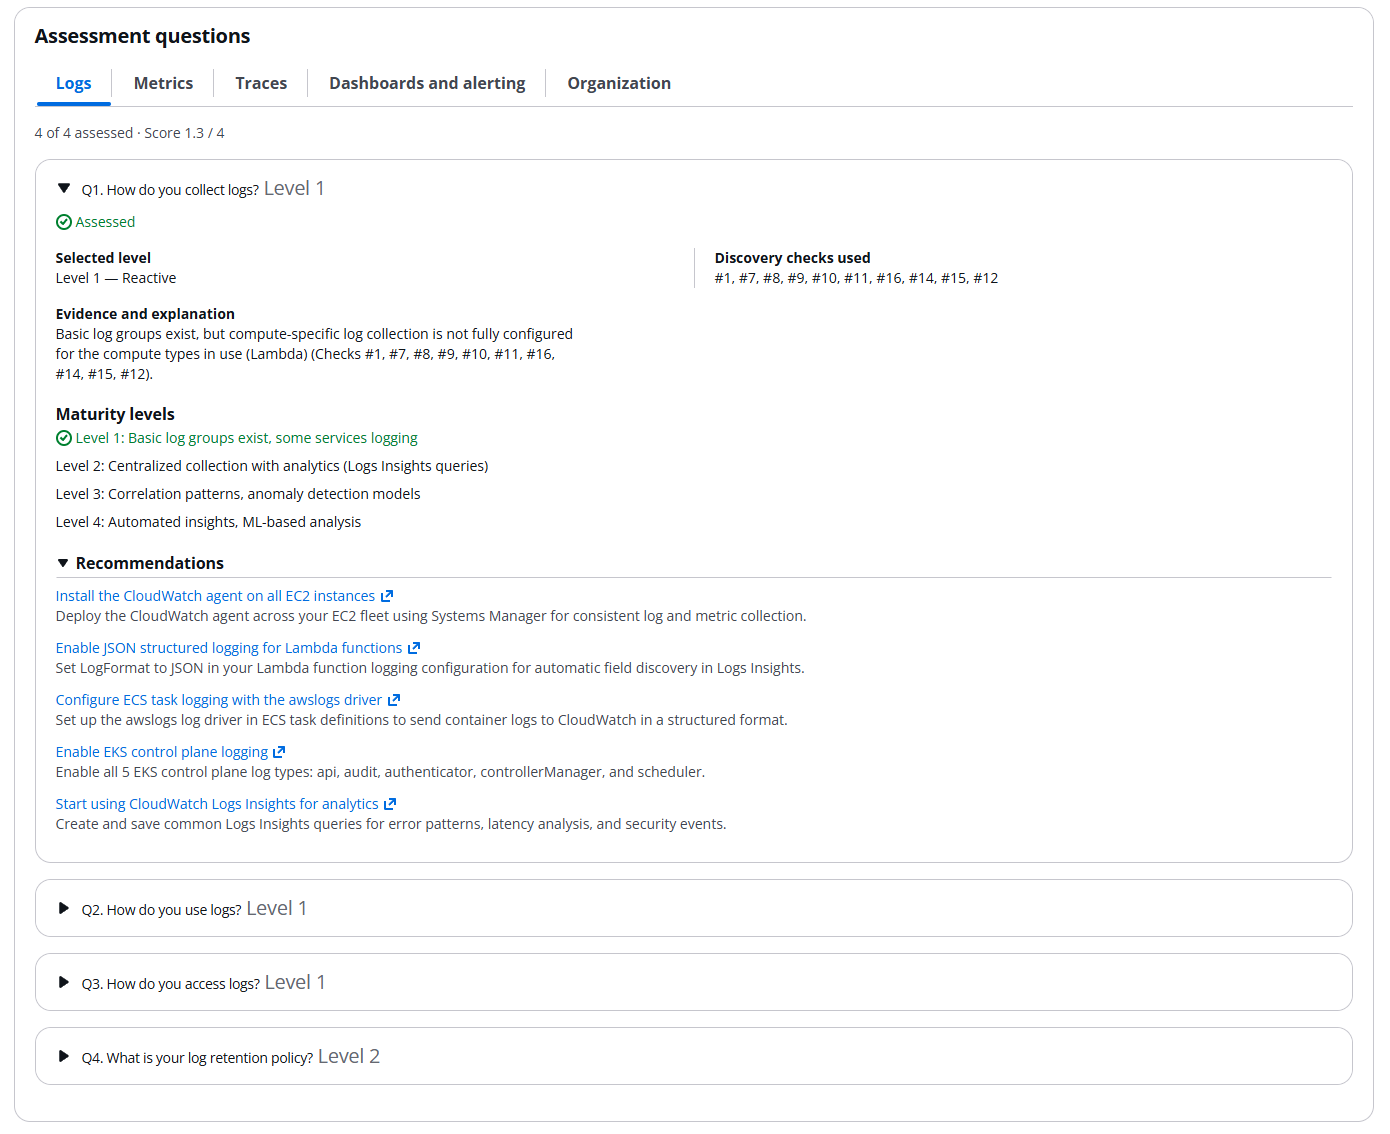
Figure 5: Observability Maturity Assessment question evidence and recommendations
Figure 5 describes the detail view for Q1 (log collection), including the maturity level ladder, discovery check references, evidence, and linked recommendations.
Reviewing results and prioritizing next steps
- Start with the bar chart. Your lowest-scoring category is your highest-leverage starting point; it is where a given unit of effort moves your overall maturity the most.
- Follow the evidence. Each question shows the specific discovery findings behind its score, so you are not guessing why a category landed where it did. If tracing scored Reactive, the report shows which services lack instrumentation.
- Turn recommendations into a roadmap. Each recommendation links to AWS prescriptive guidance, so a low score becomes a concrete next action rather than an abstract “do better.”
- Re-run over time. The assessment is not a one-time exercise; it is designed to be repeated. Because every run is a point-in-time snapshot, re-scanning each quarter (or after a major infrastructure change) turns the maturity model into a continuous-improvement loop. Re-running after you act on recommendations lets you validate that changes had the intended effect, and it surfaces the next set of priorities. Over time, you can see categories move from Reactive to Proactive to Autonomous as your efforts compound.
Worked example
Consider the sample account in Figures 2 through 5. The executive summary (Figure 2) reports an overall maturity of 1.1 out of 4, with 16 of 17 questions at Level 1, placing the environment squarely in the Reactive stage.
The category bar chart in Figure 3 shows Logs at 1.3 out of 4, the lowest-scoring category and therefore the highest-leverage starting point. Three of its four assessed questions sit at Level 1; only one reaches Level 2.
Drilling into “How do you collect logs?” in Figure 5 reveals the evidence: seven discovery checks found that log groups are only partially centralized, structured JSON logging is not enabled for Lambda, and ECS log routing is not configured. The recommendations link directly to AWS prescriptive guidance: enable structured logging, configure FireLens to route Amazon ECS logs, and standardize log group provisioning through CloudFormation templates.
Acting on those three recommendations would lift Q1 toward Level 2. Re-running the assessment after incorporating these changes captures the improvement and surfaces the next set of priorities.
Cleanup
Delete the CloudFormation stack (aws cloudformation delete-stack) and empty and delete the Amazon S3 report bucket.
Conclusion
Observability maturity is a journey, and knowing your starting point helps you plan the path. The maturity model gives you a shared definition of what Reactive, Proactive, and Autonomous look like across logs, metrics, traces, dashboards and alerting, and organizational practice. The assessment tells you where you stand on that shared map, backed by evidence from your own environment. And the recommendations chart the route from here to there.
Get started: deploy the assessment, run it against your primary Region, tackle your lowest-scoring category first, and re-scan next quarter to measure progress. The tool is read-only and open source, and it has no cost beyond the underlying AWS resources. Clone the AWS Observability Assessment repo on GitHub, run it against your accounts, and get an objective answer to “how good is our observability, and what do we fix first?”