AWS Cloud Operations Blog
Deploy OpenTelemetry Gateway on AWS: Monitoring Your Observability Pipeline
At scale, your telemetry pipeline is likely growing faster than your ability to monitor it. Teams invest heavily in observing their applications’ traces, metrics, and logs but rarely ask a critical question: who is watching the watchers? When your observability pipeline silently drops data due to backpressure, network issues, or misconfiguration, you lose visibility precisely when you need it most.
This post walks you through deploying an OpenTelemetry Gateway on Amazon EKS and instrumenting the gateway itself so you can detect pipeline degradation. Let’s call this pattern “Monitor the Monitoring Pipeline”. Through this post, you will learn how to configure the OpenTelemetry gateway, expose its health metrics, forward those metrics to Amazon CloudWatch using the recently launched native OpenTelemetry metrics support, build PromQL-based dashboards utilizing PromQL Query Studio, and alarms that alert you when your observability infrastructure needs attention.
OpenTelemetry Collector Deployment Patterns
The OpenTelemetry Collector supports three primary deployment patterns on Kubernetes, each suited to different operational requirements.
Agent mode deploys collectors as a DaemonSet with one collector pod per node. Agents collect node-level metrics and logs, handle local service discovery, and forward telemetry upstream with minimal configuration.
Sidecar mode runs a collector container alongside each application pod. The main advantage is simplicity because each pod contains both the application and collector, no service discovery is needed. However, this doubles your container count and requires managing CPU and memory allocation individually for each pod, which can lead to over- or under-allocation at scale.
Gateway mode deploys collectors as a standalone Kubernetes Deployment, exposing a single OTLP endpoint that applications or other collectors send telemetry to. For a scaled production setup, as your cluster grows to hundreds of pods across many nodes, having every workload authenticate and export to CloudWatch directly means duplicated credentials, thin per-pod batches, and no central place to filter or control cost. The gateway consolidates that into a single egress tier that batches efficiently, scales independently, and becomes the one scalable, reliable, fault tolerant place to add sampling, filtering, and multi-backend routing.
This post implements the agent-to-gateway pattern. OTel-instrumented workloads send telemetry to an OTel agent (a DaemonSet), which enriches and forwards it to a centralized OTel gateway (a Deployment). The gateway batches, authenticates, and exports to CloudWatch using native OpenTelemetry support, and self-monitors its own health. Alongside it, the CloudWatch Observability EKS add-on provides infrastructure observability (node, pod, container metrics and logs via Container Insights) which is the layer beneath the pipeline, so you can tell whether a degradation is the pipeline or the nodes it runs on. Let’s now see how to deploy this pattern and monitor the telemetry pipeline.
Prerequisites
- Amazon EKS cluster running Kubernetes 1.31 or later
- OIDC provider configured for IAM Roles for Service Accounts (IRSA)
- AWS CLI v2 and kubectl with cluster access
- IAM role for the gateway ServiceAccount with CloudWatchAgentServerPolicy managed policy attached. The CloudWatch Observability add-on service account also needs CloudWatch permissions (CloudWatchAgentServerPolicy) via IRSA or EKS Pod Identity
- Outbound network access to CloudWatch endpoints from the cluster
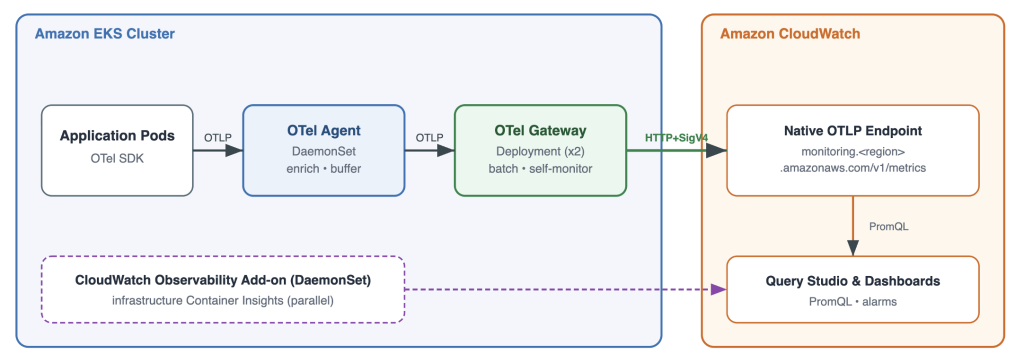
Figure 1: Architecture
The data flow:
- EKS workloads emit telemetry over OTLP to a node-local OTel agent (DaemonSet)
- CloudWatch Observability EKS Add-on sends infrastructure metrics and container logs to CloudWatch in parallel via Container Insights
- OTel Collector Gateway (Deployment) receives telemetry from the agents, batches, and self-monitors
- Agents handle local collection and Kubernetes-metadata enrichment; the gateway is the centralized control point
- Gateway exports via OTLP HTTP+SigV4 to CloudWatch native OTLP endpoint (monitoring.<region>.amazonaws.com/v1/metrics)
- CloudWatch PromQL Query Studio is used to query gateway and application metrics with PromQL
- CloudWatch Dashboard is used to visualize pipeline health and application performance
Step 1: Enable the CloudWatch Observability EKS Add-on
Install the add-on which provides infrastructure observability for the cluster, alternatively refer Install the CloudWatch agent with the Amazon CloudWatch Observability EKS add-on or the Helm chart for more options.
This deploys the DaemonSet agents that handle infrastructure observability like node metrics, container logs, and Kubernetes metadata and send it to CloudWatch via Container Insights. Application telemetry is handled separately by the gateway in Step 3.
Step 2: Deploy the OpenTelemetry Collector Gateway
Deploy the gateway namespace, IRSA-annotated ServiceAccount, ConfigMap, Deployment (2 replicas), and Service from the hosted manifest in this GitHub repo. Substitute your AWS account ID for the ServiceAccount’s role annotation:
The ServiceAccount is annotated with the OTelGatewayRole from the prerequisites (CloudWatchAgentServerPolicy attached), which lets the gateway export to CloudWatch via SigV4.
In a nutshell, there are two pipelines: “metrics” for application telemetry received from your instrumented workloads, and “metrics/internal” for the gateway’s own self-telemetry. The batch processor caps each export at 1,000 data points to stay within the CloudWatch OTLP request limit. The centralized gateway is the single, credentialed egress point to CloudWatch for all application telemetry.
Step 3: Deploy the OpenTelemetry agent (DaemonSet)
Run a self-managed OpenTelemetry Collector as a DaemonSet so every node has a local collector. Applications send OTLP to their node-local agent, which enriches telemetry with Kubernetes metadata (namespace, pod, node, deployment), batches it, and forwards it to the gateway over OTLP.
Deploy the agent tier namespace, ServiceAccount, RBAC, ConfigMap, DaemonSet, and Service from the hosted manifest:
kubectl apply -f https://raw.githubusercontent.com/aws-observability/observability-best-practices/main/sandbox/otel-gateway-deployment/agent.yaml Step 4: Send application telemetry to the agent
Point your OTel-instrumented workloads at their node-local agent using the standard OpenTelemetry environment variables. Application metrics then flow as app -> agent -> gateway -> CloudWatch:
env:
    - name: NODE_IP
      valueFrom:
        fieldRef:
          fieldPath: status.hostIP
    - name: OTEL_EXPORTER_OTLP_ENDPOINT
      value: "http://$(NODE_IP):4317"
    - name: OTEL_EXPORTER_OTLP_INSECURE
      value: "true"   # plaintext OTLP: in-cluster hop only; enable TLS across trust boundaries
Point workloads at the agent Service (otel-agent.otel-agent.svc.cluster.local:4317). Keep OTLP traffic in-cluster (ClusterIP, no public exposure) and restrict the agent/gateway OTLP ports with a NetworkPolicy, for sensitive telemetry, enable TLS between tiers. If the gateway restarts, the agent’s queue and retry buffer telemetry until it recovers.
Step 5: Verify telemetry is reaching the gateway
# Confirm the gateway pods are running
    kubectl get pods -n otel-gateway
# Then confirm data is arriving in CloudWatch Query Studio (PromQL), sample query to test:
     rate(otelcol_receiver_accepted_metric_points[5m])
Monitor the monitoring: Gateway self-telemetry
The “metrics/internal” pipeline scrapes the gateway’s own telemetry endpoint every 10 seconds and exports those metrics to CloudWatch. Sample health metrics:
|
Metric |
What it tells you |
|---|---|
| otelcol_receiver_accepted_metric_points | Data entering the pipeline |
| otelcol_receiver_refused_metric_points | Data dropped (non-zero = data loss) |
| otelcol_exporter_sent_metric_points | Data delivered to CloudWatch |
| otelcol_exporter_send_failed_metric_points | Failed exports |
| otelcol_exporter_queue_size | Current queue depth |
| otelcol_exporter_queue_capacity | Max queue capacity |
The export health ratio is sent vs accepted, this is your primary indicator. A healthy pipeline maintains near-1.0. Treat it as an SLO and alert when it drops below your target (as given below).
Alerting on pipeline degradation
You can also create CloudWatch Alarms using PromQL for sample conditions as below:
Queue saturation (data loss imminent)
max(otelcol_exporter_queue_size / otelcol_exporter_queue_capacity) > 0.8Export failures (backend connectivity)
sum(rate(otelcol_exporter_send_failed_metric_points[5m])) > 0Memory limiter activation (active data loss)
sum(rate(otelcol_receiver_refused_metric_points[5m])) > 0Export success ratio below SLO (primary indicator)
sum(rate(otelcol_exporter_sent_metric_points[5m])) / sum(rate(otelcol_receiver_accepted_metric_points[5m])) < 0.99Set the threshold to your SLO (e.g., 0.99), evaluate over a few periods to avoid flapping, and treat missing data as not breaching. The export-failures alarm above is the instant tripwire while this SLO catches sustained success-rate erosion.
PromQL in CloudWatch Query Studio
CloudWatch Query Studio provides a unified PromQL experience for your OTel metrics, examples as below:
Pipeline throughput:
sum(rate(otelcol_receiver_accepted_metric_points[5m])) 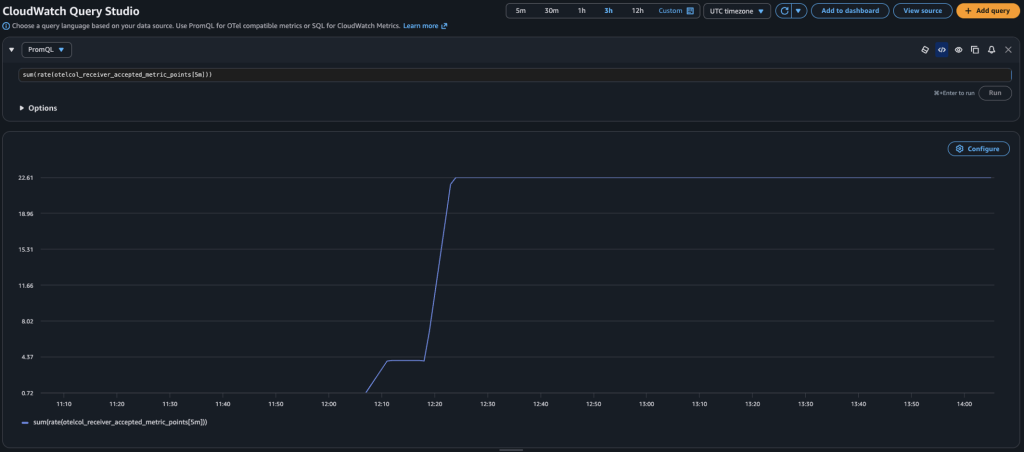
Export success rate (%):
sum(rate(otelcol_exporter_sent_metric_points[5m])) / sum(rate(otelcol_receiver_accepted_metric_points[5m])) * 100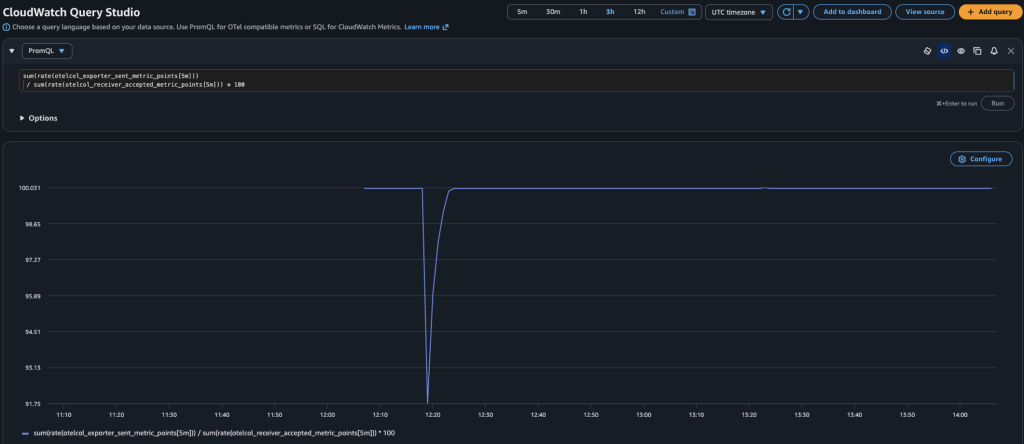
Queue utilization trend:
otelcol_exporter_queue_size / otelcol_exporter_queue_capacity * 100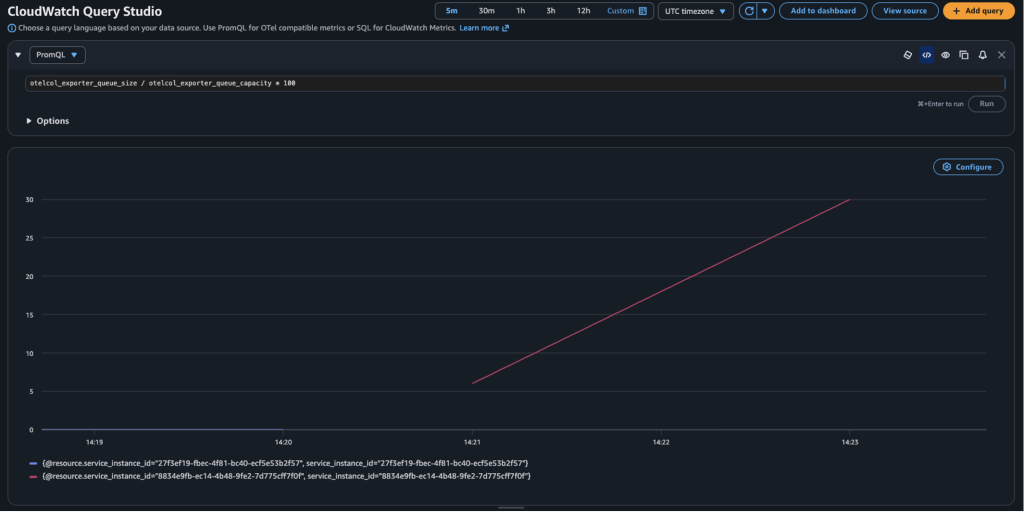
CloudWatch Dashboard
Create a CloudWatch Dashboard with widgets for:
- Throughput: rate(otelcol_receiver_accepted_metric_points[5m]) as a line graph
- Export success vs failure: stacked area showing sent and failed metric points
- Queue utilization: gauge showing current queue percentage
- Memory limiter: counter for refused metrics (target: zero)
Deploy it from the hosted manifest, put-dashboard reads a local file, so download the body first. This gives your operations team a single pane for pipeline health and trend analysis:
# Download the dashboard body, then create the dashboard
curl -sSL https://raw.githubusercontent.com/aws-observability/observability-best-practices/main/sandbox/otel-gateway-deployment/dashboard.json -o dashboard.json
aws cloudwatch put-dashboard \
   --dashboard-name OTel-Gateway-Pipeline-Health \
   --dashboard-body file://dashboard.json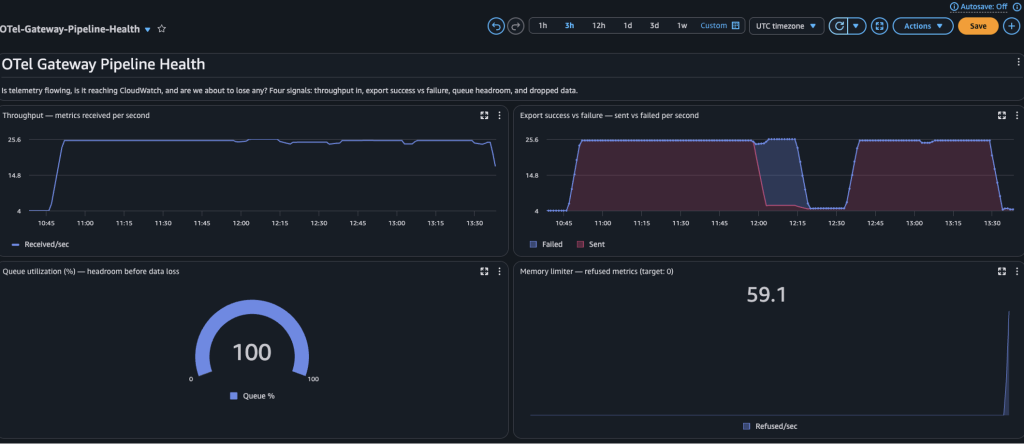
Scaling to multiple clusters
The walkthrough above ran the gateway on the same cluster as its workloads. As you add clusters, you don’t need a gateway in each one, you can promote it to a shared tier and run the gateway on a different cluster. You can expose it behind an internal Network Load Balancer and point every cluster’s agent at that endpoint. Workloads still forward to their node-local agent while the shared gateway handles batching, authentication, and export for all of them. Treat this as a centralization choice, one egress point to secure, monitor, and/or attach sampling, cost controls.
Patterns in this regard can be:
- Multiple clusters, one account, one VPC: When clusters share a VPC, agents reach the internal NLB directly with no extra networking. Change the gateway Service from ClusterIP to an internal NLB, point each remote cluster’s agent at the NLB DNS instead of the in-cluster Service, and restrict the load balancer’s security group to your clusters’ CIDRs. The gateway’s existing IRSA role exports to CloudWatch as before. As a security measure, because the hop leaves the pod network, enable TLS between agent and gateway, add mTLS if you want the gateway to authenticate senders.
- Multiple clusters, one account, different VPCs: Here, you could connect the VPCs with VPC peering or a Transit Gateway, then use the same internal NLB endpoint.
- Multiple clusters, multiple accounts: Here, you could expose the gateway over AWS PrivateLink so accounts connect privately and authenticate senders on the OTLP receivers. Then either route everything to one central CloudWatch via cross-account role assumption, or, even simpler, let each account export to its own CloudWatch and use metrics centralization to consolidate server-side. With centralization, AWS Organizations rules automatically replicate metrics from source accounts and regions into a central destination account. That destination account owns a copy of the metrics for querying and alarming, with no cross-account export setup on the gateways.
Sample manifests for the one-VPC pattern (the internal NLB Service and a remote-cluster agent) are in the companion repo:
# Hub cluster: swap the gateway's ClusterIP Service for an internal NLB.

          # Full manifest: multicluster-samevpc/gateway-nlb-service.yaml

          kubectl apply -f https://raw.githubusercontent.com/aws-observability/observability-best-practices/main/sandbox/otel-gateway-deployment/multicluster-samevpc/gateway-nlb-service.yaml

          # Spoke clusters: agent forwards across the VPC to the shared gateway via the NLB.

          # Full manifest: multicluster-samevpc/agent-remote.yaml

          kubectl apply -f https://raw.githubusercontent.com/aws-observability/observability-best-practices/main/sandbox/otel-gateway-deployment/multicluster-samevpc/agent-remote.yaml
Cleanup
CloudWatch dashboard, alarms, and metric ingestion incur AWS charges. See Amazon CloudWatch Pricing for details. Remember to delete these resources when you are finished to avoid ongoing charges.
# Delete the agent tier

           kubectl delete namespace otel-agent

           # Delete the gateway

           kubectl delete namespace otel-gateway

           # Remove any alarms you created as below

           aws cloudwatch delete-alarms --alarm-names \

           "OTelGateway-QueueSaturation" \

           "OTelGateway-ExportFailures"

           # Delete dashboard

           aws cloudwatch delete-dashboards --dashboard-names "OTel-Gateway-Pipeline-Health"
Conclusion
This post walked through the end-to-end setup for deploying an OpenTelemetry gateway on Amazon EKS workloads, utilizing CloudWatch’s native OpenTelemetry support. Your OTel-instrumented workloads no longer need vendor-specific exporters or proprietary agents, the same OTLP payload your apps already emit goes straight to CloudWatch via a standard HTTP endpoint. By combining native OpenTelemetry integration with a dedicated gateway that scrapes its health metrics, you built a self-monitoring observability pipeline.