AWS Cloud Operations Blog
GPU Cost Attribution in Amazon EKS Using Amazon Managed Service for Prometheus, Amazon Managed Grafana, and OpenTelemetry
As organizations scale their AI and machine learning workloads on Amazon Elastic Kubernetes Service (Amazon EKS), GPU instances often represent the largest portion of compute costs. Without granular visibility into how these resources are consumed, teams struggle to attribute costs accurately. Consider a shared EKS cluster where Team A (Research) runs experimental ML models on 3 GPU slices, Team B (Production AI) serves inference workloads on 2 GPU slices, and Team C (Data Science) processes datasets on 2 GPU slices. Across these 7 GPU slices, the organization needs to answer: who is using what, what does it actually cost, and where is the waste?
Without proper cost attribution, organizations face the below operational challenges:
Hidden Costs: IT departments struggle to accurately chargeback GPU costs to consuming teams, often resorting to rough estimates or equal distribution models that don’t reflect actual usage.
Resource Waste: Teams may over-provision GPU resources “just in case,” leading to significant waste when actual utilization is low. With GPU costs higher than CPU, even small efficiency gains translate to substantial savings.
Capacity Planning: Without visibility into actual vs. requested usage patterns, capacity planning becomes guesswork, potentially leading to either over-provisioning (wasted money) or under-provisioning (performance issues).
In this post, you build a GPU cost attribution solution for Amazon EKS using Amazon Managed Service for Prometheus, Amazon Managed Grafana, and OpenTelemetry.
Architecture
For this post, you will use NVIDIA’s Multi-Instance GPU (MIG) technology, which allows a single A100 GPU, for example, to be partitioned into up to 7 smaller instances, enabling better multi-tenancy. The solution uses a combination of AWS managed services and open-source tools to create a cost attribution system:
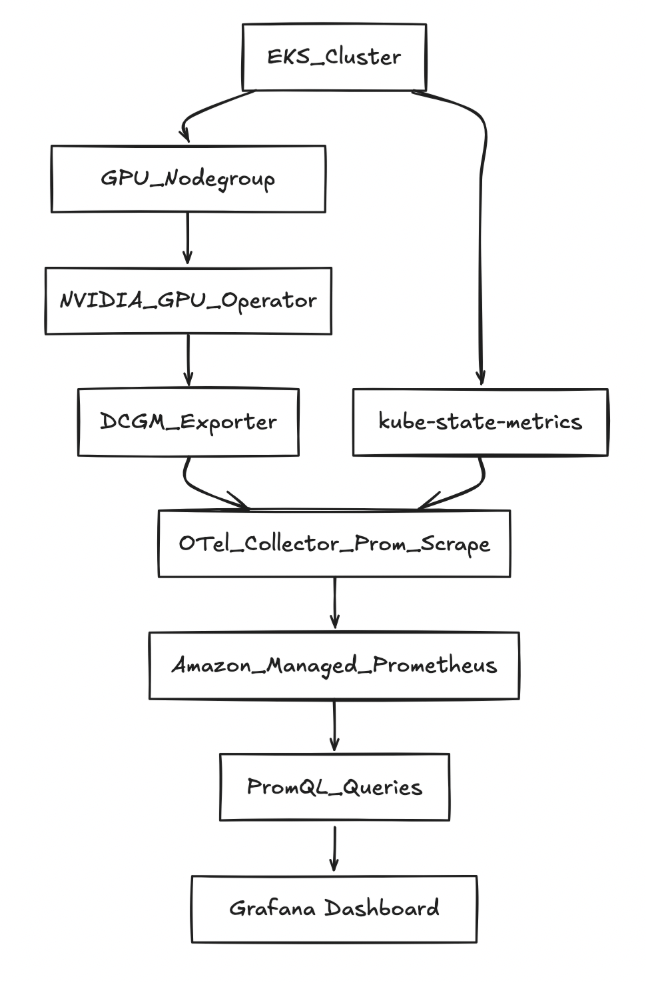
Figure 1: Architecture flow
The architecture enables three types of cost calculation:
- Allocated Cost: Based on Kubernetes resource requests (what teams asked for)
- Effective Cost: Based on actual GPU utilization (what teams used)
- Waste Cost: The difference between allocated and effective (optimization opportunity)
Note: Amazon Managed Service for Prometheus charges for metrics ingested and stored, and Amazon Managed Grafana charges per active user per month. Review the pricing pages for Amazon Managed Service for Prometheus and Amazon Managed Grafana to estimate costs for your environment. GPU instances also incur significant hourly charges.
Prerequisites
AWS + EKS prerequisites
- An AWS account
- Quota capacity for running GPU instances in your REGION
If you want to follow the step-by-step instructions detailed in this post, refer this link
An Observability-First Approach
Rather than building custom cost tracking solutions, You can build on existing observability tools to create a GPU cost attribution system.
Component 1: DCGM Exporter for GPU Metrics
NVIDIA’s Data Center GPU Manager (DCGM) Exporter serves as the foundation for GPU observability. Deployed as a DaemonSet on GPU-enabled nodes, it exposes detailed GPU metrics including utilization, memory usage, temperature, and power consumption.
Component 2: Kube-State-Metrics for Kubernetes Context
While DCGM provides GPU hardware metrics, kube-state-metrics adds the Kubernetes context necessary for cost attribution. It exposes metrics about pod resource requests, limits, labels, and annotations that enable mapping GPU usage back to specific applications, teams, or cost centers.
Component 3: OpenTelemetry Collector for Data Pipeline
The OpenTelemetry Collector acts as the data pipeline, collecting metrics from both DCGM Exporter and kube-state-metrics, enriching them with additional metadata, and forwarding them to Amazon Managed Service for Prometheus. This approach provides several advantages:
- Centralized metric collection and processing
- Consistent data format across multiple clusters
- Ability to add custom labels for cost attribution
- Reduced complexity in metric routing and filtering
Component 4: Amazon Managed Services for Prometheus
Amazon Managed Service for Prometheus (AMP) provides a scalable, highly available metrics storage solution that can handle metrics from multiple EKS clusters without the operational overhead of managing Prometheus infrastructure. Amazon Managed Grafana (AMG) offers enterprise-grade visualization capabilities with built-in security and user management.
Implementing Cost Attribution Logic
The power of this observability approach lies in correlating GPU hardware metrics with Kubernetes metadata to create meaningful cost attribution. By combining DCGM utilization data with pod resource requests and custom labels, teams can calculate cost allocation using several methodologies:
- Request-based allocation: Distribute costs based on GPU resource requests
- Utilization-based allocation: Allocate costs proportional to actual GPU usage
- Hybrid approach: Combine request and utilization data for more accurate attribution
Key Dashboards and Visualizations
Configure AMP as a data source in Grafana using the workspace endpoint and SigV4 authentication, then create panels for:
- GPU Slice Allocation by Business Unit – Shows requested capacity distribution
- Hourly Cost Allocation – Displays allocated costs per team
- Actual GPU Utilization – Real-time utilization metrics
- Effective vs. Allocated Cost Comparison – Side-by-side cost analysis
- Waste Identification – Highlights optimization opportunities
The Grafana dashboard will look like below. This dashboard shows the BU-A, B and C’s requested GPU slices vs allocated as well as Effective usage and wastage in terms of cost attribution. Finally, the Utilization fraction provides an overall view of cost attribution amongst all the business units. Now you have precise visibility into both requested and actual GPU costs, enabling accurate chargeback and budget planning.
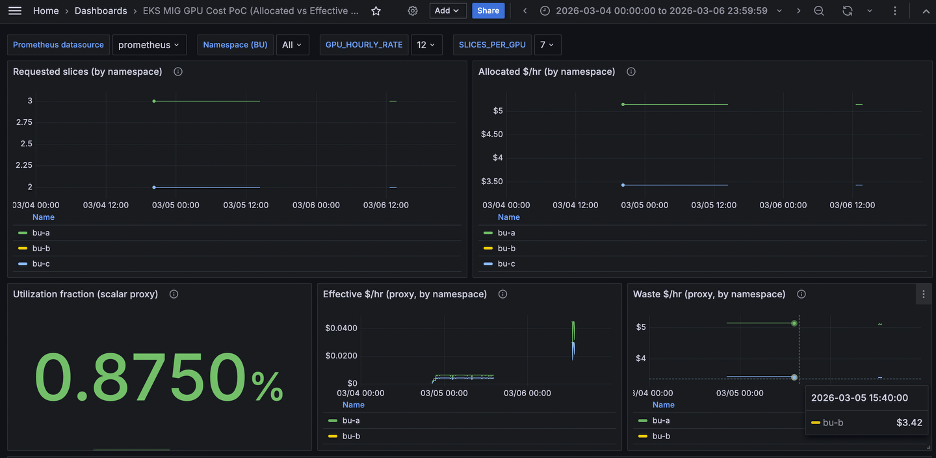
Figure 2: Grafana dashboard showing the cost attribution
Conclusion
By leveraging existing observability tools like OpenTelemetry, DCGM Exporter, and kube-state-metrics with “Amazon Managed Service for Prometheus and Grafana, organizations can attribute GPU costs at the team and project level, identify waste, and make informed capacity decisions. This observability-first approach not only solves the immediate challenge of GPU cost attribution but also establishes a foundation for broader infrastructure cost management and optimization initiatives. As AI and ML workloads continue to grow, having detailed visibility into GPU utilization and costs becomes essential for sustainable scaling. As the next steps, to implement this solution in your environment:
1. Follow the step-by-step deployment guide to provision the EKS cluster, DCGM Exporter, and OpenTelemetry Collector.
2. Review your current GPU allocation by comparing requested slices against actual utilization using the Grafana dashboard templates provided.
3. Establish chargeback policies by defining whether your organization will use request-based, utilization-based, or hybrid cost allocation.
4. Iterate on partitioning strategy — adjust MIG slice sizes based on the waste metrics surfaced by the dashboard.