AWS Cloud Operations Blog
Root Cause Analysis with Amazon Managed Service for Prometheus and AWS DevOps Agent
Introduction
Teams running Prometheus-instrumented workloads, whether on Kubernetes, Amazon EC2, containers, or on-premises servers, face a growing challenge: alert fatigue from static threshold monitoring and hours spent manually investigating performance degradations. These teams can significantly reduce time spent investigating false positive alerts and manually correlating metrics by implementing automated root cause analysis. When real issues occur, the delay between detection and diagnosis means customers experience degraded service while engineers scramble through dashboards and logs.
What if the investigation could start automatically the moment an anomaly is detected, before a human even sees the alert?
AWS DevOps Agent provides an opportunity to shift from reactive firefighting to proactive, autonomous investigation. As an always-on frontier agent, it investigates incidents the moment they occur, identifies root causes by correlating telemetry across AWS, multicloud, and on-premises environments, and recommends specific mitigation plans, all without human intervention.
This blog post demonstrates how to build a proactive Root Cause Analysis (RCA) pipeline that combines Amazon Managed Service for Prometheus machine learning-based anomaly detection with AWS DevOps Agent. Instead of static thresholds, Random Cut Forest (RCF) learns your application’s normal behavior and detects anomalies automatically. Instead of paging an engineer, the AWS DevOps Agent investigates the root cause autonomously using Prometheus MCP tools. By the end, you will have a deployed pipeline that, in our test scenario, detected a 5G network degradation, fired an alert within 25 seconds, and delivered an AI-generated investigation report in under 60 seconds, all without human intervention.
Architecture
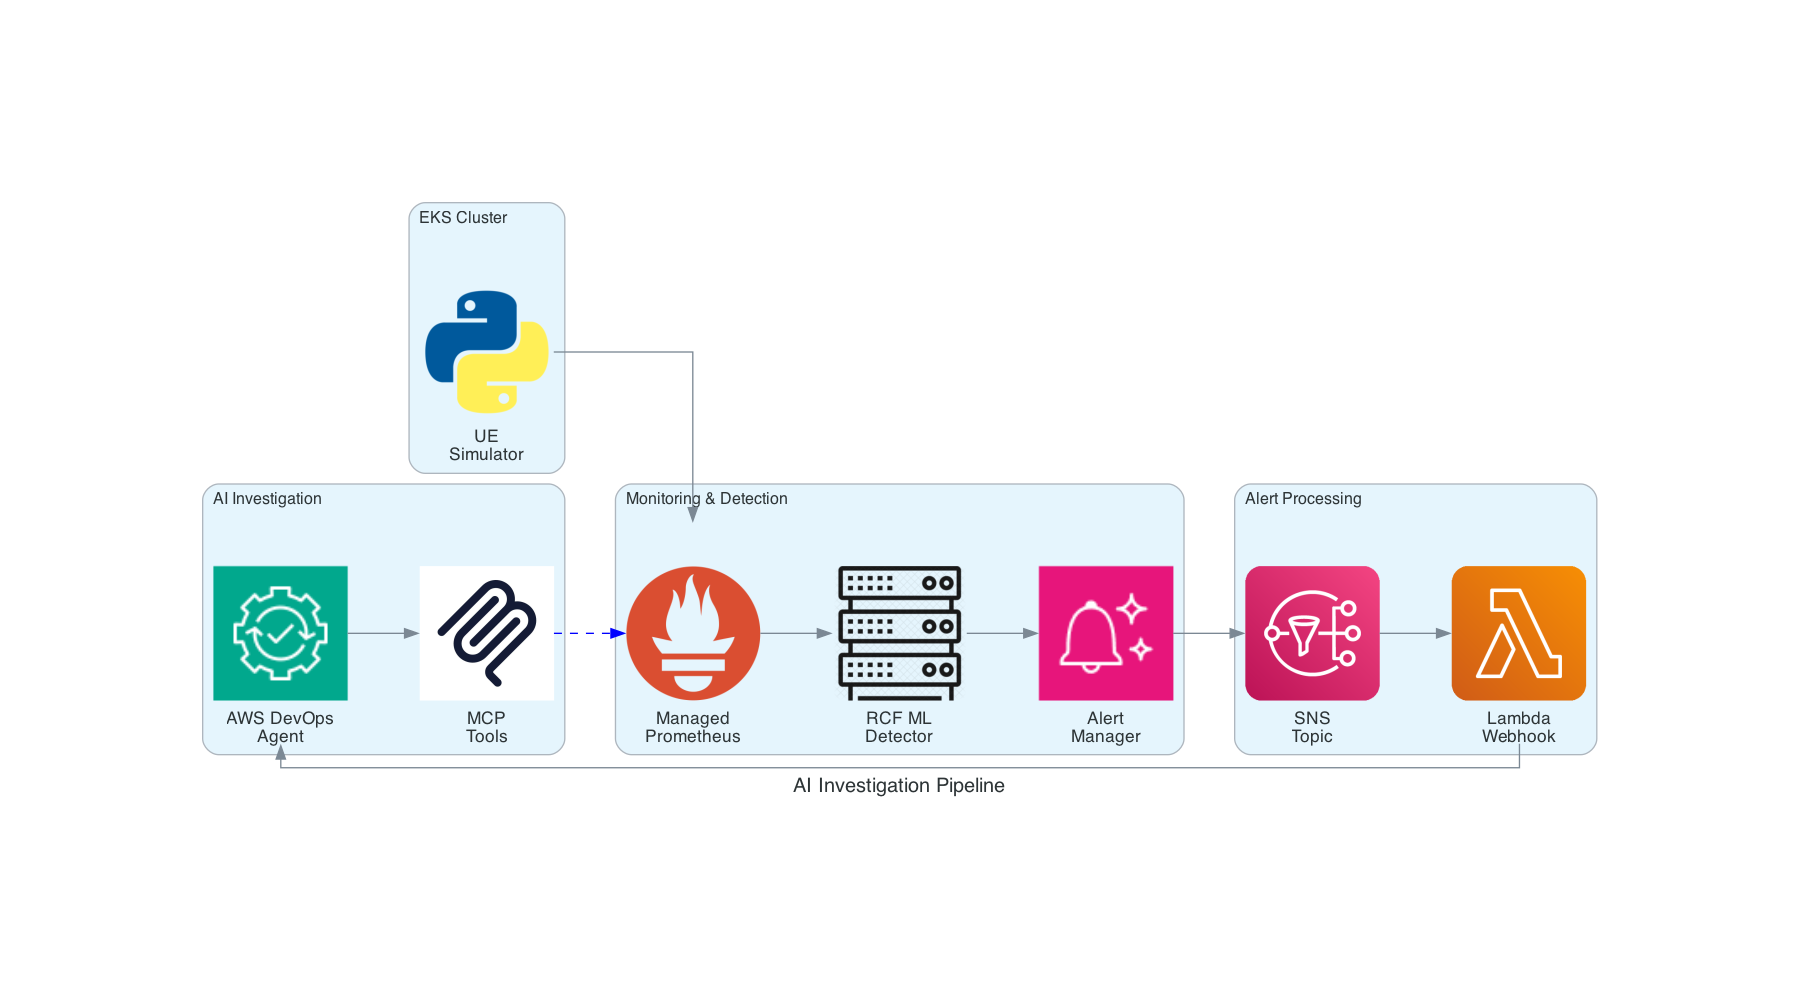
Figure 1: End-to-end proactive RCA investigation pipeline architecture.
The architecture spans a single AWS account with the following components:
Amazon Elastic Kubernetes Service (Amazon EKS) hosts the application workload (in our case, a 5G UE simulator) that exposes Prometheus metrics endpoints. The Amazon Managed Service for Prometheus scraper collects metrics every 5 seconds directly from the pods, using the fully managed scraper with no self-managed Prometheus server required.
Amazon Managed Service for Prometheus provides the managed monitoring and alerting. RCF anomaly detectors learn normal metric baselines and produce anomaly scores. Alert Manager evaluates these scores and routes alerts to Amazon Simple Notification Service (Amazon SNS).
AWS Lambda acts as the webhook forwarder. It receives SNS notifications, formats them as incident payloads with HMAC signing, and forwards them to the AWS DevOps Agent webhook.
Amazon API Gateway exposes the Prometheus MCP server endpoint, secured by Amazon Cognito for OAuth authentication.
AWS DevOps Agent receives the incident, triggers an autonomous investigation, and uses Prometheus MCP tools to query metrics directly from the Managed Service for Prometheus workspace. It follows a structured runbook to correlate signals and produce a root cause analysis.
Data flow: Application metrics → Managed Service for Prometheus scraper (5s) → RCF Anomaly Detector (30s evaluation) → Alert Manager → SNS → Lambda → AWS DevOps Agent Webhook → Autonomous Investigation via Prometheus MCP → Root Cause Report.
This post walks through a simplified, scenario-agnostic version of the pipeline so you can focus on the pattern. For a ready-to-deploy demonstration, the complete end-to-end solution, including a full open5gs 5G core variant, numbered deployment scripts, and a demo notebook, is available in the AWS Solutions Library guidance repository. Use that repository to stand up the entire pipeline for a live, deployable demonstration; use this post to understand each moving part.
Implementation
Prerequisites
Before you begin, ensure you have:
- An Amazon EKS cluster with Prometheus-instrumented applications and an Amazon Managed Service for Prometheus scraper configured to collect metrics (see Configure a scraper in the Amazon Managed Service for Prometheus documentation)
- AWS CLI and kubectl configured
- AWS Identity and Access Management (AWS IAM) permissions for Amazon Managed Service for Prometheus, AWS Lambda, Amazon Simple Notification Service (Amazon SNS), Amazon API Gateway, Amazon Cognito
- Python 3.9+ with boto3, Node.js 22+ for CDK
- Note: This tutorial assumes you have an existing EKS cluster with a Prometheus-instrumented application exposing metrics. For EKS setup, see Getting started with Amazon EKS in the AWS documentation.
- Estimated time: 60 minutes
- Estimated cost: ~$55/month for 1,000 metrics (Amazon Managed Service for Prometheus and supporting infrastructure), excluding the Amazon EKS cluster you already run. AWS DevOps Agent is billed separately based on usage; see the AWS DevOps Agent and Amazon Managed Service for Prometheus pricing pages for current rates.
Account setup
The implementation uses a single AWS account with the following resources:
- EKS cluster running the application workload with Prometheus metric endpoints
- Managed Service for Prometheus workspace with RCF anomaly detectors and Alert Manager configuration
- Lambda function for webhook forwarding with HMAC authentication
- SNS topic connecting Alert Manager to Lambda
- Amazon API Gateway + AWS Lambda + Amazon Cognito hosting the Prometheus MCP server (deployed via CDK)
- AWS DevOps Agent Space with the Prometheus MCP registered and investigation webhook configured
Creating your proactive RCA agent
Building the proactive RCA pipeline requires configuring three core components: an AWS DevOps Agent Space for tool access, webhooks for incident triggers, and Prometheus MCP integration for metric queries.
AWS DevOps Agent Spaces
AWS DevOps Agent Space defines the tools and infrastructure that AWS DevOps Agent has access to.
In the AWS DevOps Agent console, choose Create Agent Space, name it Proactive-RCA-5G-Monitoring, and for both AWS resource access and the Web App select Auto-create a new AWS DevOps Agent role. For the full walkthrough and additional options, see Creating an Agent Space.
Once created, add your AWS account as a source (Sources → Add source → AWS Account). The agent builds a topology of all resources in the account, including your EKS cluster, Lambda functions, and networking components.
Agent Space webhooks
Create a webhook for your Agent Space to receive automated incident triggers: in the Operator Web App, choose Webhooks → Create webhook, give it a name such as prometheus-rcf-webhook, and copy the webhook URL and secret key (store the secret immediately, as you cannot view it again).
A small Lambda function forwards each RCF alert from SNS to this webhook, signing the request so the agent can verify it. The complete function, IAM execution role, and incident payload structure are in the guidance repository (lambda-agent-forwarder/handler.py). The core is the HMAC signing of the outbound payload:
const timestamp = new Date().toISOString();
const hmac = createHmac("sha256", secret);
hmac.update(`${timestamp}:${JSON.stringify(payload)}`, "utf8");
const signature = hmac.digest("base64");
// POST to the webhook URL with x-amzn-event-timestamp and x-amzn-event-signature headers
The function reads the webhook URL and secret from AWS Secrets Manager at runtime, so rotating the secret needs no redeploy. Store them once, then never commit the secret to version control:
aws secretsmanager create-secret --name webhook-config \
  --secret-string '{"webhook_url":"YOUR_WEBHOOK_URL","webhook_secret":"YOUR_WEBHOOK_SECRET"}'
For the IAM execution role, packaging, and deployment commands, follow the guidance repository README.
Connecting Prometheus MCP to AWS DevOps Agent
This is where the pipeline becomes truly autonomous. By registering a Prometheus MCP server with the AWS DevOps Agent, the agent gains direct access to query your Managed Service for Prometheus workspace, executing PromQL, listing metrics, and correlating signals as a human SRE would.
The Prometheus MCP server runs as a Lambda function behind API Gateway, with OAuth authentication via Amazon Cognito. Rather than configuring each component manually, deploy the entire stack using the CDK construct that deploys the Prometheus MCP integration with AWS DevOps Agent, available in the aws-samples GitHub repository: AWS Samples
cdk bootstrap aws://ACCOUNT-ID/REGION
git clone https://github.com/aws-samples/sample-AIDevops-Prometheus-MCP.git
cd sample-AIDevops-Prometheus-MCP
npm install
cdk deploy --all
The CDK deploys three stacks:
- Amazon Cognito Stack: User pool for OAuth M2M token exchange
- Amazon API Gateway Stack: REST API with Lambda JWT authorizer
- Prometheus MCP Lambda: Implements MCP tools, translating tool calls into SigV4-signed Managed Service for Prometheus API requests
After deployment, the CDK outputs a JSON file with all parameters needed to register the MCP server:
{
 "endpoint_url": "https://xxxxxxxx.execute-api.REGION.amazonaws.com/prod/mcp",
 "client_id": "xxxxxxxxxxxxxxxxxxxxxxxxxx",
 "client_secret": "xxxxxxxxxxxxxxxxxxxxxxxxxx",
 "token_exchange_url": "https://xxxxxxxx.auth.REGION.amazoncognito.com/oauth2/token"
}
Register the MCP server in your Agent Space:
1. Open the AWS DevOps Agent console.
2. Choose “Capabilities” from the left navigation.
3. Choose “Add MCP server”.
4. Enter the following details from your CDK output:
- Transport: Streamable HTTP
- Endpoint URL: From CDK output
- Authentication: OAuth
- Client ID, Client Secret, Token Exchange URL: From CDK output
The agent automatically discovers five Prometheus MCP tools (note: tool names are defined by the MCP server implementation):
| Tool | Purpose |
|---|---|
| GetAvailableWorkspaces | Find and connect to Managed Service for Prometheus workspaces |
| ExecuteQuery | Run instant PromQL queries |
| ExecuteRangeQuery | Query metric history over time windows |
| ListMetrics | Discover available metrics |
| GetServerInfo | Return MCP server status and configuration details |
When you register the MCP server, the console offers to create a webhook. This webhook URL and secret are what the Lambda forwarder uses to trigger investigations.
Connecting Alert Manager to SNS
First, create the SNS topic:
1. Run: aws sns create-topic --name prometheus-rcf-alerts
2. Copy the TopicArn from the output for use in subsequent steps.
Configure the Alert Manager in Managed Service for Prometheus to route RCF anomaly alerts to your SNS topic:
route:
 receiver: sns-forwarder
 group_wait: 1s
 group_interval: 30s
 repeat_interval: 5m

receivers:
 - name: sns-forwarder
 sns_configs:
 - topic_arn: arn:aws:sns:<region>:<account>:prometheus-rcf-alerts
 send_resolved: true
Why 1s group_wait: The default 10s adds unnecessary latency. Since RCF alerts are discrete onset events (not flapping), there is no benefit to grouping delay.
Save this as alertmanager.yml, then apply it and wire SNS to the forwarder Lambda:
aws amp create-alert-manager-definition --workspace-id ws-xxxxxxxx --data file://alertmanager.yml
aws sns subscribe --topic-arn arn:aws:sns:REGION:ACCOUNT:prometheus-rcf-alerts --protocol lambda --notification-endpoint arn:aws:lambda:REGION:ACCOUNT:function:webhook-forwarder
aws lambda add-permission --function-name webhook-forwarder --statement-id sns-invoke --action lambda:InvokeFunction --principal sns.amazonaws.com --source-arn arn:aws:sns:REGION:ACCOUNT:prometheus-rcf-alerts
The Lambda receives the alert, formats it as an AWS DevOps Agent incident payload, and forwards it to the webhook.
AWS DevOps Agent Skills
Use AWS DevOps Agent Skills to encode your investigation runbook as a reusable instruction set. Skills guide the agent to follow structured diagnostic steps for every RCF-triggered investigation. See AWS DevOps Agent Skills.
In the Operator Web App, go to Skills → Add skill → Create skill, name it prometheus-rcf-investigation, clear the Generic checkbox and select Incident RCA (so the skill activates only for root cause investigations and reduces context consumption), and paste the runbook below into the Instructions field.
---
name: prometheus-rcf-investigation
description: Investigate RCF anomaly detections using Prometheus MCP tools
---

# RCF Anomaly Investigation Runbook

When an RCF anomaly is detected, follow these steps:
1. Connect to workspace: Use GetAvailableWorkspaces to find the Managed Service for Prometheus workspace
2. Query affected metric: Use ExecuteQuery to get the current value of the alerting metric
3. Check correlated metrics: Query related metrics (signal strength, SINR, CQI, error rates)
4. Compare against baselines: Use ExecuteRangeQuery to compare current values against the last 24 hours
5. Identify root cause: Correlate degraded metrics to determine the underlying issue
6. Assess severity: Rate as Critical/High/Medium/Low based on degradation percentage
7. Recommend actions: Provide specific remediation steps based on the identified root cause
Configuring RCF anomaly detection
If you do not already have a Managed Service for Prometheus workspace, create one in the Amazon Managed Service for Prometheus console and note its workspace ID (format ws-xxxxxxxx).
The Amazon Managed Service for Prometheus native RCF anomaly detection is powerful, but its behavior in production requires specific configuration choices. Here are the production-proven settings with reasoning.
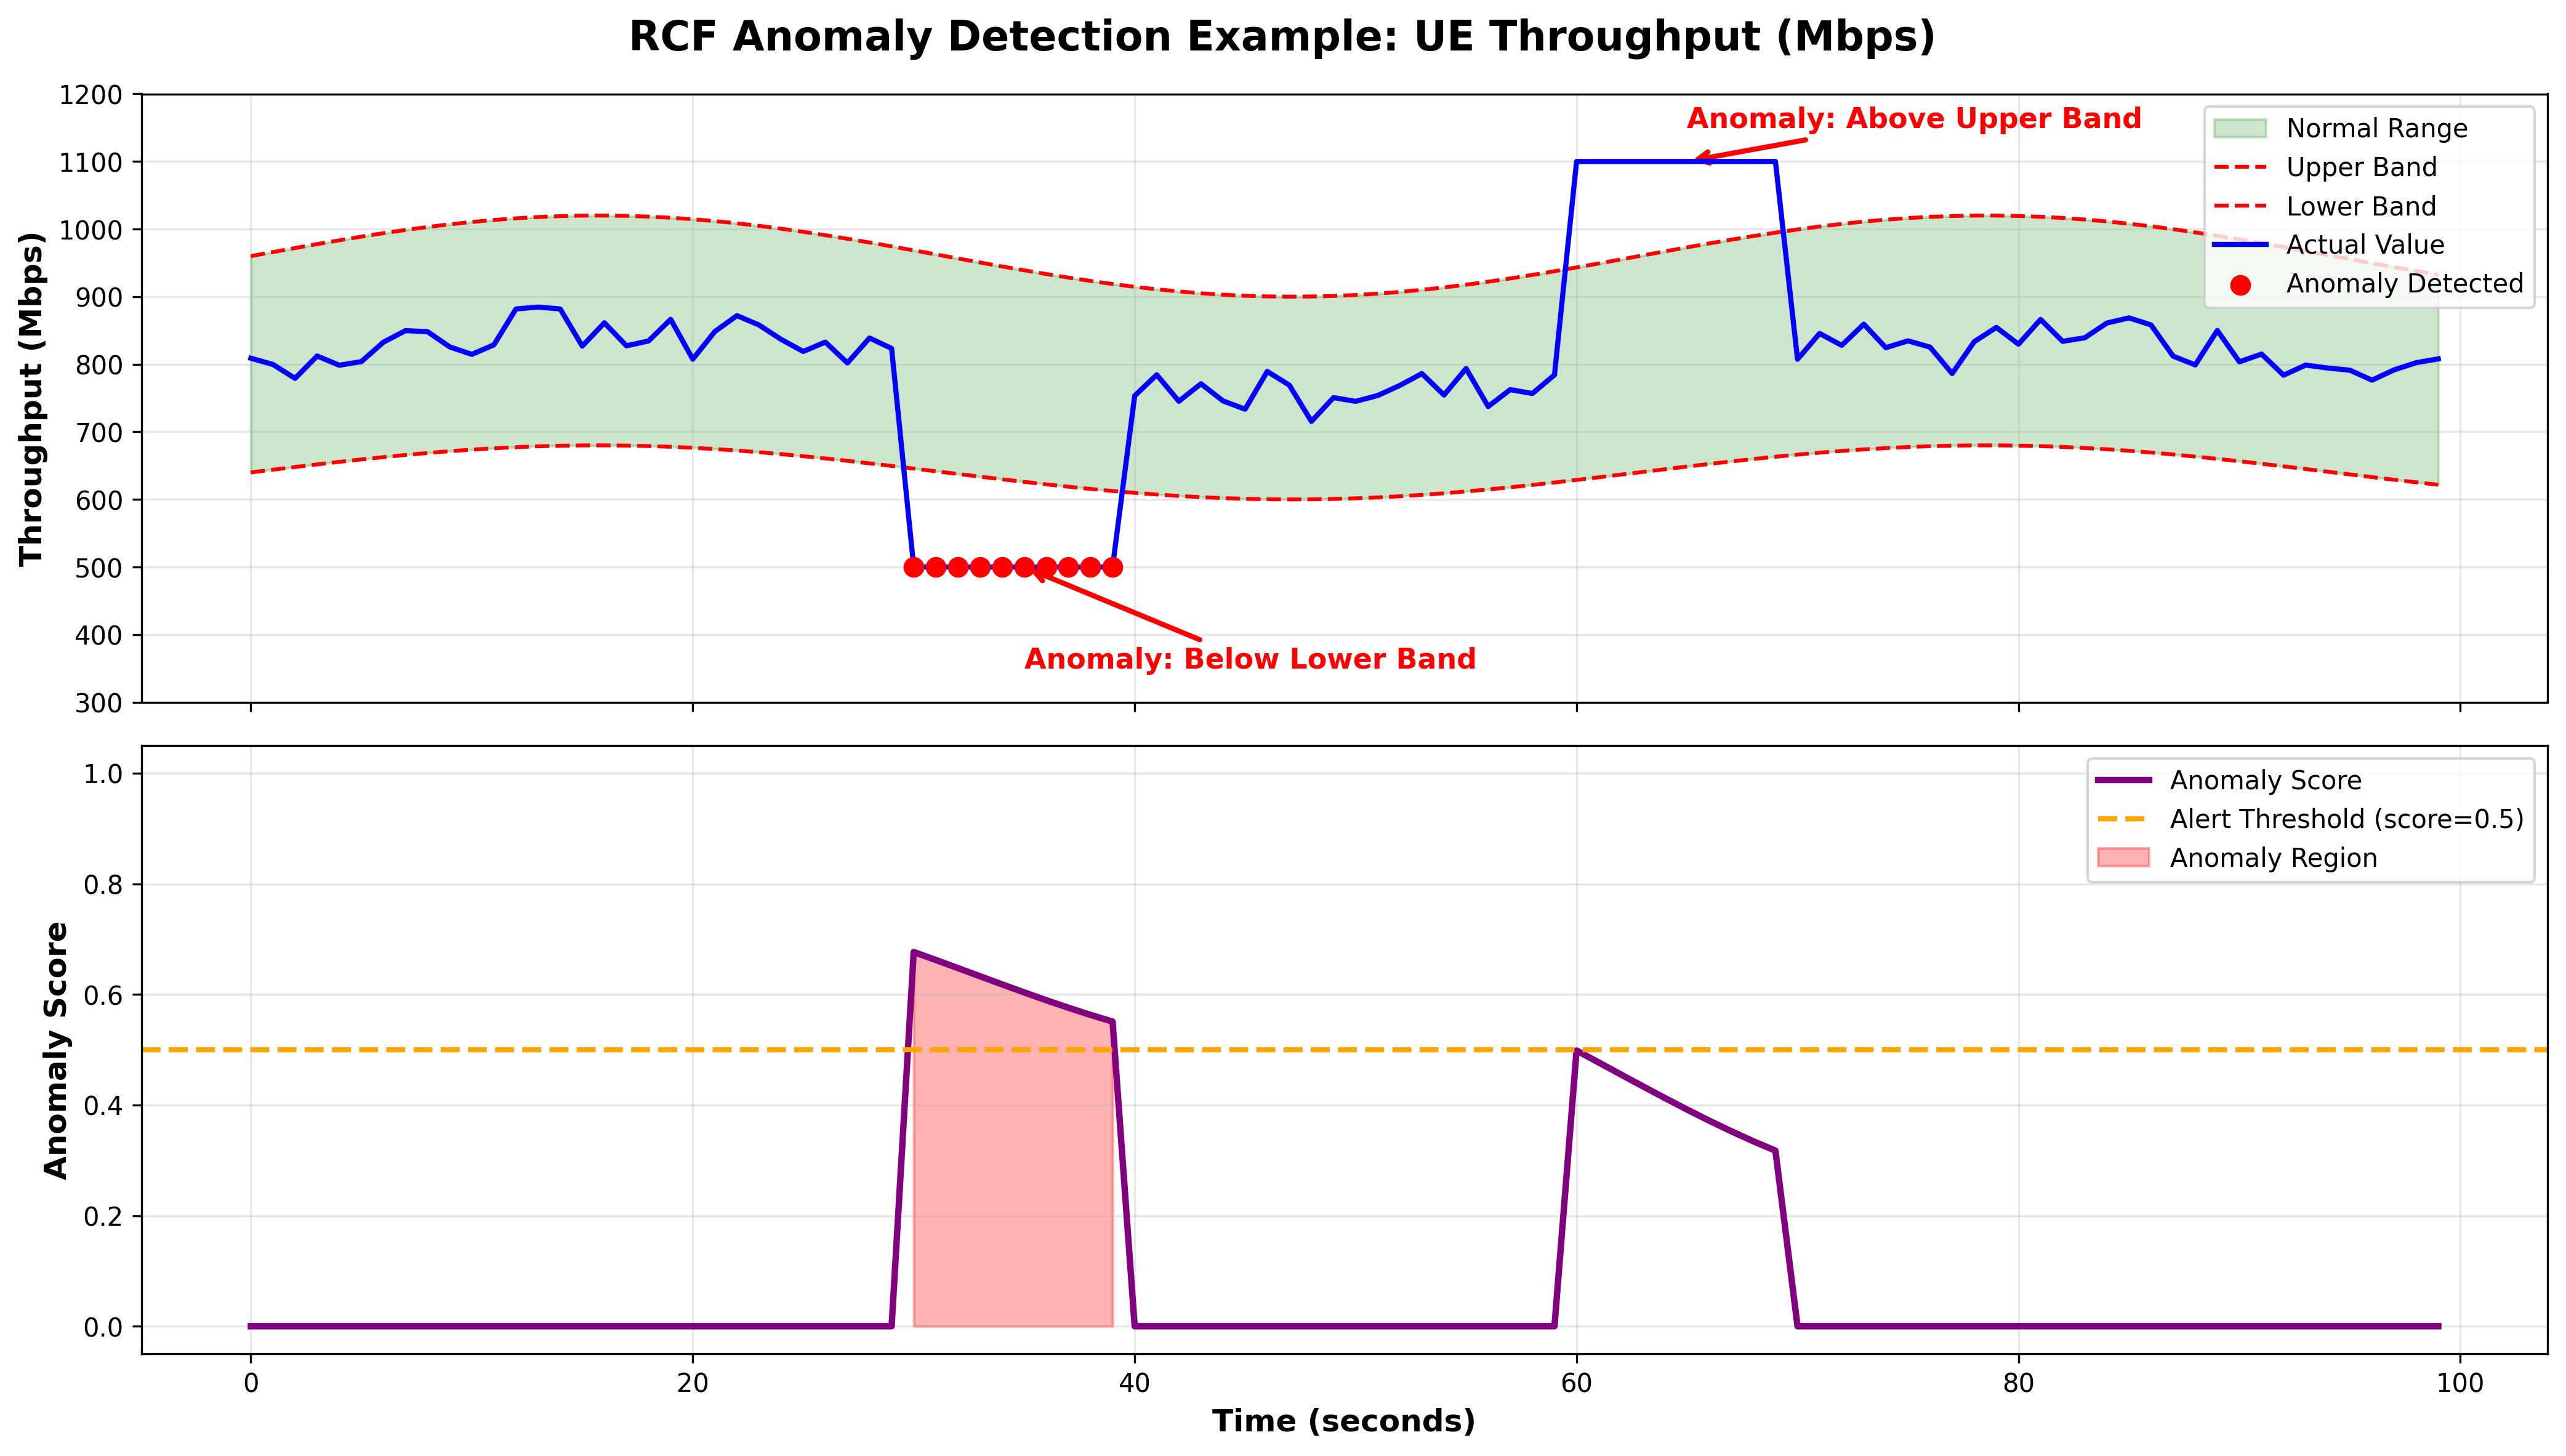
Figure 2: How RCF anomaly detection works. The detector learns a normal range (upper and lower bands) around the metric; when the actual value moves outside that band, the anomaly score rises above the alert threshold and an alert fires. The threshold in this illustration is shown at 0.5 for clarity; the walkthrough below uses 0.1 for higher sensitivity.
RCF Detector configuration
Create the detector with boto3 (replace ws-xxxxxxxx with your workspace ID):
import boto3

client = boto3.client("amp")

response = client.create_anomaly_detector(
    workspaceId="ws-xxxxxxxx",
    alias="ue-downlink-detector",
    configuration={
        "randomCutForest": {
            "query": "avg(ue_downlink_throughput_mbps)",
            "shingleSize": 8,
            "sampleSize": 256,
        }
    },
    evaluationIntervalInSeconds=30,
    missingDataAction={"skip": True},
)
Why avg() in the query: Raw metrics from multiple pods create noise. Aggregating gives RCF a cleaner signal.
Why 30s evaluation interval: Faster than the 60s default. Detects anomalies within one evaluation cycle. The tradeoff is a shorter training window (256 × 30s = 2.1 hours), which you offset by letting detectors mature over days.
Why default sampleSize and shingleSize: After extensive testing, the AWS-optimized defaults work well for most time series. A mature detector with default parameters outperforms a new detector with “perfect” parameters.
Alert Rule configuration
Define the alert rule (save as rcf-alerts.yml):
groups:
  - name: rcf-alerts
    interval: 5s
    rules:
      - alert: RCFSpikeDetected
        expr: max_over_time(anomaly_detector:score{alias="ue-downlink-detector"}[2m]) > 0.1
        for: 0s
        labels:
          severity: warning
          alert_type: spike
        annotations:
          summary: "Anomaly spike detected by RCF"
          description: "RCF detected anomaly onset with score {{ $value }}"
          anomaly_score: "{{ $value }}"
Why threshold 0.1 instead of 0.7: In testing, an 85% throughput drop (832 → 122 Mbps) produced a score of only 0.3125. A 0.7 threshold would miss it entirely. Start at 0.1 for high sensitivity, then raise if you get false positives. RCF scores are not fixed for a given metric; they scale with the magnitude and abruptness of the change and the detector’s training state, so a steeper or more abrupt drop (like the scenario later in this post) can score closer to 1.0.
Why for: 0s: This is a critical configuration choice. RCF is designed for onset detection, scores spike and then decay within 60–90 seconds as the algorithm adapts to the new value. Any evaluation window (for: 2m) risks missing the spike entirely. Zero-duration alerts are the correct approach for RCF.
The deployed detector and alert rules (along with the Alert Manager configuration above) are defined in the guidance repository’s CDK stack, amp-stack.ts.
Key insight: RCF detects onsets, not sustained anomalies
When a metric drops from 1,036 Mbps to 56 Mbps, RCF scores it as anomalous immediately. But within 60–90 seconds, the algorithm adapts to the new value as “normal,” and the score drops back to zero. This is by design, RCF handles “breaks in periodicity and irregular short-term pattern changes.”
Strategy: Treat RCF alerts as event triggers, not state indicators. Fire once, investigate immediately, don’t expect the alert to persist.
Investigate root cause
Now that you have everything connected, the pipeline operates autonomously.
1. Trigger a test degradation on your application (or use the UE simulator degradation endpoint).
2. Check the Managed Service for Prometheus console for the anomaly score spike (appears within 30 seconds).
3. Check Lambda logs: aws logs tail /aws/lambda/webhook-forwarder --follow. Look for a 200 response from the webhook.
4. In the AWS DevOps Agent console, verify an investigation task was created with status IN_PROGRESS or COMPLETED.
5. Review the investigation report to confirm it identified the root cause. Here is what happens when an anomaly occurs.
Real-world scenario: 5G network degradation
To validate the pipeline, we built a 5G User Equipment (UE) simulator running on Amazon EKS. The simulator exposes Prometheus metrics modeling real 5G network behavior and includes endpoints to trigger realistic degradation scenarios.
Normal operating state:
| Metric | Normal Range |
|---|---|
| Downlink throughput | 800–1,200 Mbps |
| Signal strength | -65 to -75 dBm |
| SINR | 15–25 dB |
| CQI | 11–15 |
Poor RF conditions triggered:
| Metric | Degraded Value | Change |
|---|---|---|
| Downlink throughput | 50–150 Mbps | -85% |
| Signal strength | -95 dBm | -25 dB |
| SINR | 3 dB | -80% |
| CQI | 4 | -70% |
Detection timeline
T+0s: Issue triggered, throughput drops from 1,036 to 56 Mbps
T+5s: Managed scraper picks up degraded metrics
T+25s: RCF score spikes to 1.0, anomaly detected
T+25s: Alert rule fires immediately (for: 0s)
T+26s: Alert Manager routes to SNS (1s group_wait)
T+27s: Lambda receives SNS, forwards to AWS DevOps Agent webhook
T+27s: Webhook returns 200, investigation started
T+30-60s: Agent queries metrics via Prometheus MCP, follows runbook
T+60s: Root cause analysis report delivered
T+90s: RCF adapts, score drops to 0, alert auto-resolves
Total time from degradation to investigation start: 27 seconds. Total time from degradation to completed RCA report: under 60 seconds.
What the agent found
Following the runbook skill, the AWS DevOps Agent:
- Connected to the Managed Service for Prometheus workspace and confirmed metric availability
- Queried ue_downlink_throughput_mbps — found 56 Mbps (expected: 800–1,200)
- Queried ue_signal_strength_dbm — found -95 dBm (expected: -65 to -75)
- Queried ue_sinr_db — found 3 dB (expected: 15–25)
- Correlated the cascade: an RSRP (signal strength) collapse of ~25 dB drives SINR down ~17 dB, forces CQI to 4, and caps downlink throughput at ~56 Mbps
- Produced a report identifying the root cause as an RSRP-led RF coverage (link-budget) degradation, and explicitly ruled out interference as the dominant driver because the SINR drop was smaller than the RSRP drop
- Recommended actions:
- Check antenna alignment and cell coverage
- Add source-level RSRP/SINR alerting to catch the leading signal
- Consider cell splitting to improve coverage

Figure 3: The AWS DevOps Agent autonomous investigation report in the Operator Web App. The agent identified the root cause as an RSRP (signal strength) collapse of ~25 dB cascading through SINR and CQI to cap downlink throughput, and classified it as a coverage/link-budget degradation, not interference.
This is the same conclusion a network engineer would reach, but delivered automatically within a minute of the issue occurring.
Generating mitigation plan
After the agent publishes a root cause, select “Generate mitigation plan” in the Operator Web App to create a structured remediation plan. The plan follows four phases:
- Prepare: Identify affected resources and gather baseline data
- Pre-Validate: Confirm current state matches the diagnosed issue
- Apply: Run remediation steps (e.g., adjust RCF thresholds, update alert routing, scale resources)
- Post-Validate: Verify the fix resolved the issue
For automated workflows, use the AWS CLI:
# Trigger investigation programmatically
aws devops-agent create-backlog-task \
 --agent-space-id "as-xxxxxxxx" \
 --title "RCF Anomaly: Throughput Degradation" \
 --description "Investigate anomaly score 1.0 on ue_downlink_throughput_mbps"

# Approve mitigation plan
aws devops-agent update-backlog-task \
 --agent-space-id "as-xxxxxxxx" \
 --task-id "task-xxxxxxxx" \
 --status "APPROVED"
The mitigation plan also generates agent-ready specs compatible with coding agents for implementation, closing the loop from incident diagnosis to code remediation.
Clean up
To avoid ongoing charges, delete the resources created in this walkthrough when you are done.
In the Operator Web App, delete the Skill (prometheus-rcf-investigation) and the webhook, then delete the Agent Space from the console and remove the auto-created AWS DevOps Agent IAM roles (search IAM for “DevOpsAgent”).
Then remove the pipeline resources:
# MCP stack (API Gateway, Lambda, Cognito)
cdk destroy --all

# Forwarder Lambda + SNS
aws lambda delete-function --function-name webhook-forwarder
aws sns unsubscribe --subscription-arn <subscription-arn>
aws sns delete-topic --topic-arn arn:aws:sns:REGION:ACCOUNT:prometheus-rcf-alerts

# IAM role
aws iam detach-role-policy --role-name lambda-webhook-role --policy-arn arn:aws:iam::aws:policy/service-role/AWSLambdaBasicExecutionRole
aws iam delete-role-policy --role-name lambda-webhook-role --policy-name SecretsAccess
aws iam delete-role --role-name lambda-webhook-role

# AMP detector, rules, alert manager + Secrets Manager secret + workspace
aws amp delete-anomaly-detector --workspace-id ws-xxxxxxxx --anomaly-detector-id DETECTOR_ID
aws amp delete-rule-groups-namespace --workspace-id ws-xxxxxxxx --name rcf-alerts
aws amp delete-alert-manager-definition --workspace-id ws-xxxxxxxx
aws secretsmanager delete-secret --secret-id webhook-config --force-delete-without-recovery
aws amp delete-workspace --workspace-id ws-xxxxxxxx
Warning: deleting the AMP workspace and the Secrets Manager secret is immediate and irreversible, and permanently removes all stored metrics and alert history. Optionally delete the Amazon EKS cluster if you created it solely for this tutorial (this terminates all running workloads and cluster data), and the CDK bootstrap stack (aws cloudformation delete-stack --stack-name CDKToolkit) if no other CDK applications use it. For the full teardown, see the guidance repository.
Conclusion
In this post, we demonstrated building a proactive RCA pipeline using Amazon Managed Service for Prometheus RCF anomaly detection and AWS DevOps Agent with Prometheus MCP tools from configuring anomaly detectors and alert rules, to deploying the MCP server via CDK, creating investigation skills, and triggering autonomous root cause analysis via webhooks.
The key insight is that RCF and AWS DevOps Agent complement each other well. RCF excels at the narrow task of detecting when something changes. AWS DevOps Agent learns your environment, automatically discovering applications, their component services, and the resources that compose them, then correlates signals across those components to determine why something changed. Connected through a fast alert pipeline, they deliver proactive operations at machine speed. In our testing, the pipeline detected a 95% throughput degradation (1,036 to 56 Mbps), fired an alert within 25 seconds, and delivered an AI-generated root cause analysis within 60 seconds, all without human intervention.
Get started today:
- AWS DevOps Agent product page: explore features and start a 2-month free trial
- Getting Started with AWS DevOps Agent: create your first Agent Space
- AWS Solutions Library Guidance: the ready-to-deploy demonstration solution for this post, a full end-to-end autonomous workflow (open5gs 5G core, RCF detector, alert pipeline, and demo notebook) you can deploy to run the pipeline live
- Prometheus MCP Server (awslabs): the upstream Prometheus MCP server this post integrates
- Sample CDK Deployment: the AWS Samples repo used in this post to deploy the Prometheus MCP integration with AWS DevOps Agent
- RCF Best Practices: parameter tuning guide
- AWS DevOps Agent Skills Documentation: build custom investigation runbooks
- Best Practices for Deploying AWS DevOps Agent in Production: production deployment patterns