- Amazon CloudWatch›
- Features›
- Analytics and Insights
Overview
Get analytics and insights your way with flexible capabilities that deliver intelligence wherever you need it. Choose zero-setup dashboards, build custom queries, or access embedded insights that surface automatically within your workflow.
Monitor AWS services out-of-the-box
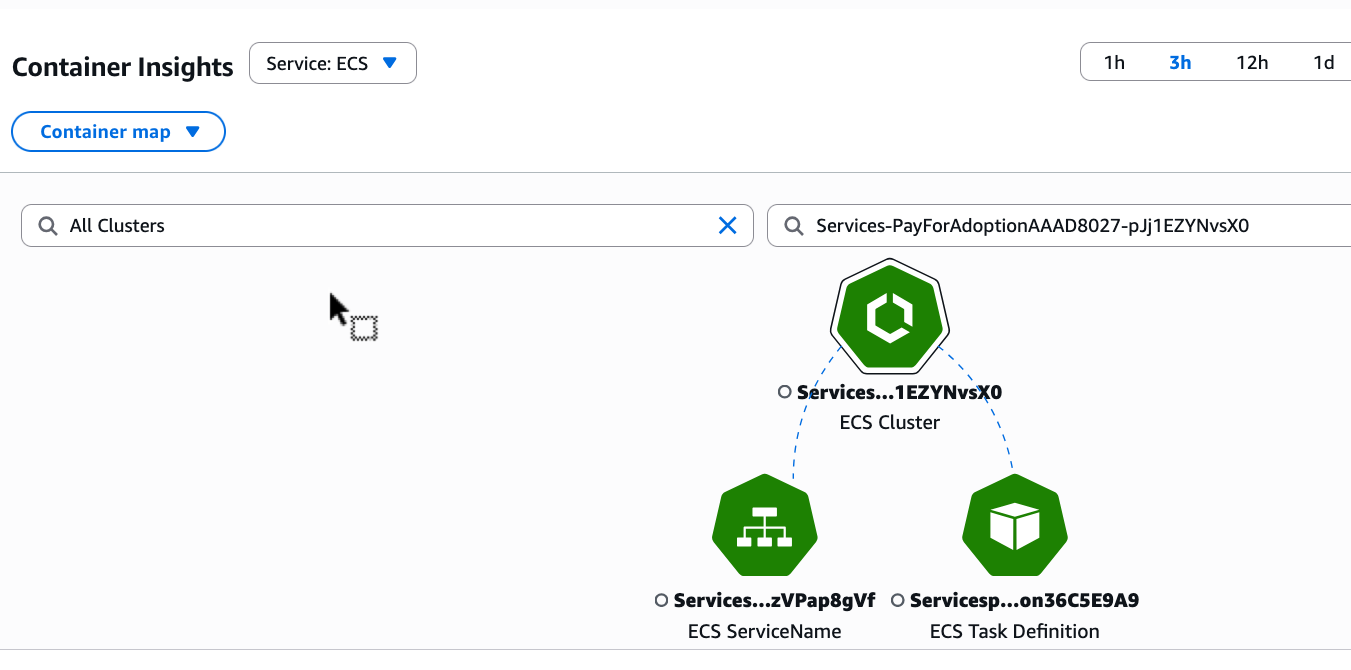
Spot performance issues quickly with Database Insights, Container Insights, and Lambda Insights that require zero configuration. These curated dashboards automatically surface critical metrics, bottlenecks, and resource patterns for RDS databases, ECS clusters, and EKS workloads without setup or instrumentation. Focus on what matters most with built-in best practices that deliver immediate visibility into cost, performance, and operational health.
Explore Database Insights documentation
Explore Container Insights documentation
Explore Lambda Insights documentation
Build tailored analytics quickly
Build your custom analytics and remediate by querying billions of log events and time-series data in seconds with CloudWatch Logs Insights and Metrics Insights. Start with ready-made queries or write custom queries using SQL and OpenSearch Piped Processing Language (PPL) through integrated Amazon OpenSearch Service support. Reduce mean time to resolution with custom analytics that maintain context without switching tools.
Catch issues early with embedded insights
Detect anomalies and act on problems faster with intelligence embedded directly in your dashboards and alerts. Spot performance contributors, hot keys, and related dependencies instantly through Contributor Insights and Explore Related capabilities that reveal connections across your infrastructure.

Featured Services and Solutions
Customers
Simplify Log Analytics with CloudWatch Logs Insights
"Our current log analytics solution requires setup and maintenance overhead, has differing retention requirements, and is cost prohibitive, making it impossible for our Engineering team to be able to access and query logs in both development and test environments. With CloudWatch Logs Insights, we are now able to query logs within CloudWatch Logs reducing operational complexity. Pay per query gives us flexibility to scale at our own pace and our engineers can begin to consume and query logs without waiting for the setup, integration, and ingestion to take place with our current solution. We also benefit from viewing metrics and logs allowing faster troubleshooting. Logs Insights is an effective and inexpensive solution for our engineers to monitor their applications and perform log diving all from single AWS console."
Peter Goodman, Director Site Reliability Engineering, Pushpay
Empower Teams with Real-Time Visibility
"The CloudWatch observability platform has improved our team's visibility into application performance, streamlining and speeding collaboration for our team. It delivers real-time insights into application performance and offers thorough end-to-end analytics, empowering teams to make more informed, data-driven decisions. As a result, we can more efficiently and proactively maintain and manage performance, allowing our teams to focus on innovation and excellence and helping shape a world where life just works better for our teams and customers."
Subrat Mishra, VP of Technology & Database Operations, Site Reliability Engineering, CCC
Gain End-to-End Visibility and Actionable Insights with CloudWatch
"Amazon CloudWatch plays a crucial role in Solaris' operations with its versatile features, particularly in logging and monitoring our metrics, logs, and traces. We gain valuable insights into our microservices architecture and applications running across all AWS accounts with CloudWatch cross-account observability. CloudWatch Logs enables us to perform efficient debugging and conduct in-depth root cause analysis, ensuring the smooth functioning of our systems, together with CloudWatch Metrics that allows us to monitor ongoing issues related to resource consumption and serve as an input for triggering alarms based on high error rates or anomalies. CloudWatch Alarms also play a pivotal role in promptly alerting us through various channels like Slack and PagerDuty, ensuring timely responses to critical situations. Moreover, CloudWatch's comprehensive capabilities empower us to proactively manage our systems, detect issues, and optimize our resources effectively."
Mohammadreza Ganji, Architect, Solaris SE
Troubleshoot with a Real-Time Unified View
"Our customers are our most important assets. Amazon CloudWatch provides developers and Site Reliability Engineers real-time observability of systems and products that reduce customer impact. We collaborated across many Lines of Business testing Amazon CloudWatch features that help monitor and troubleshoot with a real-time unified view across applications and infrastructure. This has produced game-changing observability and correlation of data on metrics, logs, and traces. Data without context is meaningless and CloudWatch is helping correlate data in a contextual way making it meaningful and impactful.
With thousands of containers in use at JPMC the additional detailed metrics now offered by Amazon CloudWatch Container Insights with enhanced observability are a welcomed arsenal for faster troubleshooting as we continue to provide reliable services to our customers."
Anthony Giles, Executive Director - Architecture & SRE Center of Excellence, JPMorgan Chase & Co