- AWS Builder Center
- builders.flash
「OpenSearch を利用した統合ログ管理」 ソリューションを使用して、アプリケーションログを取り込む
2024-10-03 | Author : 小林 航
はじめに
皆さん、こんにちは。ソリューションアーキテクトの 小林 航 です。
Amazon OpenSearch Service を利用してさまざまなソースから日々ログデータを収集し、取り込み、視覚化されている方は多いかと思いますが、Amazon OpenSearch Service を活用した「OpenSearch を利用した統合ログ管理」というソリューション実装をご存知でしょうか。
「AWS ソリューションライブラリ」には多数の AWS リファレンス実装がありますが、その中に「OpenSearch を利用した統合ログ管理」があります。このソリューションは、Amazon S3 アクセスログや Amazon VPC フローログなどのサービスログだけでなく、アプリケーションログを収集し、可視化するパイプラインを簡単に作成できるコンソール画面を備えています。また、ログ検索画面と、すぐに使えるダッシュボードテンプレートを提供しています。
今回はこのソリューションを使用して、Amazon EKS 上に構築した E コマースアプリケーションのログ分析パイプラインを構築してみます。詳細な手順はワークショップから確認できますので、皆さんも是非一度試してみてください。
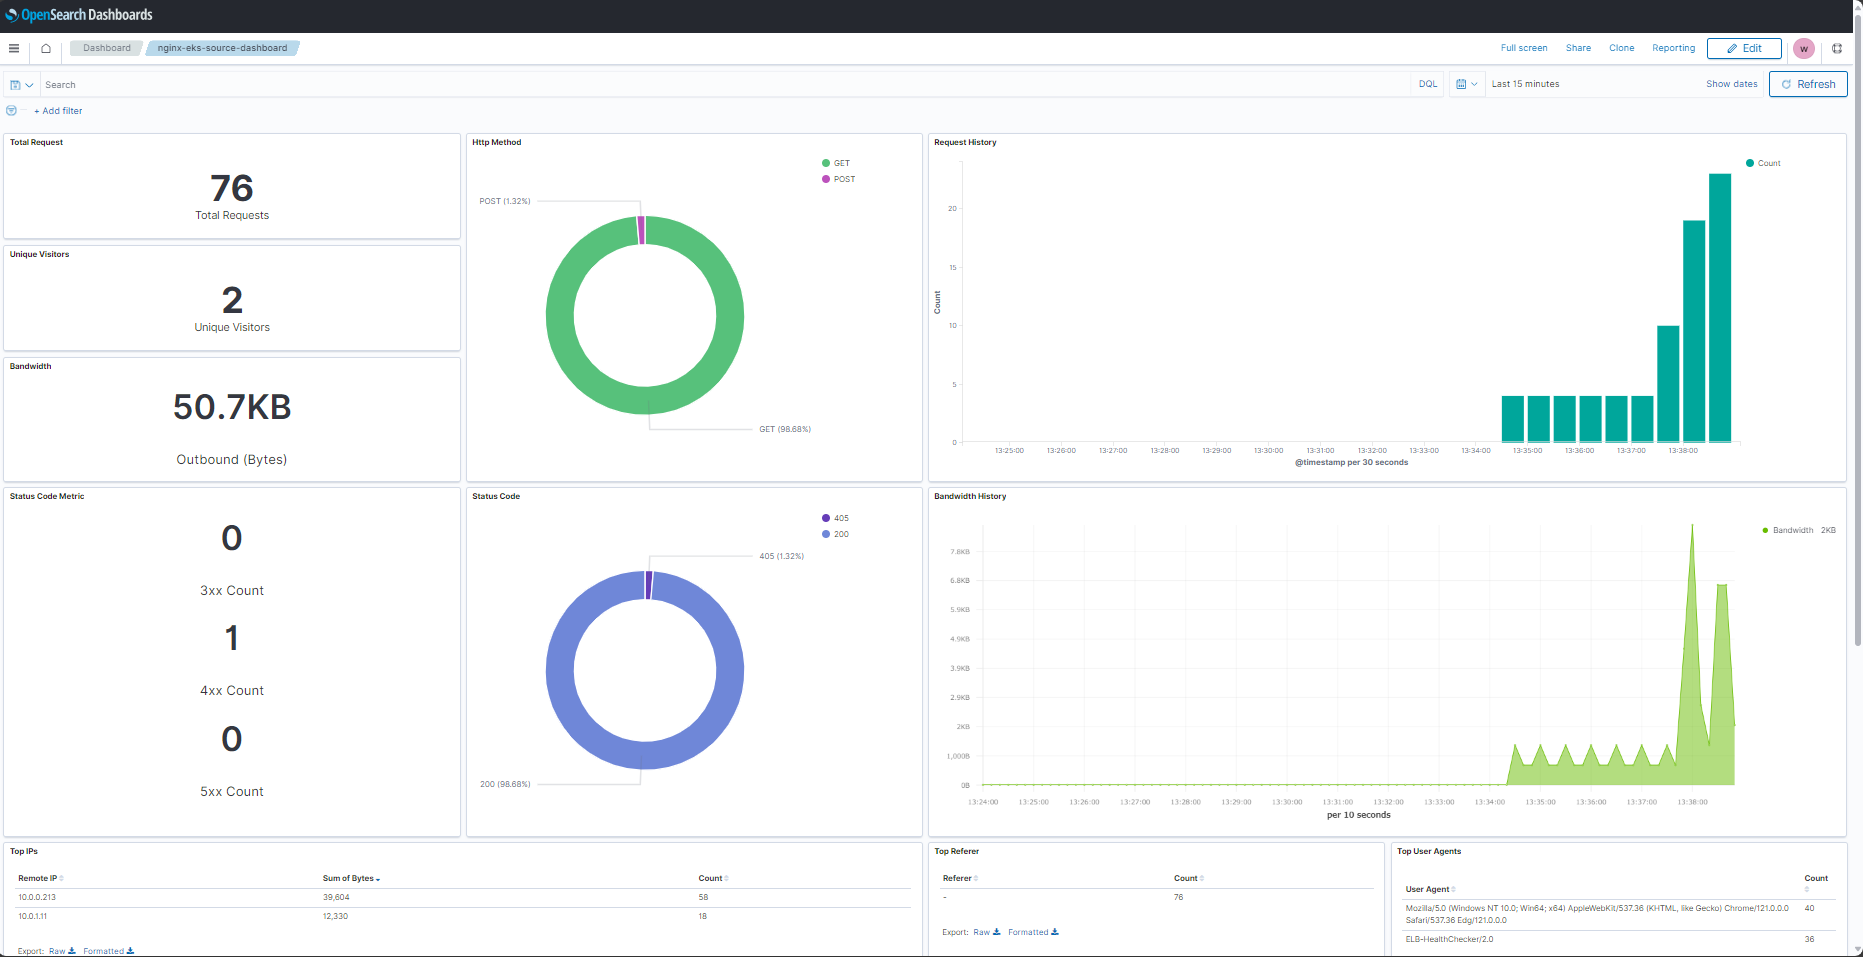
画面イメージ
ご注意
本記事で紹介する AWS サービスを起動する際には、料金がかかります。builders.flash メールメンバー特典の、クラウドレシピ向けクレジットコードプレゼントの入手をお勧めします。
builders.flash メールメンバー登録
「OpenSearch を利用した統合ログ管理」でログパイプライン構築を試してみる
事前準備
ワークショップにある 前提条件 と ドメイン管理 を実施しておきます。このワークショップの前提条件を実施することで、Spring Boot で開発された EKS アプリケーション、Amazon OpenSearch Service を含む「OpenSearch を利用した統合ログ管理」 ソリューションを AWS CloudFormation でデプロイできるようになっています。
今回構築していくログパイプラインのアーキテクチャは以下のようになります。
ここから、「OpenSearch を利用した統合ログ管理ソリューション」のコンソール画面を通じて、以下の設定を実施していきます。
-
Spring Boot アプリケーションログのパース定義
-
Log Buffer レイヤーの作成
-
Amazon OpenSearch Service のインデックス設定
-
Log Processor の設定
-
Fluent Bit の EKS クラスタへのデプロイ

それでは、ログパイプライン構築を始めていきましょう!
次のステップに進む前に、「OpenSearch を利用した統合ログ管理」 ソリューションのコンソール画面にログインできることをもう一度確認してください。こちら でアクセス URL を確認できます。

Step1. Amazon EKS クラスターのインポート
「OpenSearch を利用した統合ログ管理」 ソリューションコンソール画面の「EKS Clusters」メニューから、EKS クラスターのインポート処理を実行します。

既に作成済みの EKS クラスターをドロップダウンリストから選択します。

Step2. ログパースの定義
「OpenSearch を利用した統合ログ管理」 ソリューションでは、ログパースの定義を Log Config として管理しています。
「Log Configs」のメニューから設定していきます。Log Type として「Multi-line Text」を選択すると、Parser としてJava-Spring Boot が選択できます。
Log Format に以下を入力します。
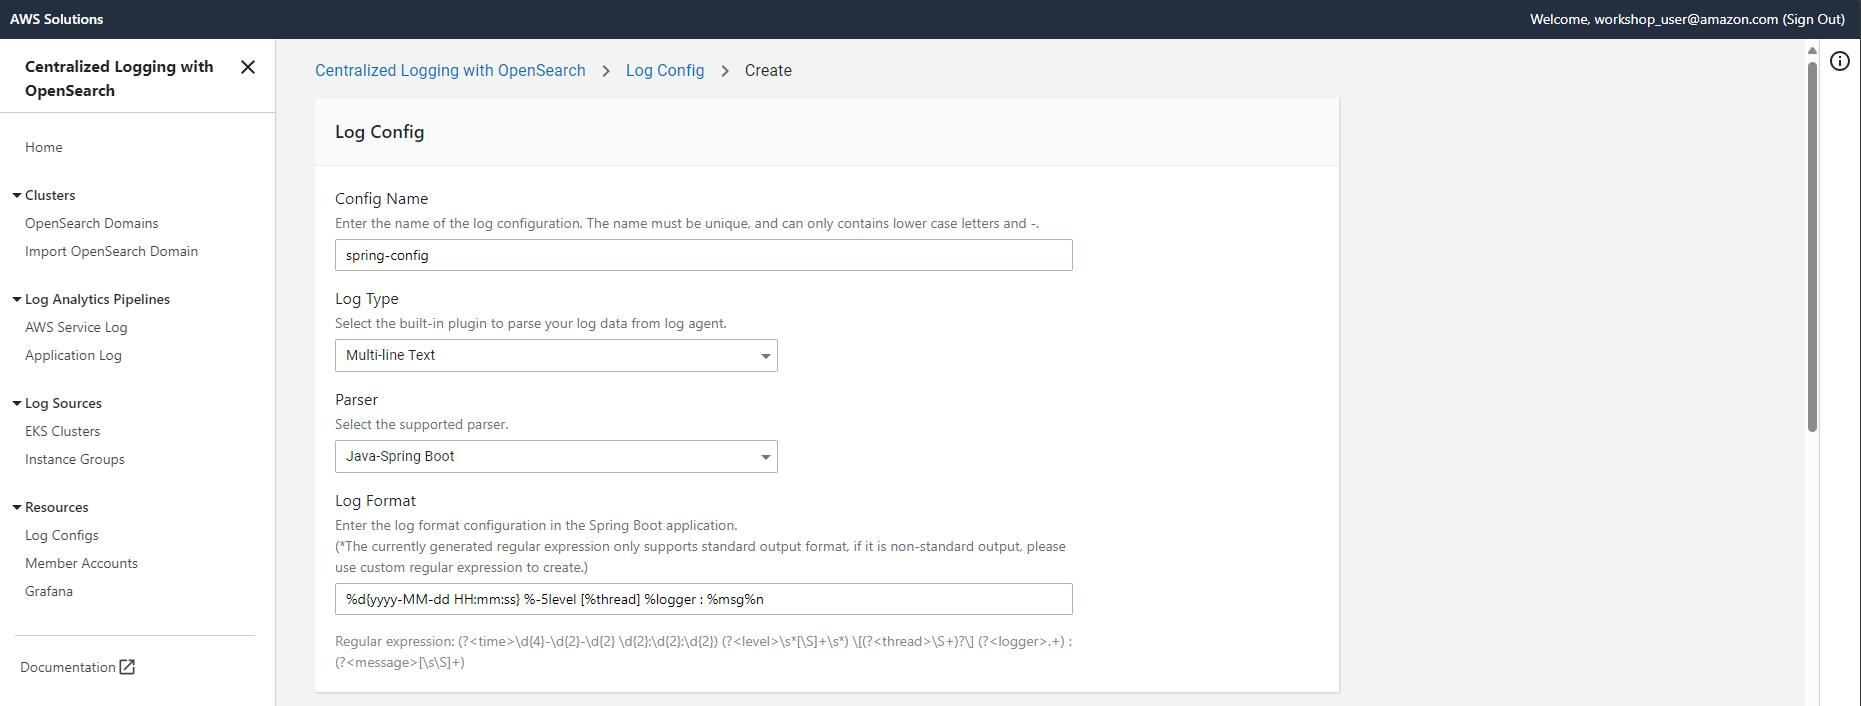
Log Format
Log Format に以下を入力します。
%d{yyyy-MM-dd HH:mm:ss} %-5level [%thread] %logger : %msg%nSample log
Log Format を入力すると、Regular Expression が Format に合わせて変化したことが分かります。「OpenSearch を利用した統合ログ管理」 ソリューションでは、Spring Boot のような標準でサポートされているログについては Parser が搭載されています。つまり、正規表現を皆さん自身で記述する必要がありません! Sample log に以下を入力し、右側の「Parse Log」をクリックすると、入力したログが正しく Parse されているかを確認できます。 Timezone は UTC+00:00 を選択します。
2022-02-18 10:32:26 ERROR [http-nio-8080-exec-1] org.apache.catalina.core.ContainerBase.[Tomcat].[localhost].[/].[dispatcherServlet] : Servlet.service() for servlet [dispatcherServlet] in context with path [] threw exception [Request processing failed; nested exception is java.lang.ArithmeticException: / by zero] with root cause
java.lang.ArithmeticException: / by zero
   at com.springexamples.demo.web.LoggerController.logs(LoggerController.java:22)
   at java.base/jdk.internal.reflect.NativeMethodAccessorImpl.invoke0(Native Method)
   at java.base/jdk.internal.reflect.NativeMethodAccessorImpl.invoke
Step3. アプリケーションログパイプライン作成
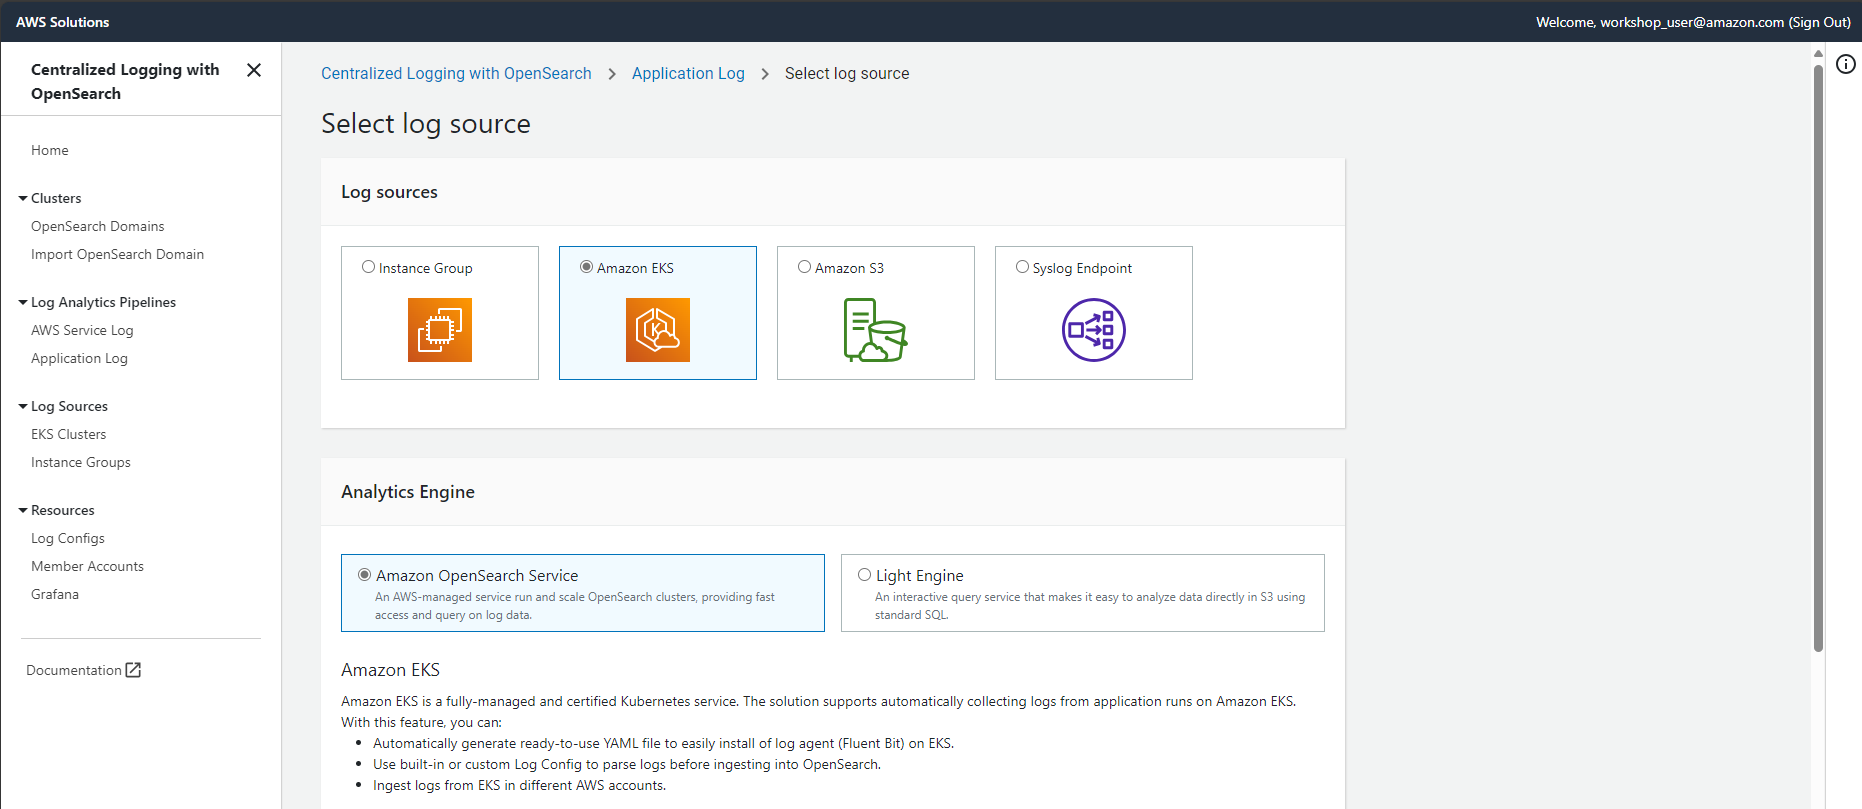
次に、アプリケーションログパイプラインを作成していきます。メニューから「Application Log」を選択します。
Log source に「Amazon EKS」を選択し、Analytics Engine に「Amazon OpenSearch Service」を選択します。
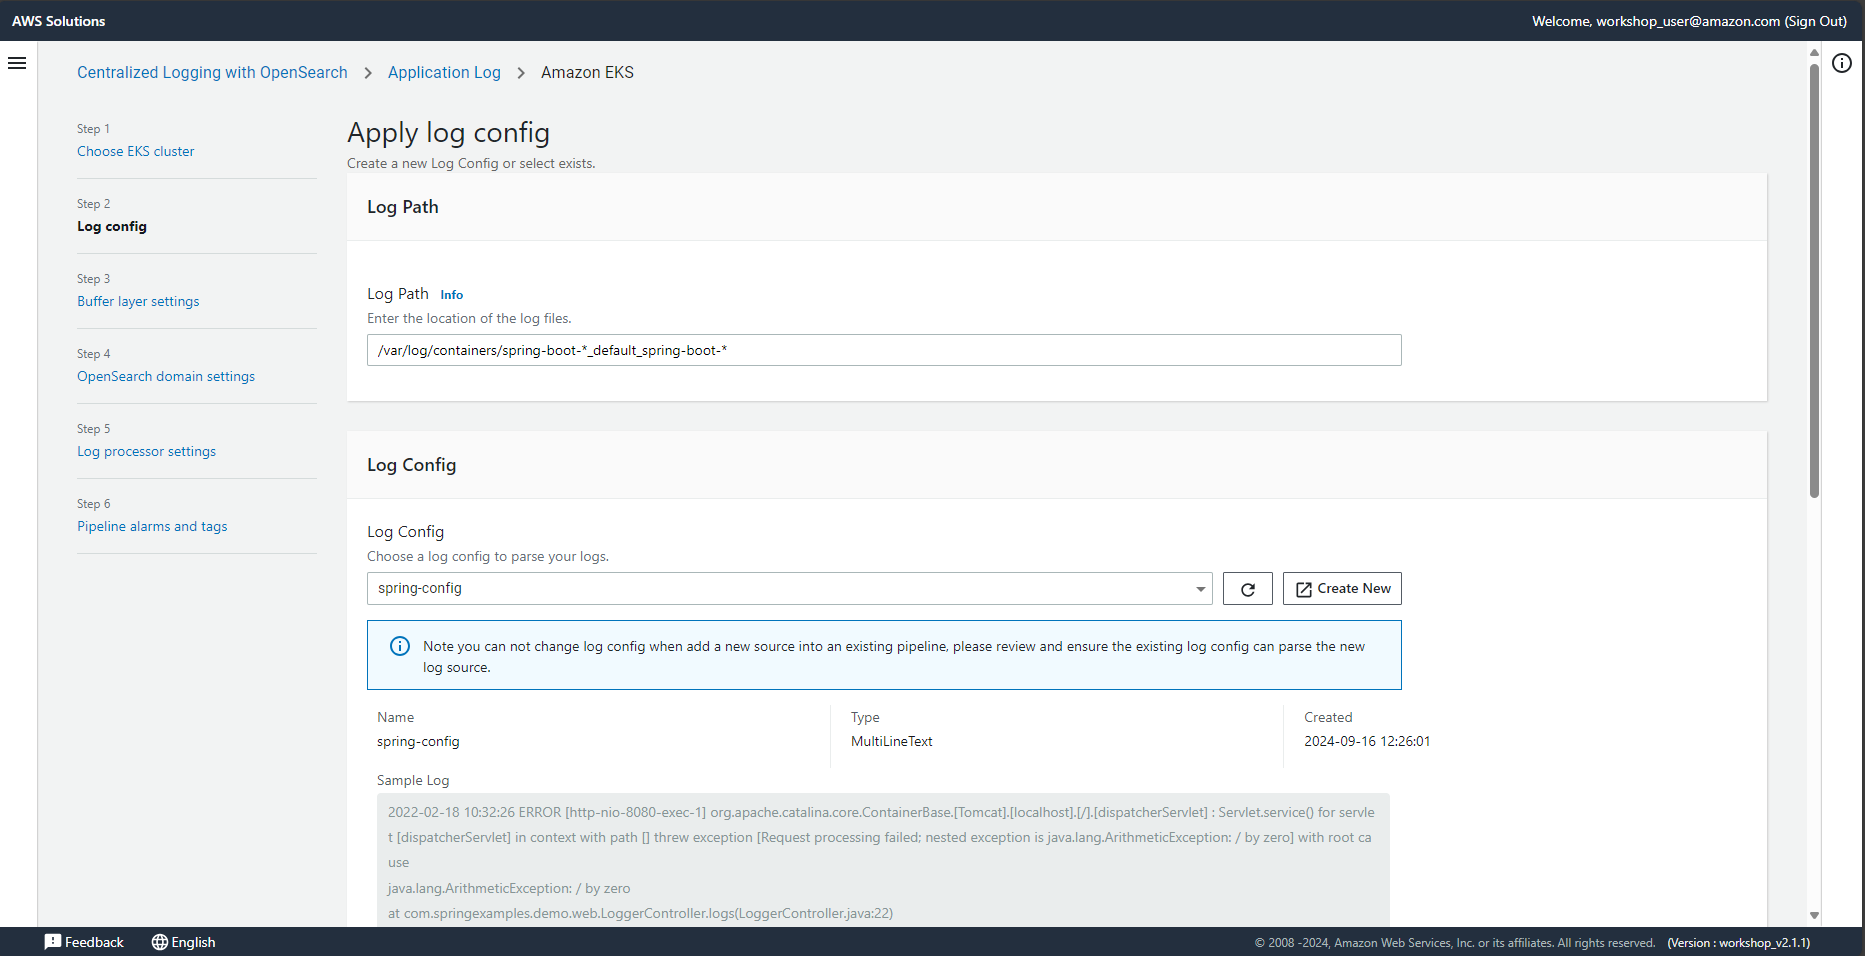
Log Path には、こちらを入力します。
/var/log/containers/spring-boot-_default_spring-boot-
Log Config の設定
Log Config には先ほどの Step2. で作成した Log Config を選択します。
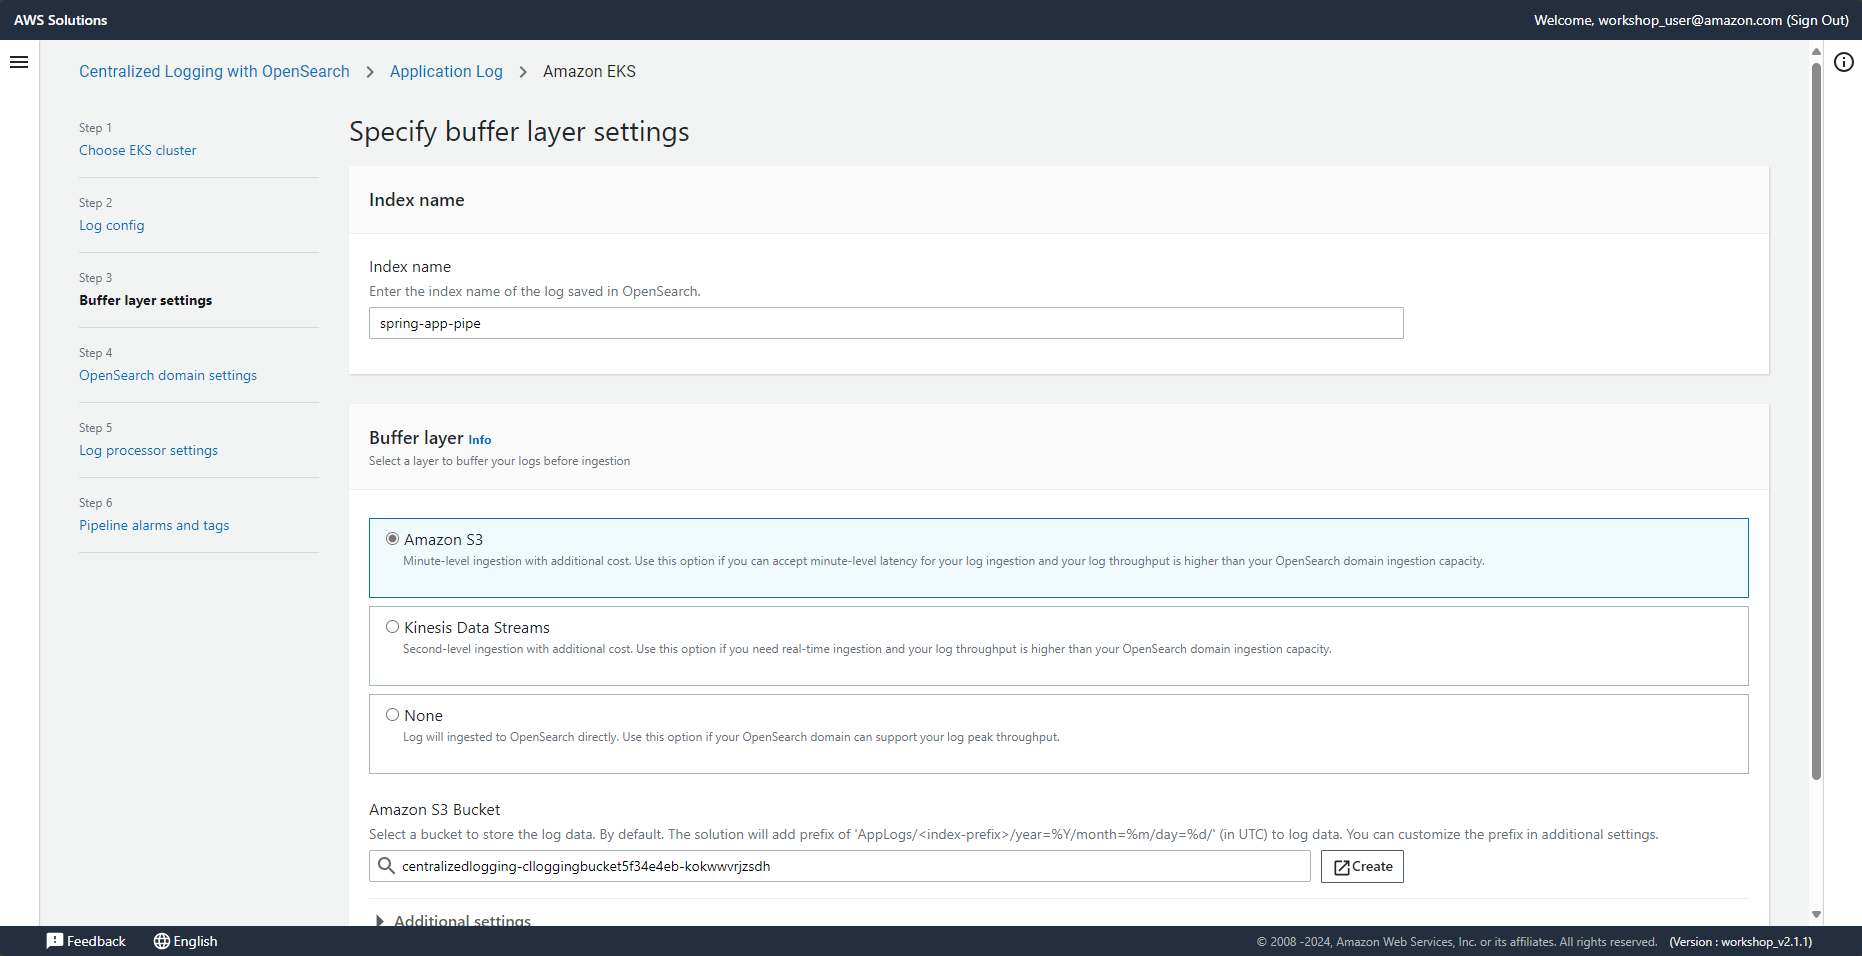
Buffer layer の設定
Index name を任意の名前で入力します。この名前がOpenSearch の Index名となります。
Buffer layer はここでは「Amazon S3」を選択します。実現したい要件に応じて Buffer layer を選択します。リアルタイムでのログ取り込み必要性の有無やコスト面を考慮して決定してください。
S3 バケット名を入力します。Additional settings ではストレージクラスの変更なども可能となっています。
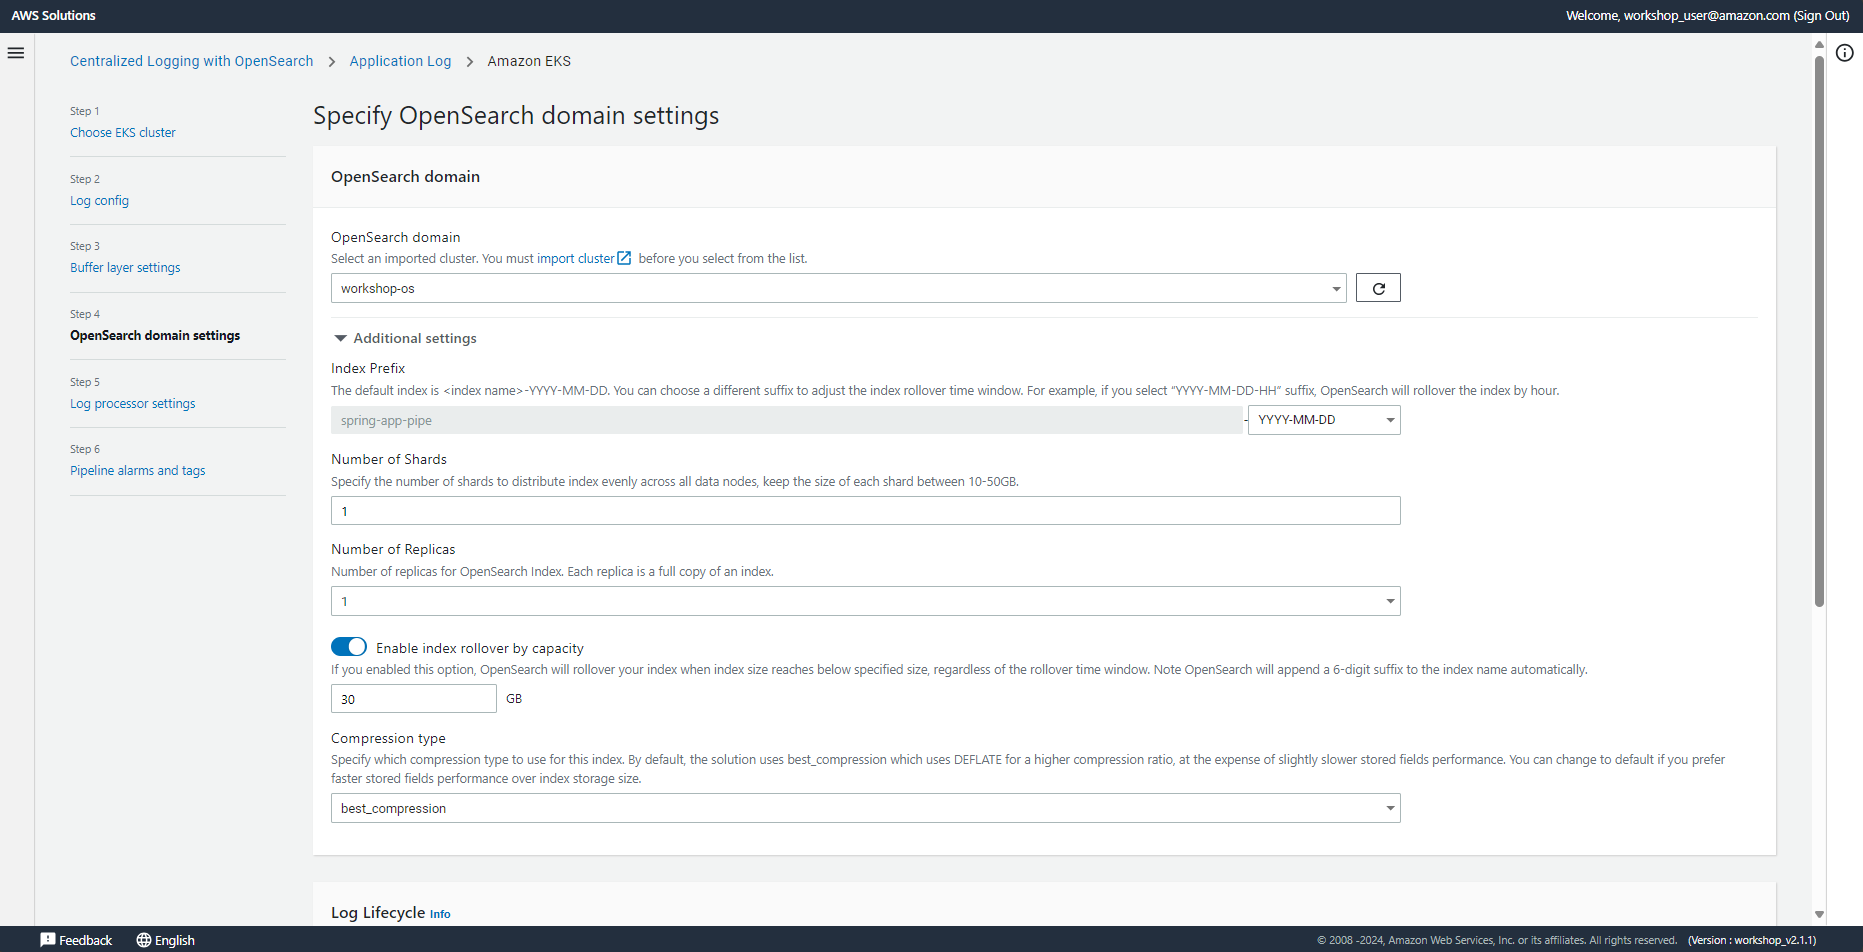
OpenSearch ドメインを選択
次に、作成済みの OpenSearch ドメインを選択します。ここでも Additional settings で OpenSearch インデックスのシャード数やレプリカ数を設定できます。必要に応じて変更してください。
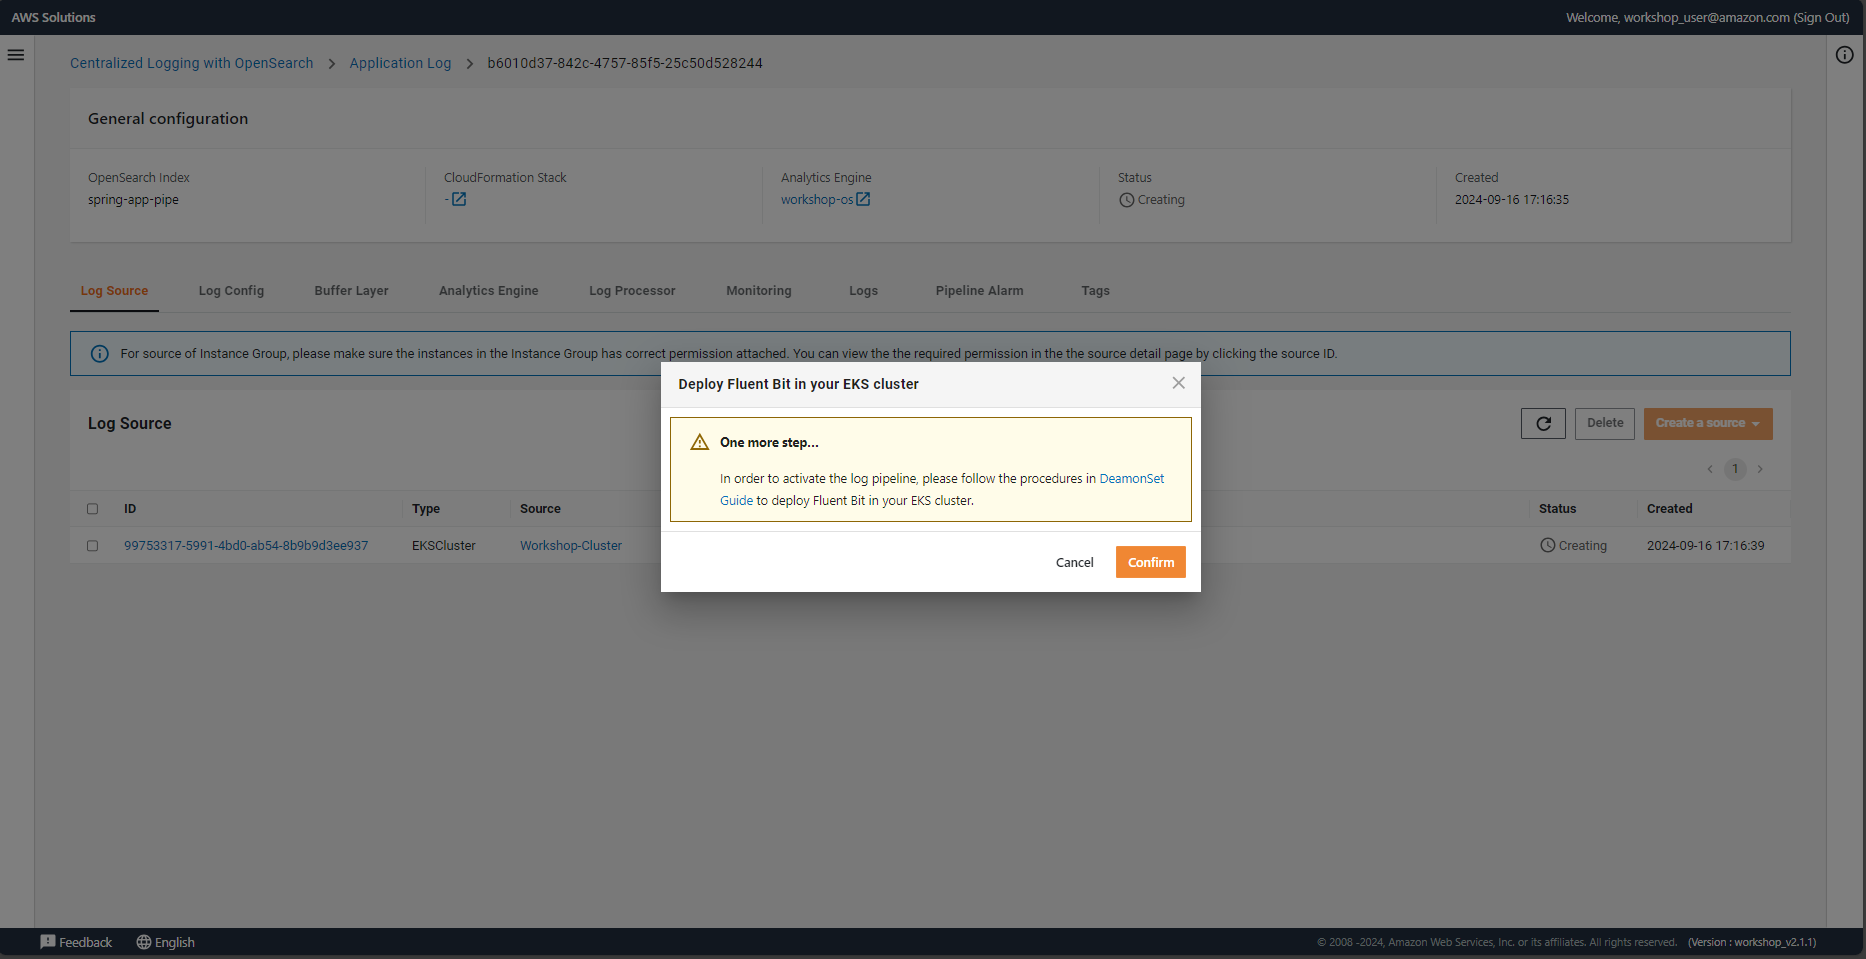
Application Log パイプラインの作成を完了
Log Processor には「AWS Lambda」を選択し、そのまま「Create」ボタンを押下し、Application Log パイプラインの作成を完了してください。
「Create」ボタンを押すと、図のようなポップアップで、Fluent Bit を EKS クラスターにデプロイするようメッセージが現れます。
Step4. Fluent Bit デプロイ
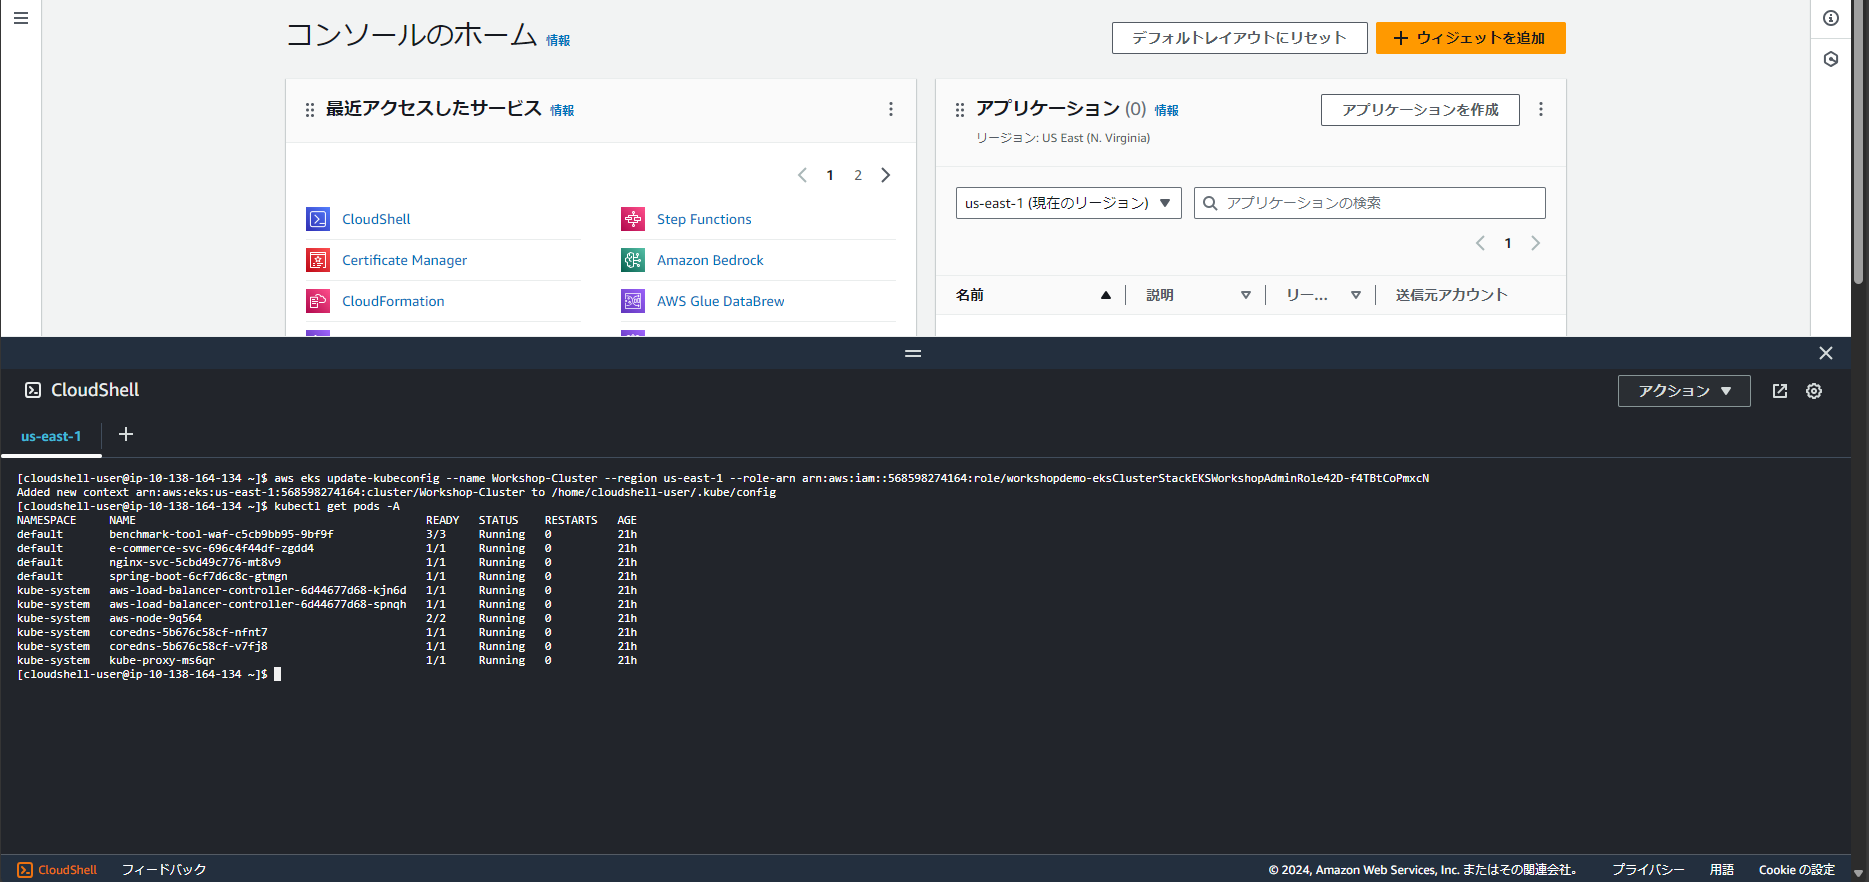
CloudShell から EKS クラスターの設定を変更していきます。
ワークショップの CloudFormation スタック「workshopdemo」出力タブのeksClusterStackEKSClusterConfigCommand の値を CloudShell から入力し、EKS クラスターに接続します。
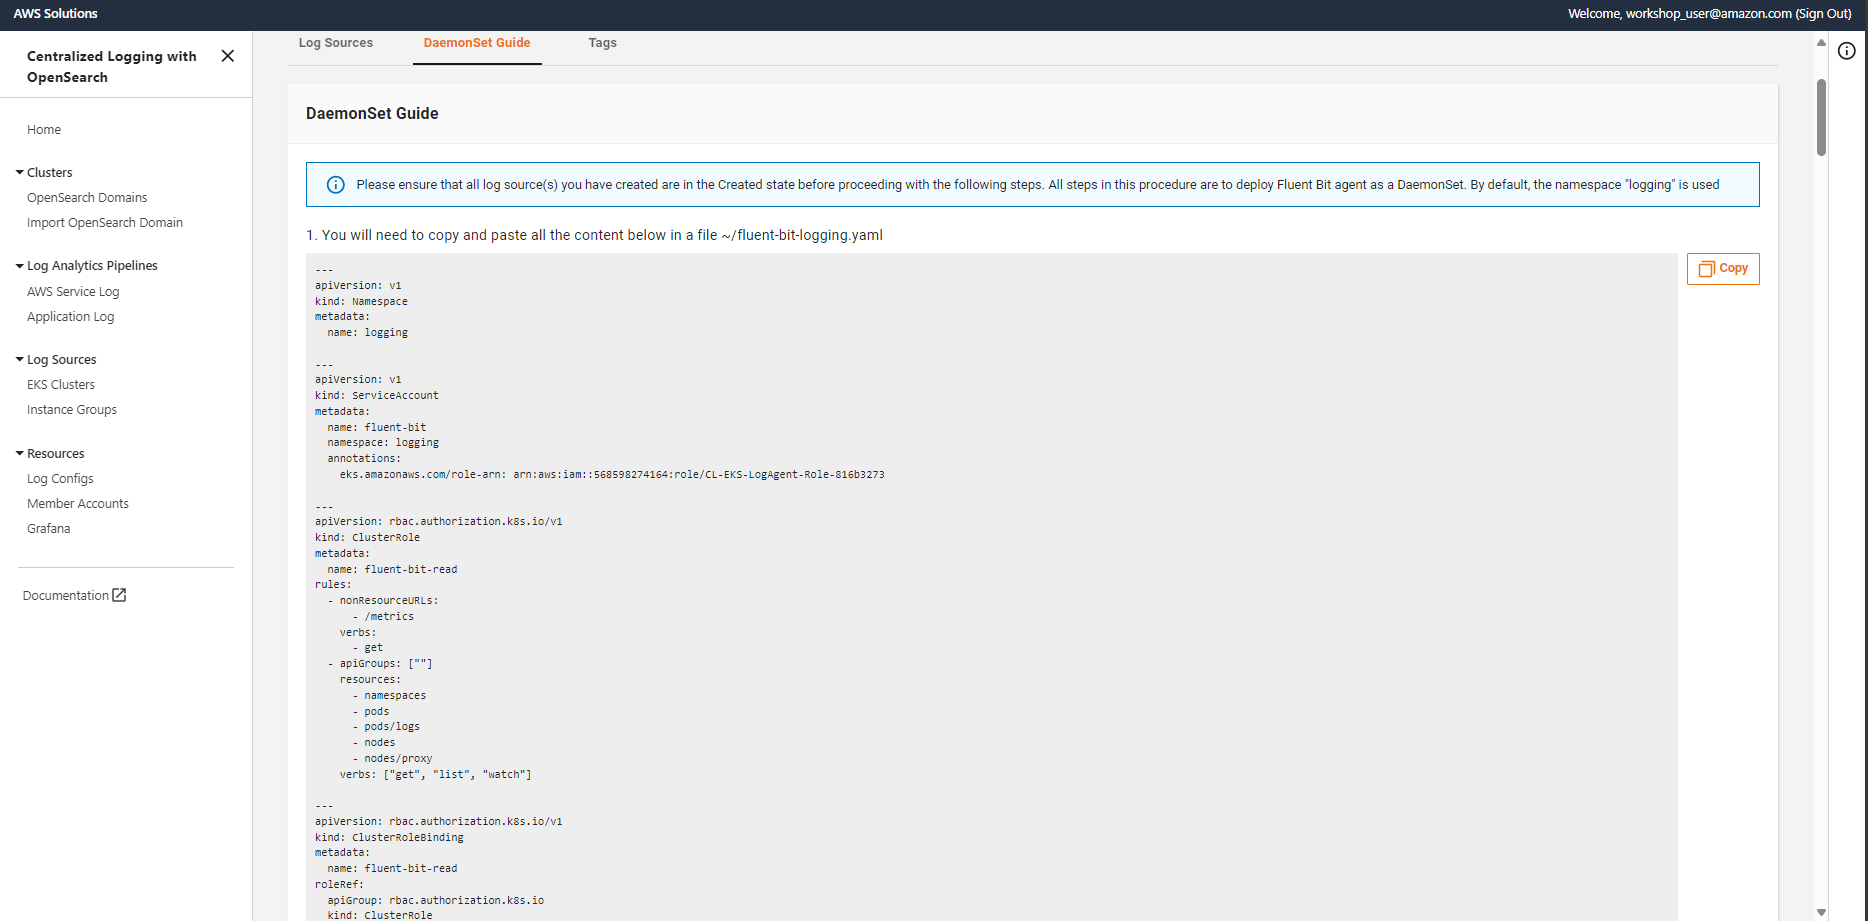
fluent-bit-logging.yaml ファイルを保存
「OpenSearch を利用した統合ログ管理」 ソリューションコンソール画面に戻り、EKS Clusters の DamonSet Guide タブから fluent-bit-logging.yaml ファイル定義をコピーします。コピーした内容をローカル端末側で fluent-bit-logging.yaml をファイル名として保存します。
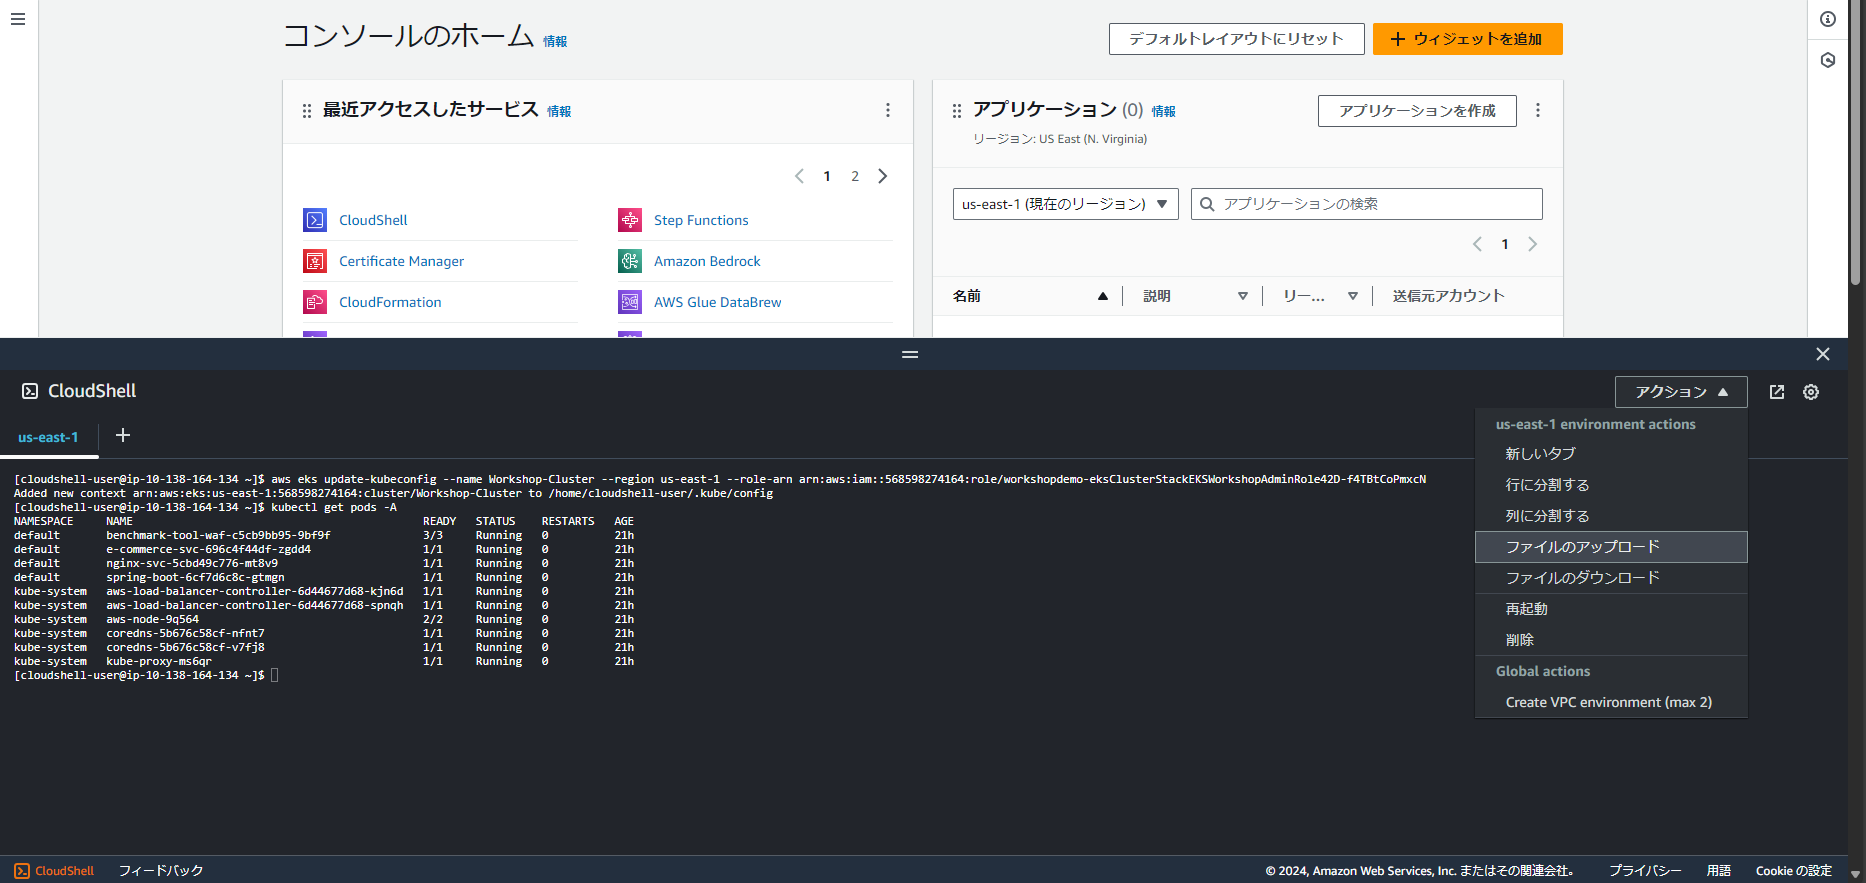
保存した YAML ファイルをアップロード
保存した YAML ファイルを AWS CloudShell からアップロードします。
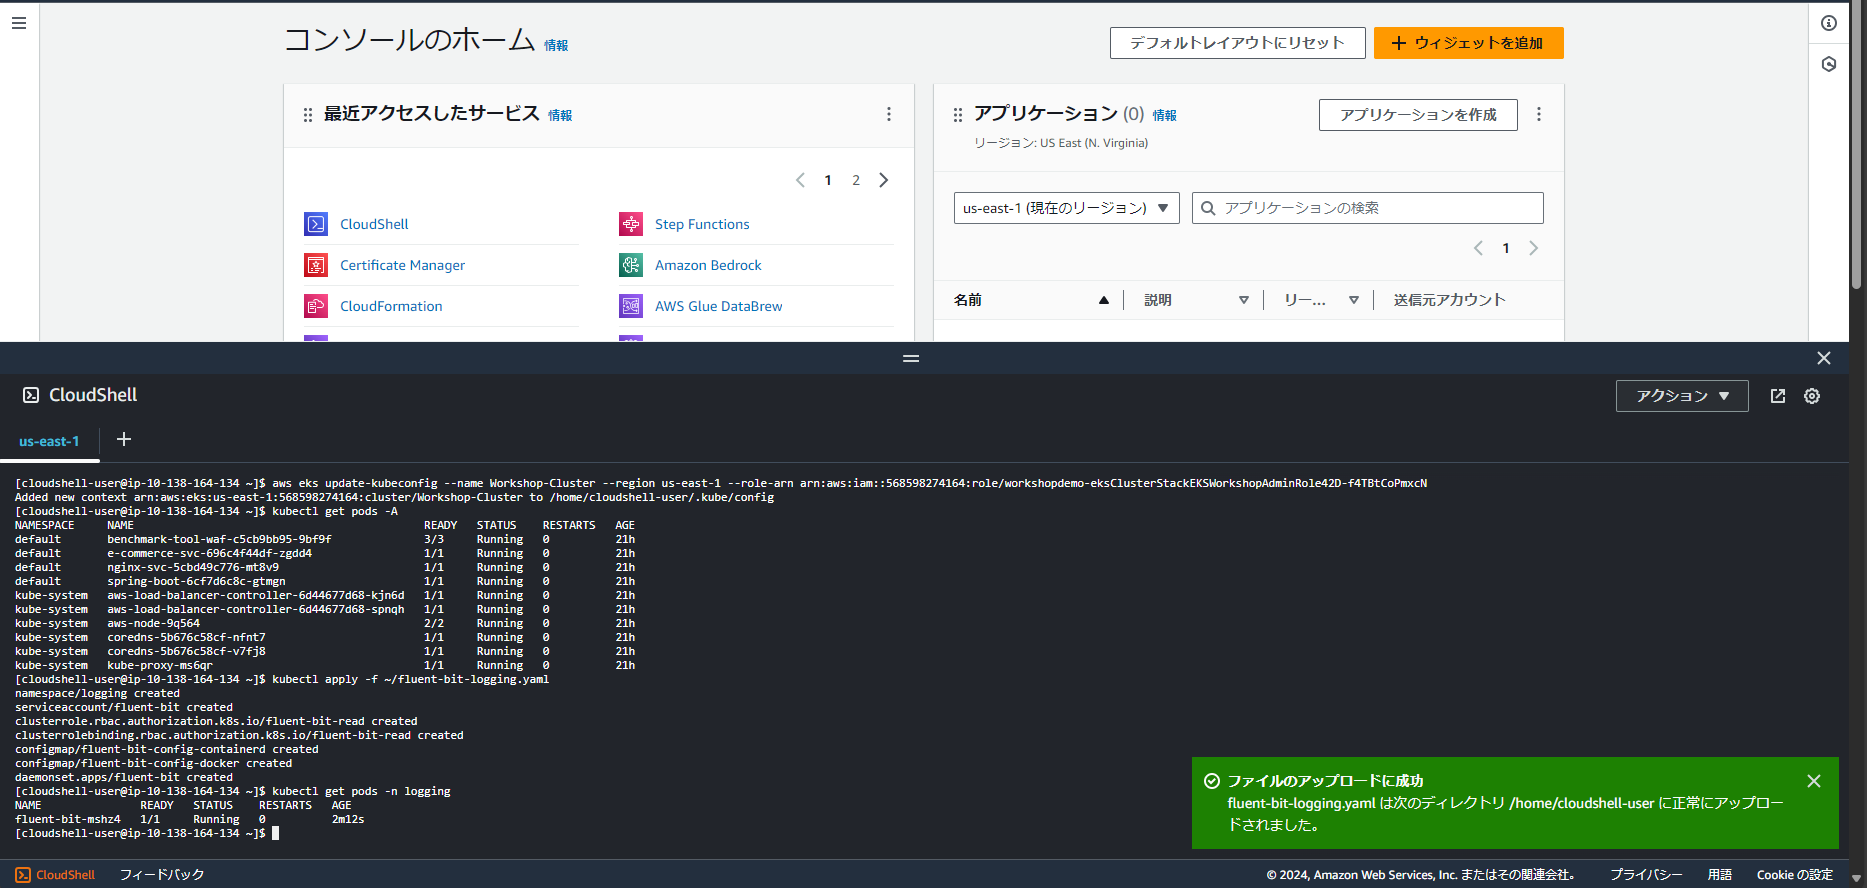
Fluent Bit ログエージェントを EKS にデプロイ
次に、以下のコマンドで Fluent Bit ログエージェントを EKS にデプロイします。
kubectl apply -f fluent-bit-logging.yaml成功
Fluent Bit が立ち上がっていることが確認できました。
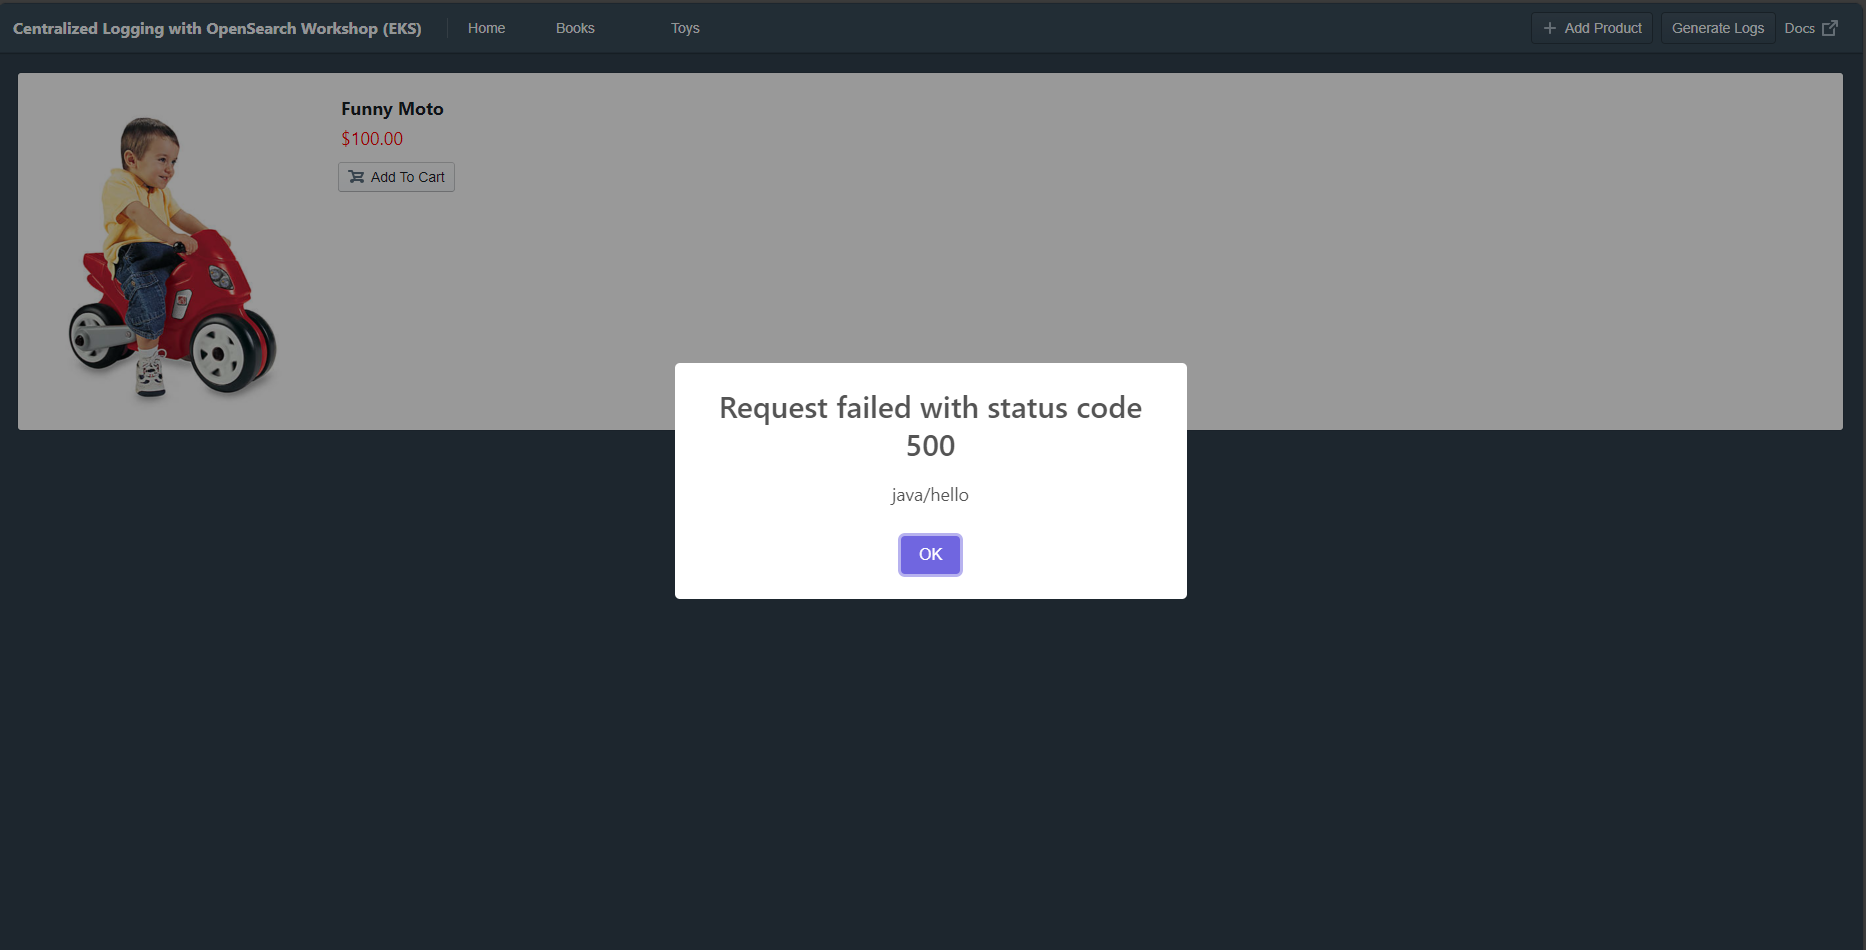
Step 5. E コマース Web サイトでログを生成し、Amazon OpenSearch Service で確認
E コマース Web サイトの URL にアクセスし、Funny Moto の画面から「Add to Cart」ボタンを押下します。エラーが発生してログが生成されます。
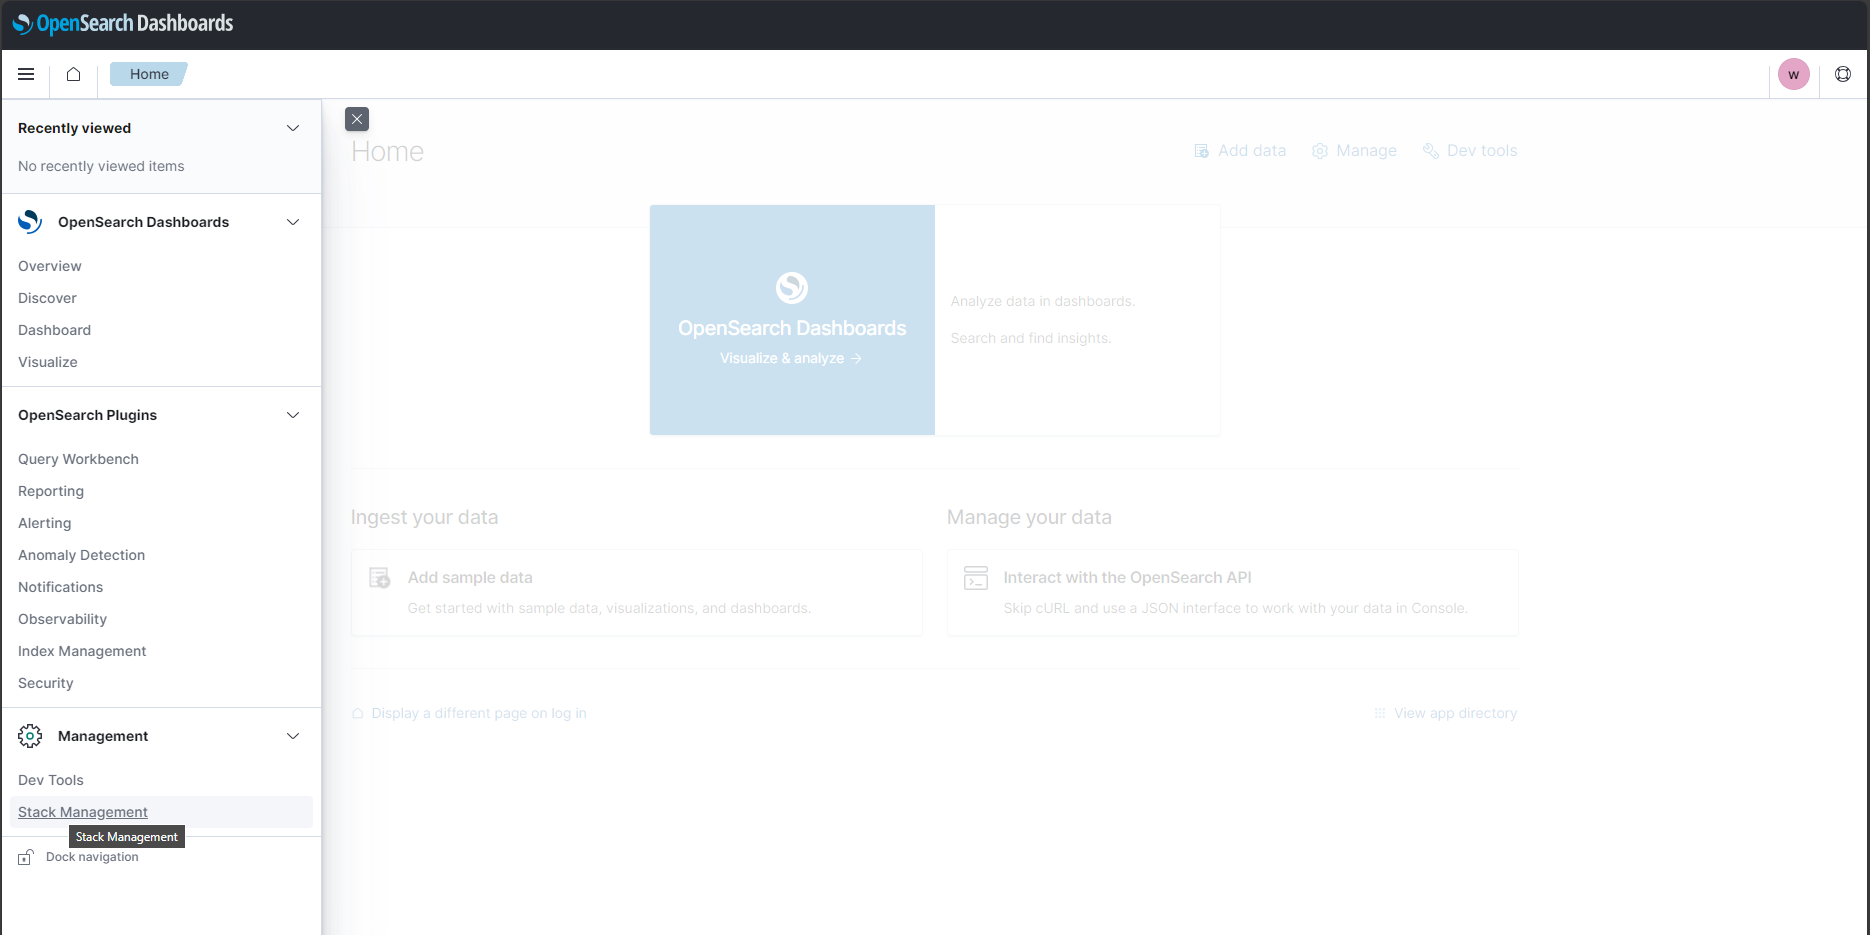
index pattern を定義
OpenSearch Dashboards にアクセスし、StackManagement から index pattern を定義します。
index pattern を定義
Index pattern name に以下を入力します。Time Field は time を選択します。
spring-app-pipe-*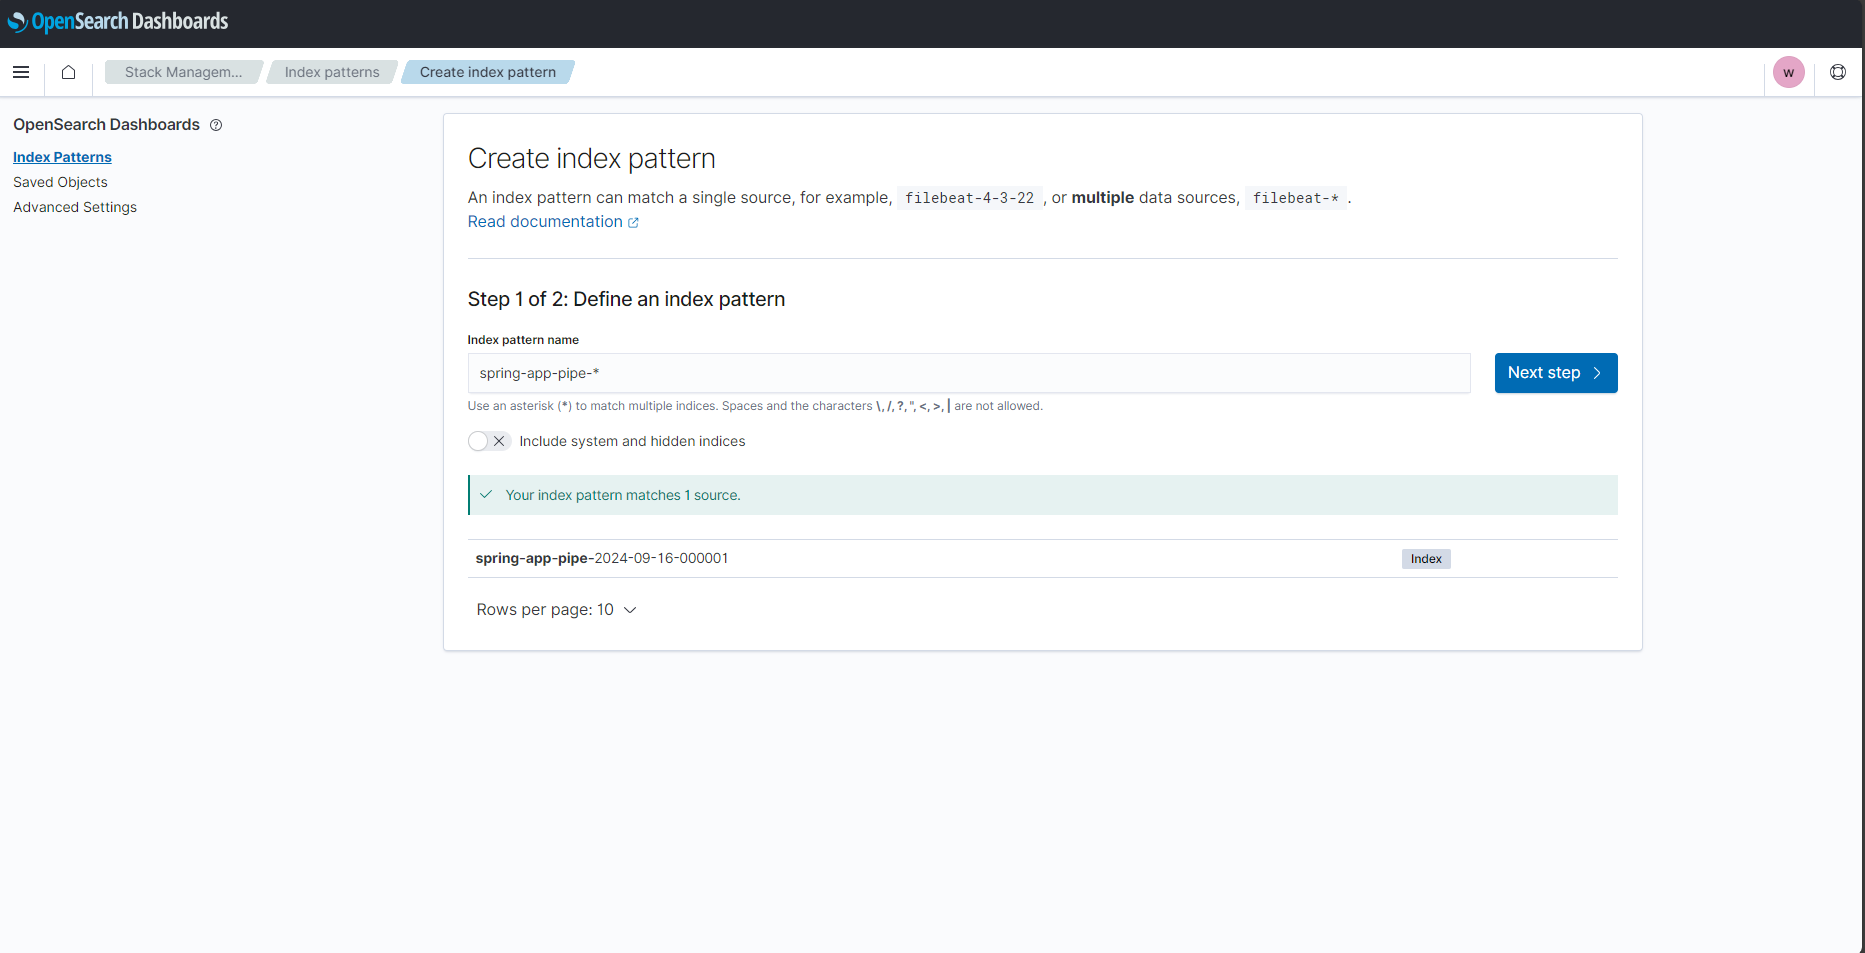
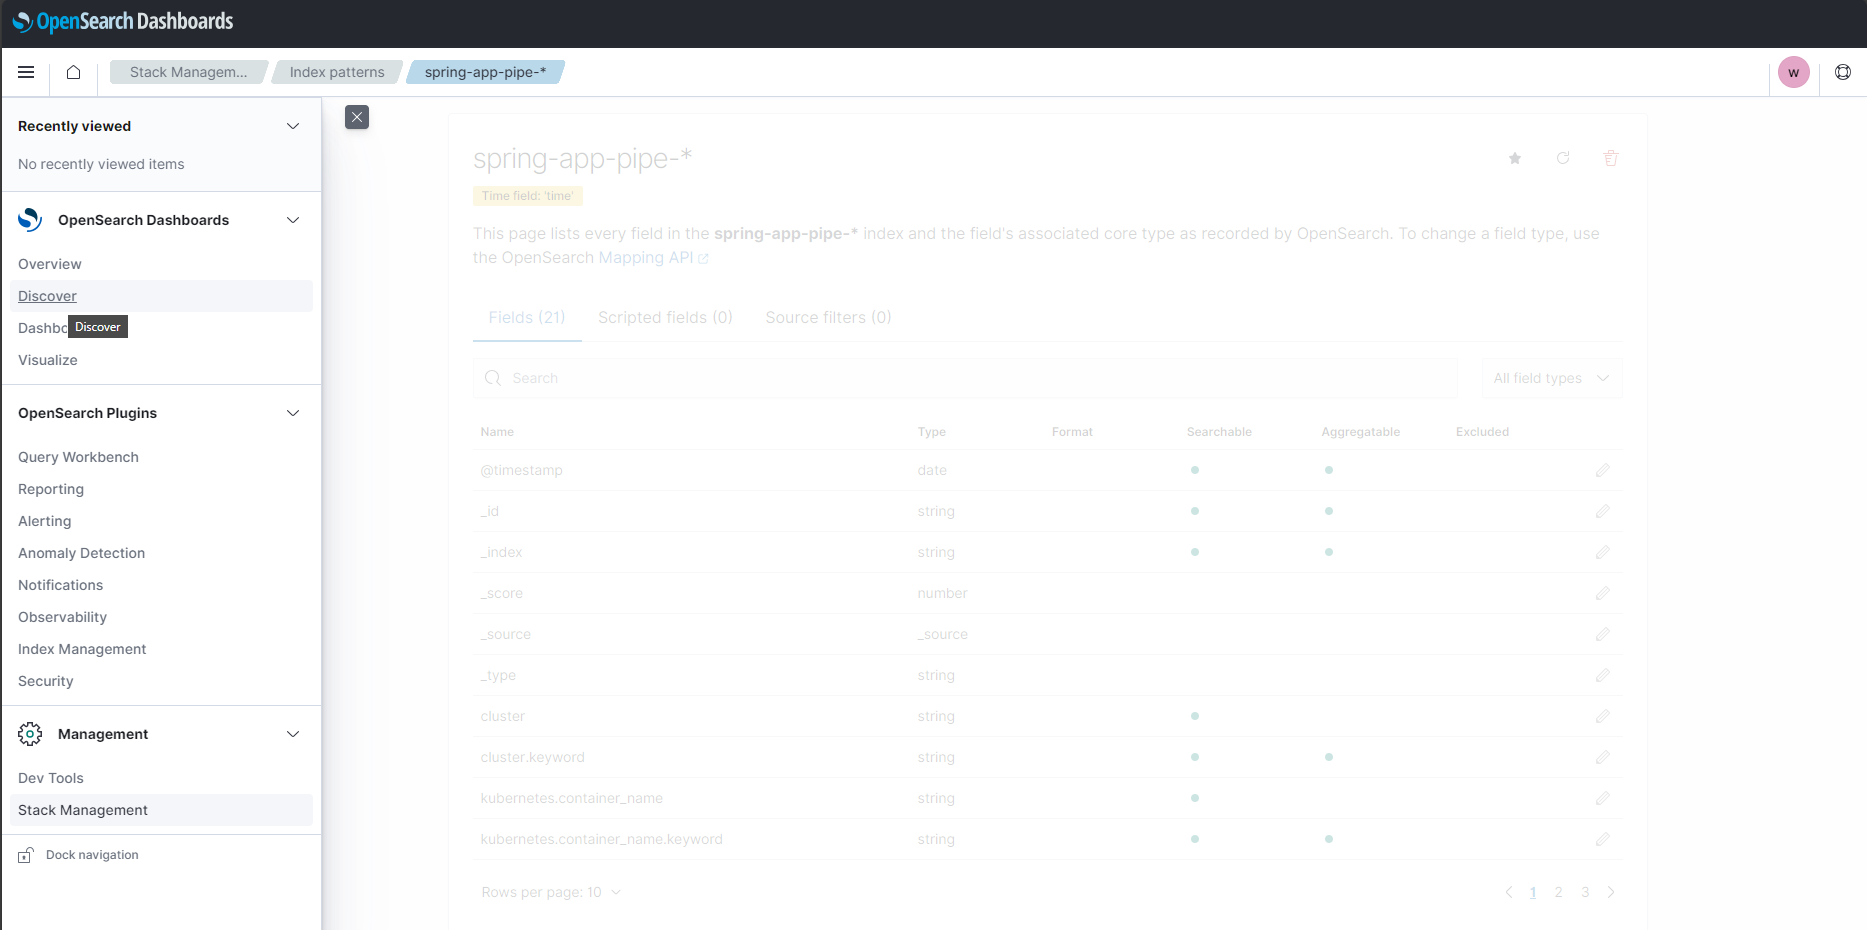
Spring Boot ログを確認
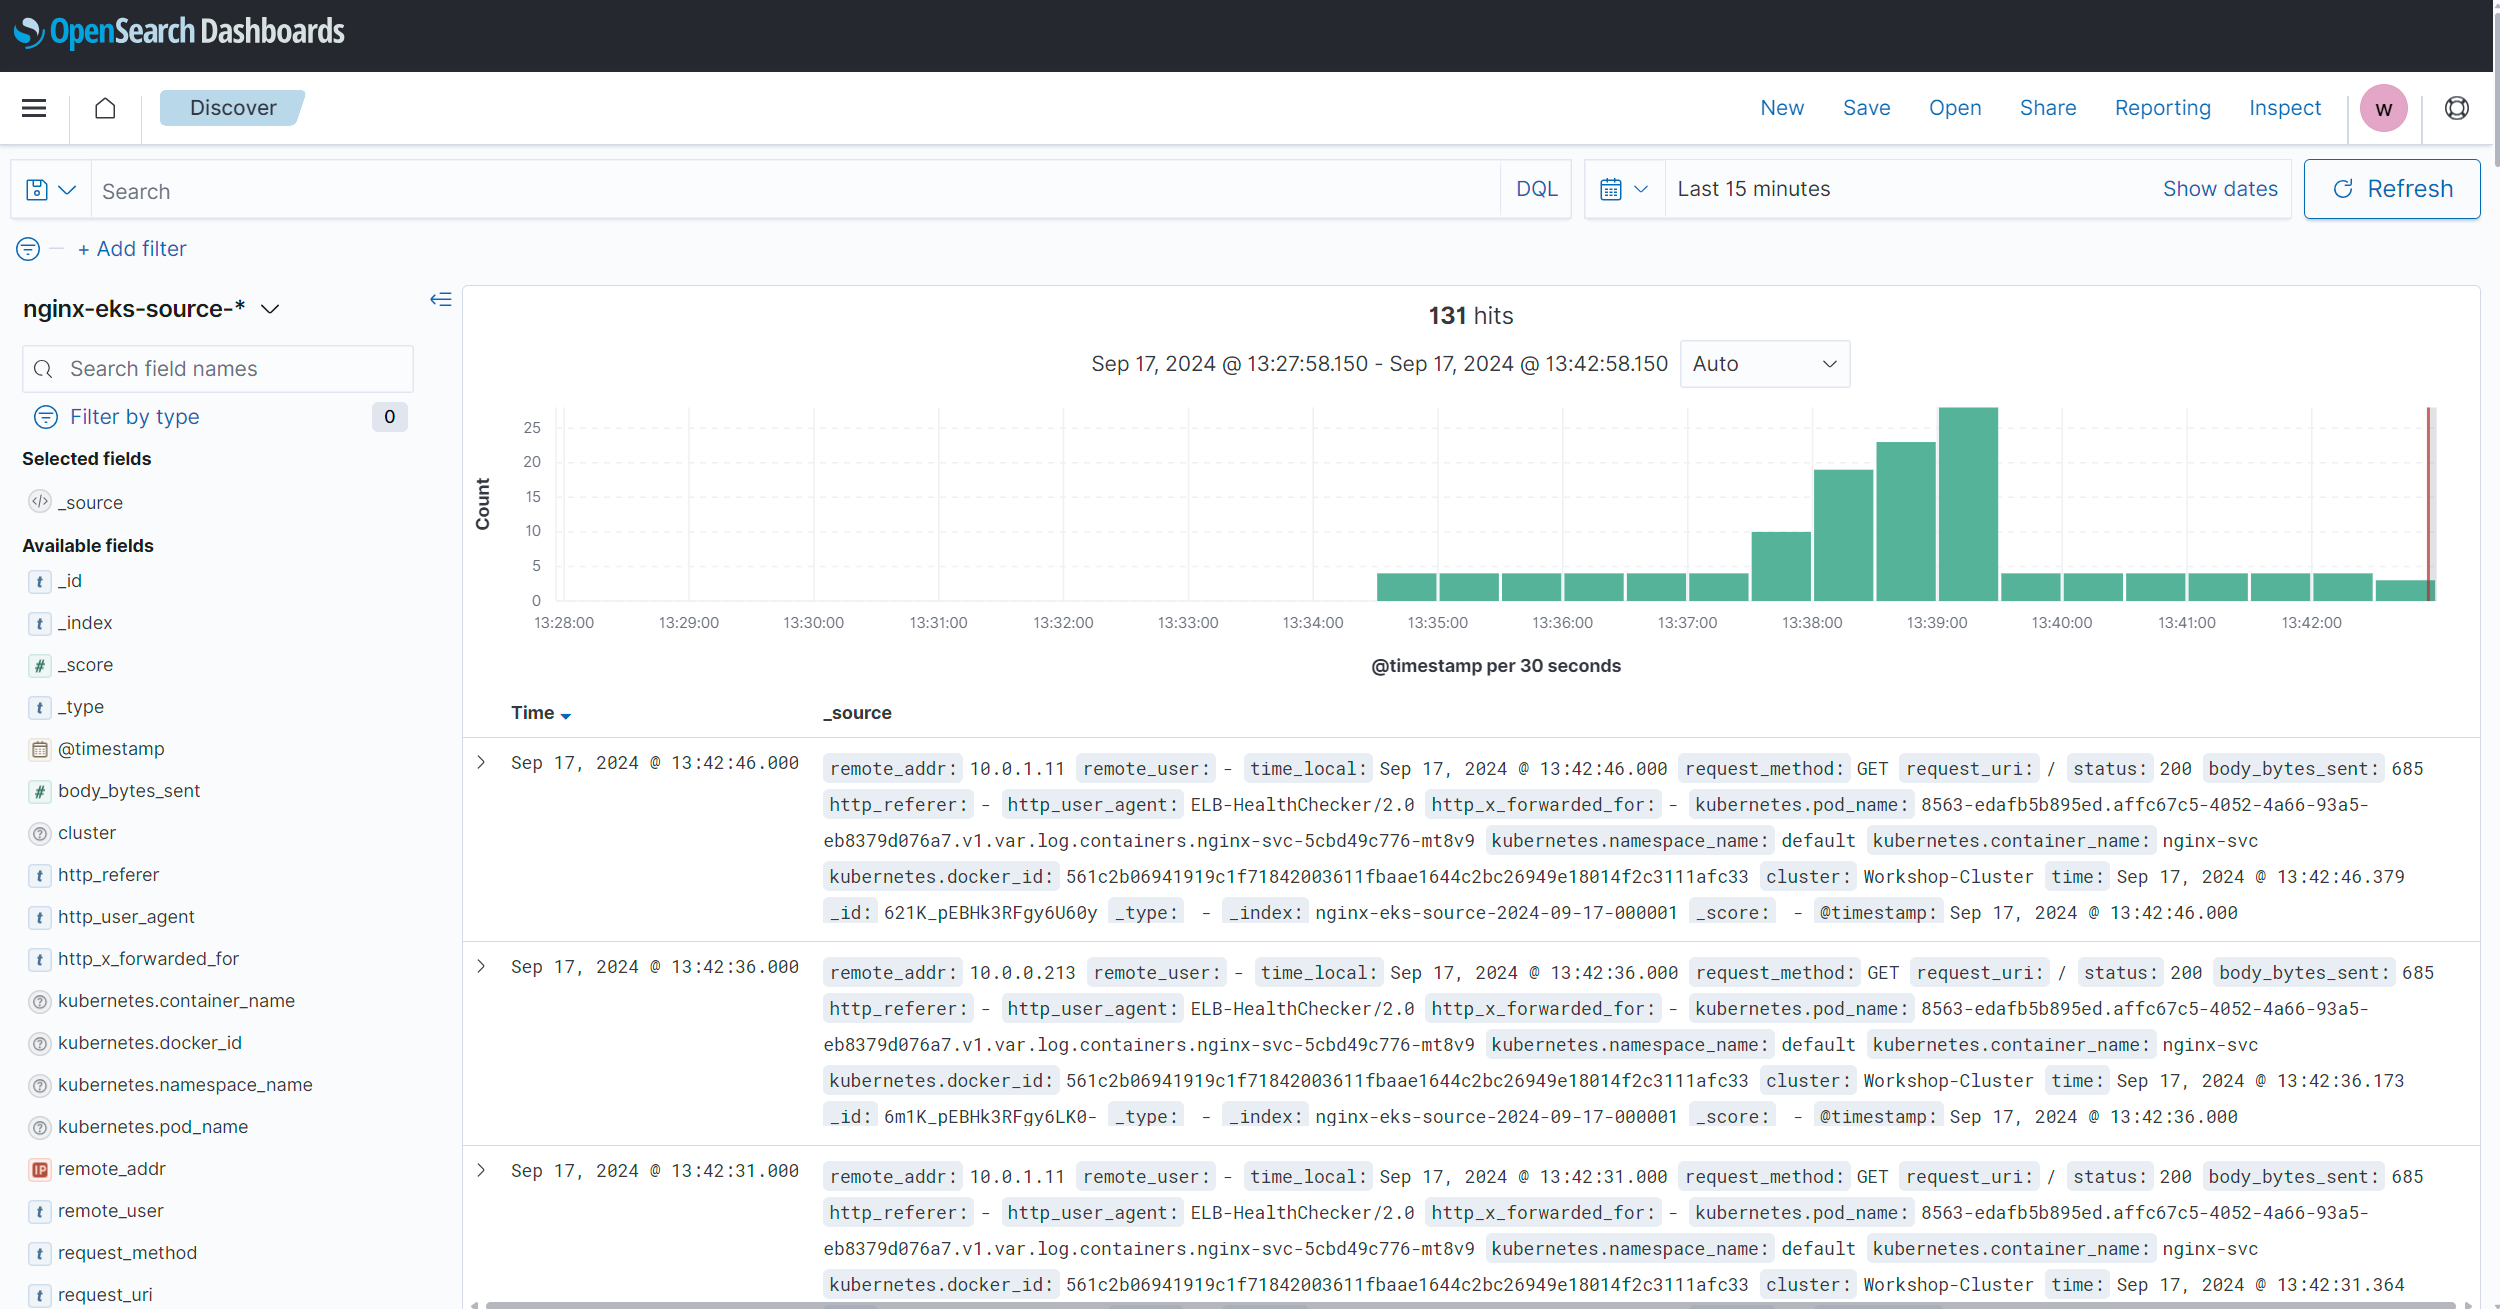
それでは、いよいよ Spring Boot ログを見てみましょう !
Discover メニューにアクセスします。Index pattern に「spring-app-pipe-*」が選択されていることを確認します。
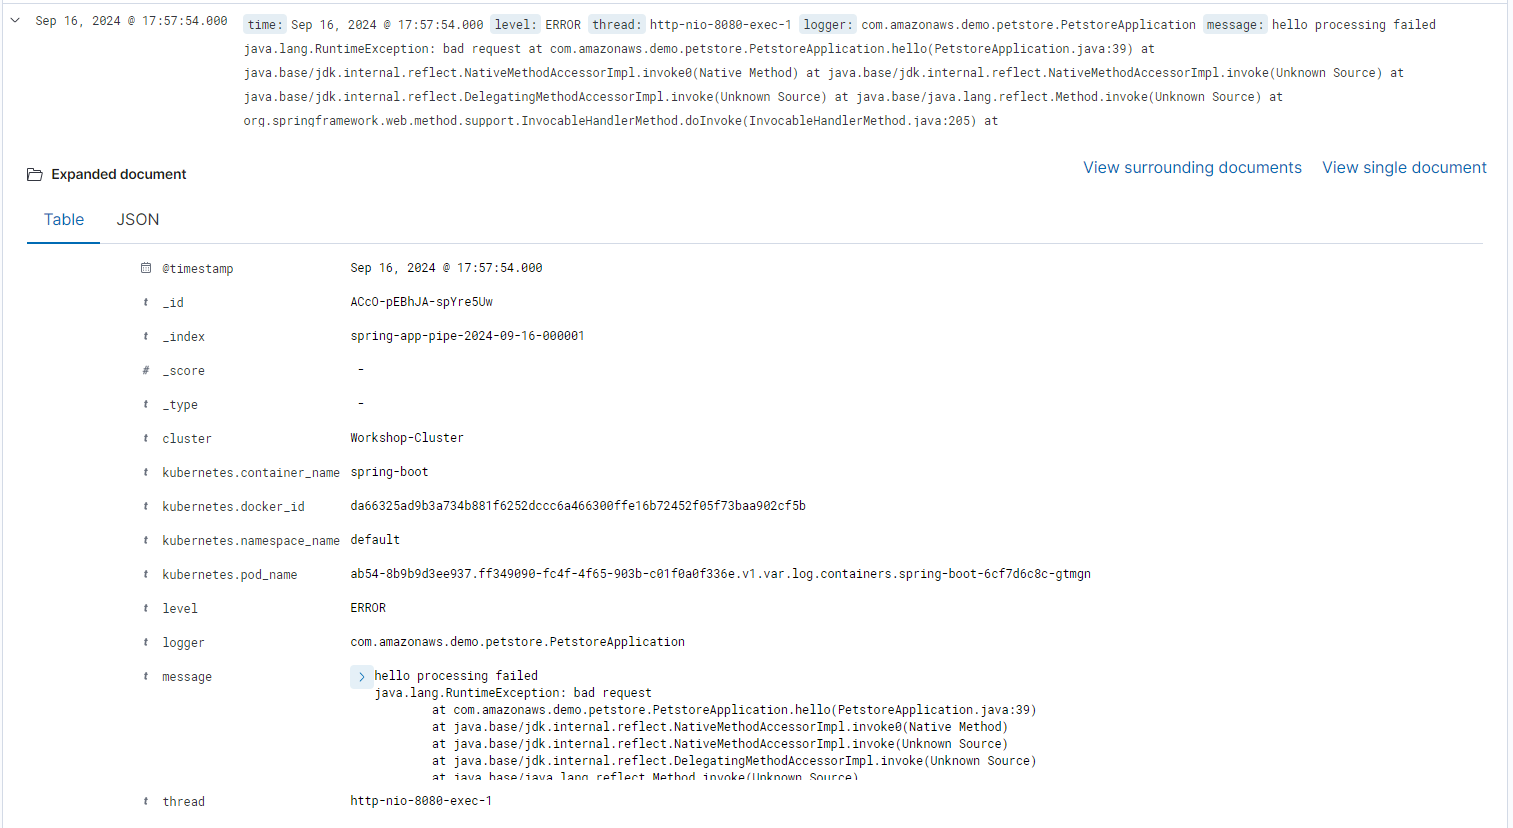
エラーログの表示
図のようなエラーログが表示されています !
まとめ
「OpenSearch を利用した統合ログ管理」 ソリューションを使用して、EKS アプリケーションログの取り込みから Amazon OpenSearch Service での確認までの流れを実践しました。ログパイプライン構築に関わる以下の設定を「OpenSearch を利用した統合ログ管理」コンソール画面で GUI ベースで簡単に設定・管理できることをご確認いただけたかと思います。
- Spring Boot アプリケーションログのパース定義
- Log Bufferレイヤーの作成
- Amazon OpenSearch Service のインデックス設定
- Log Processor の設定
- Fluent Bit の EKS クラスターへのデプロイ
本記事が、Amazon OpenSearch Service を活用した日々のログデータ管理と分析をより効果的に行うためのきっかけとなれば幸いです。
筆者プロフィール
小林 航
アマゾン ウェブ サービスジャパン合同会社
ソリューションアーキテクト
製造業に特化したソリューションアーキテクトとしてお客様を支援しております。
週末は美味しい物を食べたり犬と散歩したり犬に餌をあげたりしています。

Did you find what you were looking for today?
Let us know so we can improve the quality of the content on our pages