- Partners›
- Partner Success with AWS
Accessing IMDb-Licensed Content for Visualizations through AWS Data Exchange with Tableau
Overview
Data analytics and visualization solutions company Tableau, which is a part of Salesforce, aims to help people see and understand data in new and creative ways. To showcase its products and inspire people to explore data visualization, the company created Data + Movies, a program for people of all skill levels to use and analyze licensed data from AWS Partner IMDb, an entertainment information database to create visualizations and share them publicly. IMDb makes its datasets available through AWS Data Exchange, which customers can use to find, subscribe to, and use third-party data in the cloud. As a result, Tableau can access the data with ease, keep it updated, and deliver it to customers in a streamlined way.
About Tableau
Tableau is based in Seattle, Washington and offers products and solutions for data management, analytics, preparation, visualization, and more. Tableau is a part of Salesforce.
Opportunity | Using AWS to Facilitate IMDb Data Visualization for Tableau
Tableau, a Salesforce company, first explored the idea of running a campaign based on media and entertainment data visualizations in 2019 with Data + Music, in which customers submitted music data visualizations. The company realized that this was a fun and innovative way to get people excited about what they could do with its products.
For its next campaign, Tableau created the Data + Movies Challenge, which invited people to make visualizations of movie data for a free T-shirt. An easy-to-use "Starter Kit" makes it so that anyone can participate, regardless of their skill level. Knowing that AWS Partner IMDb is one the world’s most popular and authoritative source for information on movies , TV shows, and celebrities, Tableau approached the company about licensing its movie data. The two companies agreed to share subsets of the data on Tableau Public for people to use. “We’ve got this amazing movie data from IMDb, and we’ve built a Starter Kit and dashboard so that anyone, regardless of skill level, can create a visualization to tell a story about their favorite films, actors, directors, or genres,” says Karen Mahardy, senior marketing manager at Tableau.
Tableau has been using Amazon Web Services (AWS) since 2015, and the company runs about 90 percent of its workloads on AWS. “We use AWS all the time. It was the delivery mechanism for this dataset,” says Mahardy. “And IMDb is a world-renowned source for movie data.” IMDb licenses its data on AWS Data Exchange, and Tableau approached it to be part of Data + Movies. “AWS Data Exchange is the only place where companies including major studios, global streamers, consumer brands, and social networks can license IMDb data to power the creation and discovery of entertainment,” says Christopher Sterkel, principal for technical business development at IMDb.
Tableau’s business technology team used AWS Data Exchange to download the massive IMDb-licensed data file as well as manage payments and invoices. Then, it built dashboards to centralize the data and make it accessible to the public. The Starter Kit helps people who are new to Tableau and data visualizations create their first visualization in 30–40 minutes. Meanwhile, those with more advanced skills can spend hours crafting highly customized visualizations. “One of the things that makes Tableau different from other analytics products is that we have an amazing community,” says Mahardy. “They love to engage with each other through programs like Data + Movies to show off their skills and learn from each other.”
Subscribing to the licensed data through AWS Data Exchange was fast. “The delivery process was about half the time we expected, which meant we could move immediately into production ,” says Mahardy. After Tableau had the data from IMDb, it took only about 40 hours to prepare it, create the Starter Kit dashboard, and write step-by-step instructions so that people could start making visualizations. “Everything was really seamless and simple on IMDb’s side to work to make this happen,” says Mahardy.
About AWS Partner IMDb
IMDb is the world’s most popular and authoritative source for information on movies, TV shows, and celebrities. IMDb licenses information from its vast and authoritative database to third-party businesses worldwide.
Solution | Empowering Creativity and Analytics Using AWS
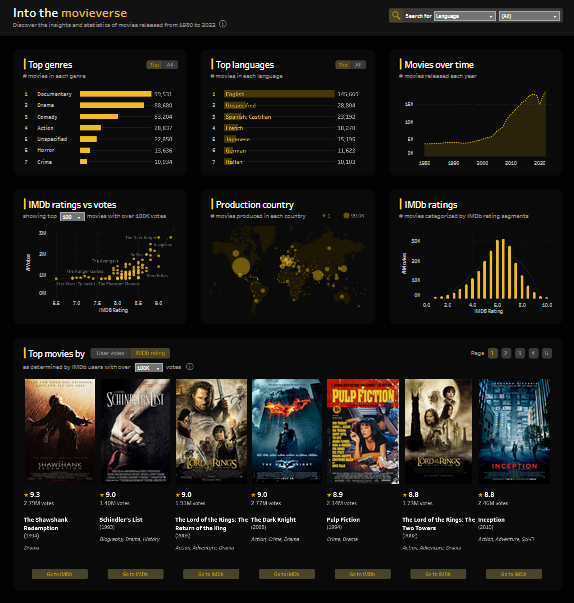
Tableau used automatic exports in AWS Data Exchange to seamlessly copy IMDb-licensed datasets to Amazon Simple Storage Service (Amazon S3), an object storage service built to retrieve virtually any amount of data from anywhere. Accepting the data, accessing it, billing and invoicing, and security were all handled through AWS Data Exchange. “It’s as simple as just downloading the data into an Amazon S3 bucket,” says Mahardy. “We already had AWS Data Exchange set up, so the purchase was included on a consolidated invoice for all our data purchases that month.”
Along with uploading datasets to AWS using AWS Data Exchange, IMDb provides technical support to licensing customers. “We post the schema, data dictionary, and sample queries—enough for a customer to hit the ground running,” says Sterkel.
Tableau sends the data from IMDb in its Amazon S3 bucket to Tableau Public, where Data + Movies participants can use it to create their visualizations. “We launched Data + Movies on November 6, 2023, and by February 2024, customers had shared 448 visualizations on Tableau Public,” says Mahardy. “Whereas the 80 visualizations uploaded for Data + Music accumulated about 219,000 views in 4 years, the Data + Movies visualizations earned more than 100,000 views in just 3 months.” Anyone can browse the visualizations created by Tableau's global community by visiting the Data + Movies online gallery.
IMDb sees Tableau’s Data + Movies program as an excellent way to illustrate the power of its data. “IMDb is thrilled with the results and the quality of the visualizations,” says Sterkel. “Tableau’s users have gotten very creative.” IMDb has more than 1 billion fan ratings of movies and TV shows, and this data point is a major part of many visualizations, helping Tableau customers showcase different movies’ ratings and compare them. “Tableau is positively impacting customers, and that’s what we’re here to do at the end of the day,” says Sterkel.
Outcome | Promoting Accessible Data Exploration and Fun
Tableau wants to continue promoting its products and its customers’ creativity through additional programs. “Because of our history using AWS, reaching out to IMDb just made sense,” says Mahardy. “It all magically aligned.”
Because of our history using AWS, reaching out to IMDb just made sense. It all magically aligned.
Karen Mahardy
Senior Marketing Manager, TableauAWS Services Used
Did you find what you were looking for today?
Let us know so we can improve the quality of the content on our pages