AWS Developer Tools Blog
A new, more simplified setup for X-Ray tracing of .NET applications
AWS X-Ray is a service that helps developers analyze and debug distributed applications. Customers use X-Ray to monitor application traces, including the performance of calls to other downstream components or services, in either cloud-hosted applications or from their own machines during development. Until now, setting up this trace capability for .NET applications required that customers install a daemon, configure IIS with a trace module and environment variables, and instrument the actual application code with calls to the X-Ray SDK at various locations.
A simpler and more streamlined process is available in beta today. Using a new auto-instrumentation installer, .NET Framework and .NET Core applications targeting IIS can be configured to generate X-Ray traces with zero code changes needed to the application itself. The installer also performs configuration of IIS to inject the tracing module and environment variables. With the installer taking care of the setup and code instrumentation tasks that previously had to be performed manually, customers can start obtaining trace data more quickly and with minimal impact to the application. For issues that arise in production this can mean a faster and easier way to troubleshoot the root cause using X-Ray’s end-to-end view of trace data.
Simplifying application and IIS configuration for tracing isn’t, however, the only new feature. Using the new X-Ray agent, you can now also enable tracing support for Entity Framework (EF) 6, EF Core 6, and SqlClient for .NET Core applications.
To illustrate the benefits of the new installer, let’s first examine how a customer would have previously configured their .NET application running in IIS to generate trace data. X-Ray provides a lot of flexibility in terms of what parts or calls in your applications are traced. Previously, this was done by instrumenting application code with calls to the X-Ray SDK, and setting application configuration options to enable or disable tracing configuration, along with other options to control the tracing. For example, if a customer wanted to trace inbound requests to the application, they needed to add an interceptor. They could also configure tracing of the responses by adding an additional handler. Instrumentation of SQL queries, or calls to other AWS services, could also be configured by adding calls into the X-Ray SDK at application startup. Details of how to do these various tasks for .NET applications can be found in the X-Ray SDK User Guide.
While the changes to instrument an application for X-Ray tracing are relatively simple, they do require customers to modify the application code and dependencies (to include the X-Ray SDK), and configuration. Additionally, when working with IIS, environment variables needed to be set up to configure the profiler inside the IIS environment for .NET Core-based applications, or to add the X-Ray tracing module for .NET Framework-based applications. These steps took time to complete and were all intrusive to the application.
With the launch of the new auto-instrumentation installer, the process of generating traces has become simpler and more convenient. The auto-instrumentation installer can be obtained from GitHub. Note that the installer has a prerequisite dependency on the 64-bit version of the Microsoft Visual C++ Redistributable for Visual Studio 2015, 2017, and 2019. This executable can be downloaded here.
Auto-instrumentation with ASP.NET applications
Let’s use auto-instrumentation to see how we can get a view of trace data for a simple .NET Framework application running under IIS. The sample application can be found on GitHub, and reads and writes to an Amazon DynamoDB table.
Once I have created the DynamoDB table (see the readme file in the sample for instructions), and installed the Visual C++ redistributable, the next step is to install the X-Ray daemon. The instructions for this can be found here.
Finally, we use the new auto-instrumentation installer to configure IIS. After downloading and running the installer, and resetting IIS, we can use the IIS Modules view to see that a new tracing module has been added.

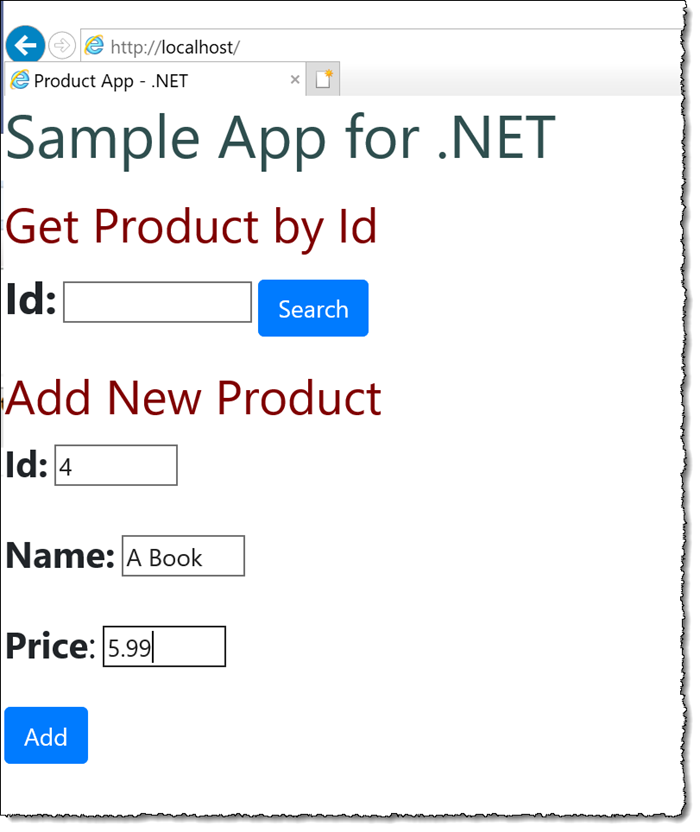
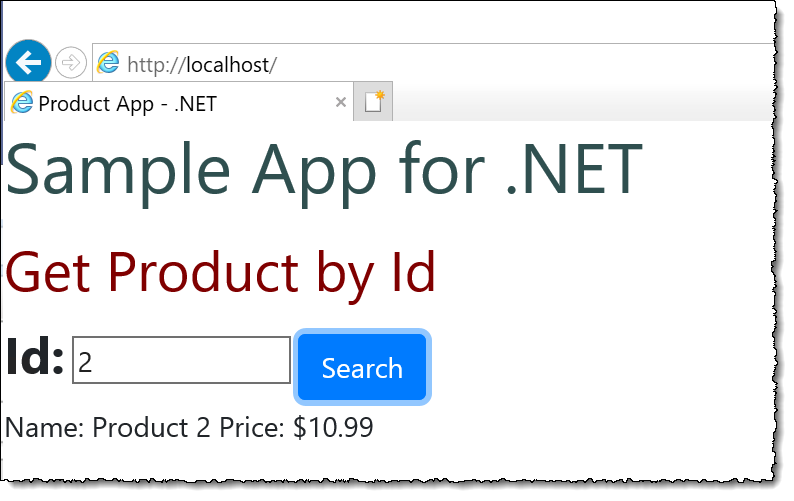
That’s all I need to begin tracing for this application – no code or project changes. Opening a browser and navigating to the sample application site on localhost, we can use the simple interface to add some products to the DynamoDB table, and query for them.
 In the X-Ray console, we can immediately see the application traces that were generated.
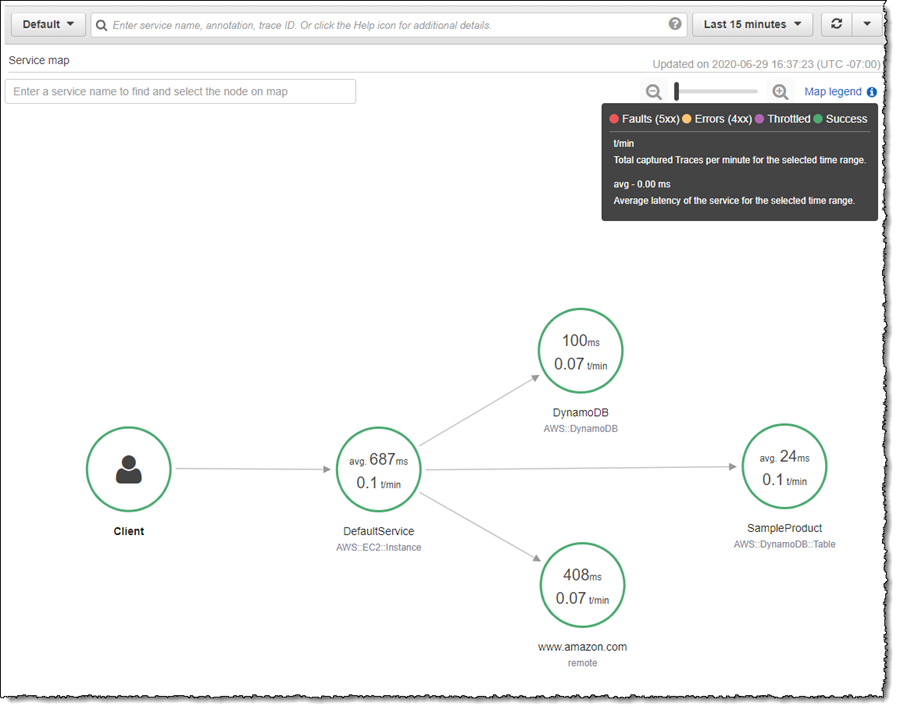
You can see two calls from the web application to DynamoDB (one to write the new product details, the other to query for a product) but notice also the call to www.amazon.com. This is an example of how the agent can conveniently trace downstream HTTP calls that are unrelated to AWS services – again, with no code modification required.
Auto-instrumentation and ASP.NET Core applications
For .NET Core applications running on IIS there is one difference from a setup perspective – a dependency on a NuGet package AWSXRayRecorder.AutoInstrumention needs to be added to the project (a link to download this package can be found in the instructions in the GitHub repository). This step is required so that the profiler can find the tracing SDK to insert when the application is launching. Once that change has been made the auto-instrumentation installer can be run and, just as with ASP.NET applications, there are no code changes required. Note that if you are running ASP.NET and ASP.NET Core applications on the same IIS instance, you only need to run the installer once.
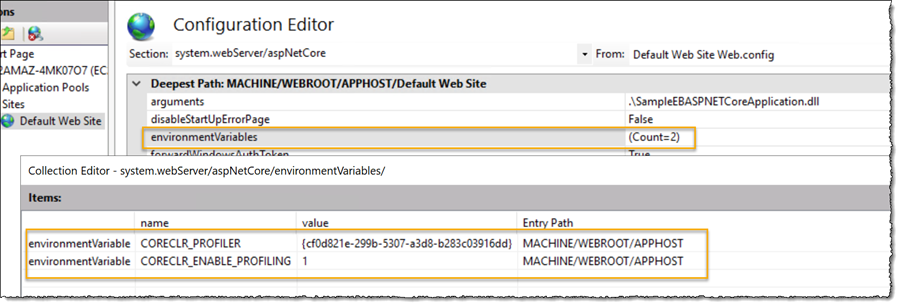
For ASP.NET Core applications the installer configures the profiler using environment variables, which can be viewed in the IIS Configuration Settings editor.
That’s the only difference between the two setups in IIS; ASP.NET applications will be traced using the auto-injected trace module, and ASP.NET Core applications will be traced using the profiler.
Get started with auto-instrumented tracing today!
AWS X-Ray is one item in your toolbox for monitoring .NET applications on AWS. Coupled with additional tools, it can provide a comprehensive view of the health and performance of your .NET applications. In particular, when joined with Amazon CloudWatch Application Insights, you get a very effective pairing for narrowing down the root cause of issues without intrusive application changes. CloudWatch Application Insights helps customers identify and easily setup continuous monitoring of metrics, logs, and alarms for resources hosting applications. The combined pairing of X-Ray with auto-instrumentation together with Application Insights provides a simple to setup up solution for ensuring your .NET and SQL Server applications are running at their peak.
The beta release of the new agent installer is available now and can be downloaded from GitHub. It can be used with applications targeting net45, netstandard2.0, and higher. We’re excited to hear what you think!
-Steve