AWS Architecture Blog
Testing application resilience with Amazon SQS and AWS Fault Injection Service
When your application can no longer send or receive messages through an Amazon Simple Queue Service (Amazon SQS) queue, downstream processing can stall. The cause might be a misconfigured Identity and Access Management (IAM) policy, a network partition, a bad deployment, or a transient service event. Your application sees much the same thing regardless: SQS operations start failing. How your services handle those failures (failing fast on what won’t succeed, opening circuit breakers, buffering on the producer side) can be the difference between a brief disruption and a cascading outage.
If you’ve never tested those mechanisms under failure, you’re relying on assumptions. With AWS Fault Injection Service (AWS FIS), you can find out first. The goal isn’t to verify that SQS works, it’s to learn what your application does when SQS operations fail, and whether you’d notice. A resilience experiment tests your recovery mechanisms and your observability at once.
In this post, you’ll learn how to:
- Structure a resilience experiment with a clear, measurable hypothesis and success criteria.
- Use AWS FIS and AWS Systems Manager (SSM) Automation to simulate progressive access disruption to SQS queues.
- Interpret Amazon CloudWatch metrics to determine whether your resilience mechanisms are working, distinguishing producer-side from consumer-side behavior.
- Identify and fix gaps in your application’s failure handling.
Solution overview
In this experiment, you block your application’s access to SQS with a scoped deny resource policy, then restore access and observe recovery. The policy you apply rejects the data-plane operations your application depends on (sending, receiving, deleting, and changing message visibility, plus purging) while leaving queue management untouched. Disruption duration increases across four phases to surface different classes of failure. To learn more, see Control planes and data planes.
Important: Don’t deny
sqs:*. In IAM policy evaluation, an explicit Deny overrides every Allow, including the automation’s own permission to remove the policy later. A deny coveringsqs:SetQueueAttributes,sqs:AddPermission, andsqs:RemovePermissioncan lock the queue so that even the role that applied it can’t clean it up. Scope the deny to data-plane actions only. See Configuring the experiment for the safe policy shape, SQS troubleshooting: access denied, and this re:Post article on deny-policy lockout.
You can find the fault-injection code (the SSM Automation document, the FIS experiment template, and example IAM policies for both roles) in the FIS template library on GitHub.
Progressive experiment phases
Short disruptions can reveal whether your failure-handling mechanisms activate. Longer ones can expose systemic issues that might only appear under sustained failure.
Note: This experiment tests your application’s resilience patterns, not SQS itself. The scoped deny simulates what your application would experience during a network partition, a permission change, or another access disruption.
You can watch two distinct failure surfaces at once:
Producer side: The component that calls SendMessage. When sends are denied, you’re testing how the producer handles failed enqueues: does it fail fast, open a circuit breaker, buffer locally, or drop messages?
Consumer side: The component that calls ReceiveMessage and DeleteMessage. When receives are denied, you’re testing backlog growth during the outage and, on recovery, redelivery and whether a consumer working through the accumulated backlog keeps up or starts pushing messages toward the DLQ.
To isolate a consumer outage instead, where a bad deployment or scaling issue stops your consumers while producers keep sending, deny only sqs:ReceiveMessage and sqs:DeleteMessage. This can be done by editing the SSM Automation document.
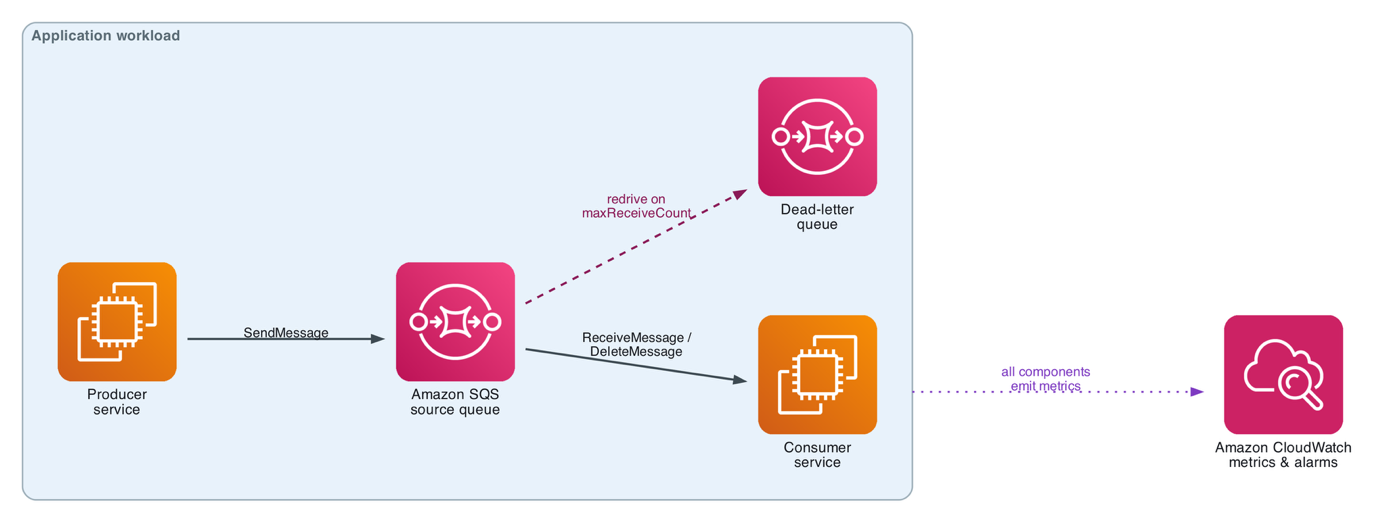
Architecture diagram: producer service → SQS queue → consumer service, with a dead letter queue attached to the source queue and CloudWatch collecting metrics from the producer, the consumer, and both queues.
A note on the example workload. The behaviors here (circuit breakers, local buffering, thread pools) assume long-running producer and consumer services rather than short-lived Lambda invocations.
Define your hypothesis
Start with one question: can you reason about what your system should do when SQS access disappears? That question, not whether this is your first experiment, determines what kind of hypothesis you write.
If you can, state the expectation and the metrics you’ll judge it by: When our application loses access to SQS for [duration], we expect [specific, observable behavior]. Our system will [recovery expectation] within [time] of access being restored, as measured by [metric(s)].
A team with resilience patterns already in place might write: When our order processing application loses access to SQS for 5 minutes, we expect the producer to open its circuit breaker within 30 seconds, fail fast, and buffer messages in local durable storage rather than dropping them. On recovery it will replay the buffer and return to normal processing rates within 2 minutes, as measured by NumberOfMessagesSent returning to baseline and ApproximateNumberOfMessagesVisible draining to near zero within 15 minutes.
If this is your first test or this failure mode has never been exercised, that isn’t a prerequisite. You don’t necessarily need to read the code and settings first, though a basic understanding of the implementation and its normal load helps you set guardrails that bound the test’s impact. Frame the hypothesis as discovery, stating what you’ll observe instead of what you predict:
Our order processing application has never been tested under SQS access loss. We’ll block access for 2 minutes and observe how the producer handles failed sends and whether the consumer recovers unaided, as measured by NumberOfMessagesSent, ApproximateNumberOfMessagesVisible, ApproximateAgeOfOldestMessage, and application error rates.
Either way, write it down before you proceed. The gaps between what you wrote and what happens are where your system needs work.
Prerequisites
The GitHub repo ships working examples. The following bullets note which file to start from. You’ll need:
- An instrumented producer and consumer: the application under test. This is the one prerequisite with no example in the repo. The library ships the fault injection, not the workload. The observation tables in this post assume your application emits circuit-breaker state, failed-send and dropped-message counters, fallback-store writes, and duplicate-processing metrics. Without that instrumentation you’ll watch the queue metrics move and learn little about your application.
- An IAM role for AWS FIS, trusted by
fis.amazonaws.comand able to run the SSM Automation document (ssm:StartAutomationExecutionand related, plusiam:PassRole). The repo provides both pieces:sqs-queue-impairment-tag-based-fis-role-iam-policy.jsonfor the permissions andfis-iam-trust-relationship.jsonfor the trust policy. Add the Amazon CloudWatch Logs permissions only if you enable experiment logging. See Logging for AWS FIS. - An IAM role for the SSM Automation document, able to read and modify the target queues’ policies (
sqs:GetQueueAttributes,sqs:SetQueueAttributes,sqs:ListQueues,sqs:ListQueueTags). Start fromsqs-queue-impairment-tag-based-ssm-automation-role-iam-policy.jsonandssm-iam-trust-relationship.jsonin the repo. The example policy conditions the write onaws:ResourceTag/FIS-Ready, which helps prevent the automation from touching untagged queues. Keep that condition. - SQS queues tagged
FIS-Ready: True. This scopes which queues the automation targets. Tag only non-production queues or use planned test windows. - A CloudWatch dashboard and alarms combining those application metrics with the queue metrics across the producer, consumer, and queue (see Monitoring strategy). The repo’s README includes an example
put-metric-alarmcommand for a customer-impact alarm you can adapt as your stop condition. - A documented rollback plan in case the automation can’t remove the deny policy (if a deny ever locks out queue management, see the re:Post article on deny-policy lockout).
Important: Run these experiments in a non-production environment first. In production, confirm you have change management approvals.
Configuring the experiment
AWS Systems Manager Automation applies and removes the deny policy; AWS FIS orchestrates the sequence.
Systems Manager Automation document
The SSM Automation document follows four steps:
- getTargetQueues: finds SQS queues tagged with
FIS-Ready: True. It callsListQueuesonce, which returns at most 1,000 queue URLs, so in an account with more queues than that, add pagination or aQueueNamePrefixfilter before you rely on it to find every tagged queue. - applyDenyAllPolicyToQueues: adds a scoped deny statement to each queue’s resource policy. Deny only the data-plane actions your application uses, never the management actions, so the automation can remove its own statement during cleanup. If you adapt the automation, consider adding a validation step that refuses to apply any deny covering management actions. A lockout would then require changing both the policy and the validation.
Tip: You can make the deny self-expiring by adding a
DateLessThancondition onaws:CurrentTimeto the statement, so the deny stops applying at a set time even if the cleanup step never runs. See IAM condition operators for date and time.
- waitForDuration: sleeps for the specified impairment duration (ISO 8601 format, for example
PT2M). - removeDenyAllPolicyFromQueues: removes the
FISTemporaryDenystatement, restoring normal access. The document routesonFailureandonCancelto this step so that an aborted run attempts to clean up, and the step raises if it can’t restore a policy rather than reporting success.
Choose your blast radius with Principal. "Principal": "*" denies the data plane to every caller: the application under test, but also any admin, canary, or other consumer of that queue. That faithfully simulates a service partition, but on a shared queue it impairs more than your app. To impair only the application, the more common “my app lost access” case, scope the deny to its IAM role:
A role arn matches all sessions of that role, catching the app’s calls without applying the deny to other callers. On a shared queue, a principal-scoped deny also changes what you measure: queue-level metrics blend impaired and healthy traffic, so lean on your application’s client-side metrics and read recovery as a return to pre-event levels rather than to zero and back. Set the automation’s optional targetPrincipalArn parameter to scope the deny to one principal, or leave it empty to deny all. The rest of this post assumes the full-queue deny ("Principal": "*").
FIS experiment template
The FIS template chains the four impairment phases with recovery periods between each, calling the SSM Automation document with an increasing duration; startAfter fields enforce sequential execution. The escalation is the point. You watch cause and effect at increasing severity:
| Phase | Duration | What this duration tends to surface |
| Impair 1 | 2 minutes | Fail-fast behavior and circuit-breaker activation |
| Recover | 3 minutes | Buffered messages replay. Metrics return to baseline |
| Impair 2 | 5 minutes | Backlog accumulation as the queue fills undrained |
| Recover | 3 minutes | Backlog burndown |
| Impair 3 | 7 minutes | Thread-pool and memory pressure from sustained failure |
| Recover | 2 minutes | Recovery under a larger backlog. Whether the consumer keeps up |
| Impair 4 | 15 minutes | Systemic limits under prolonged loss of access |
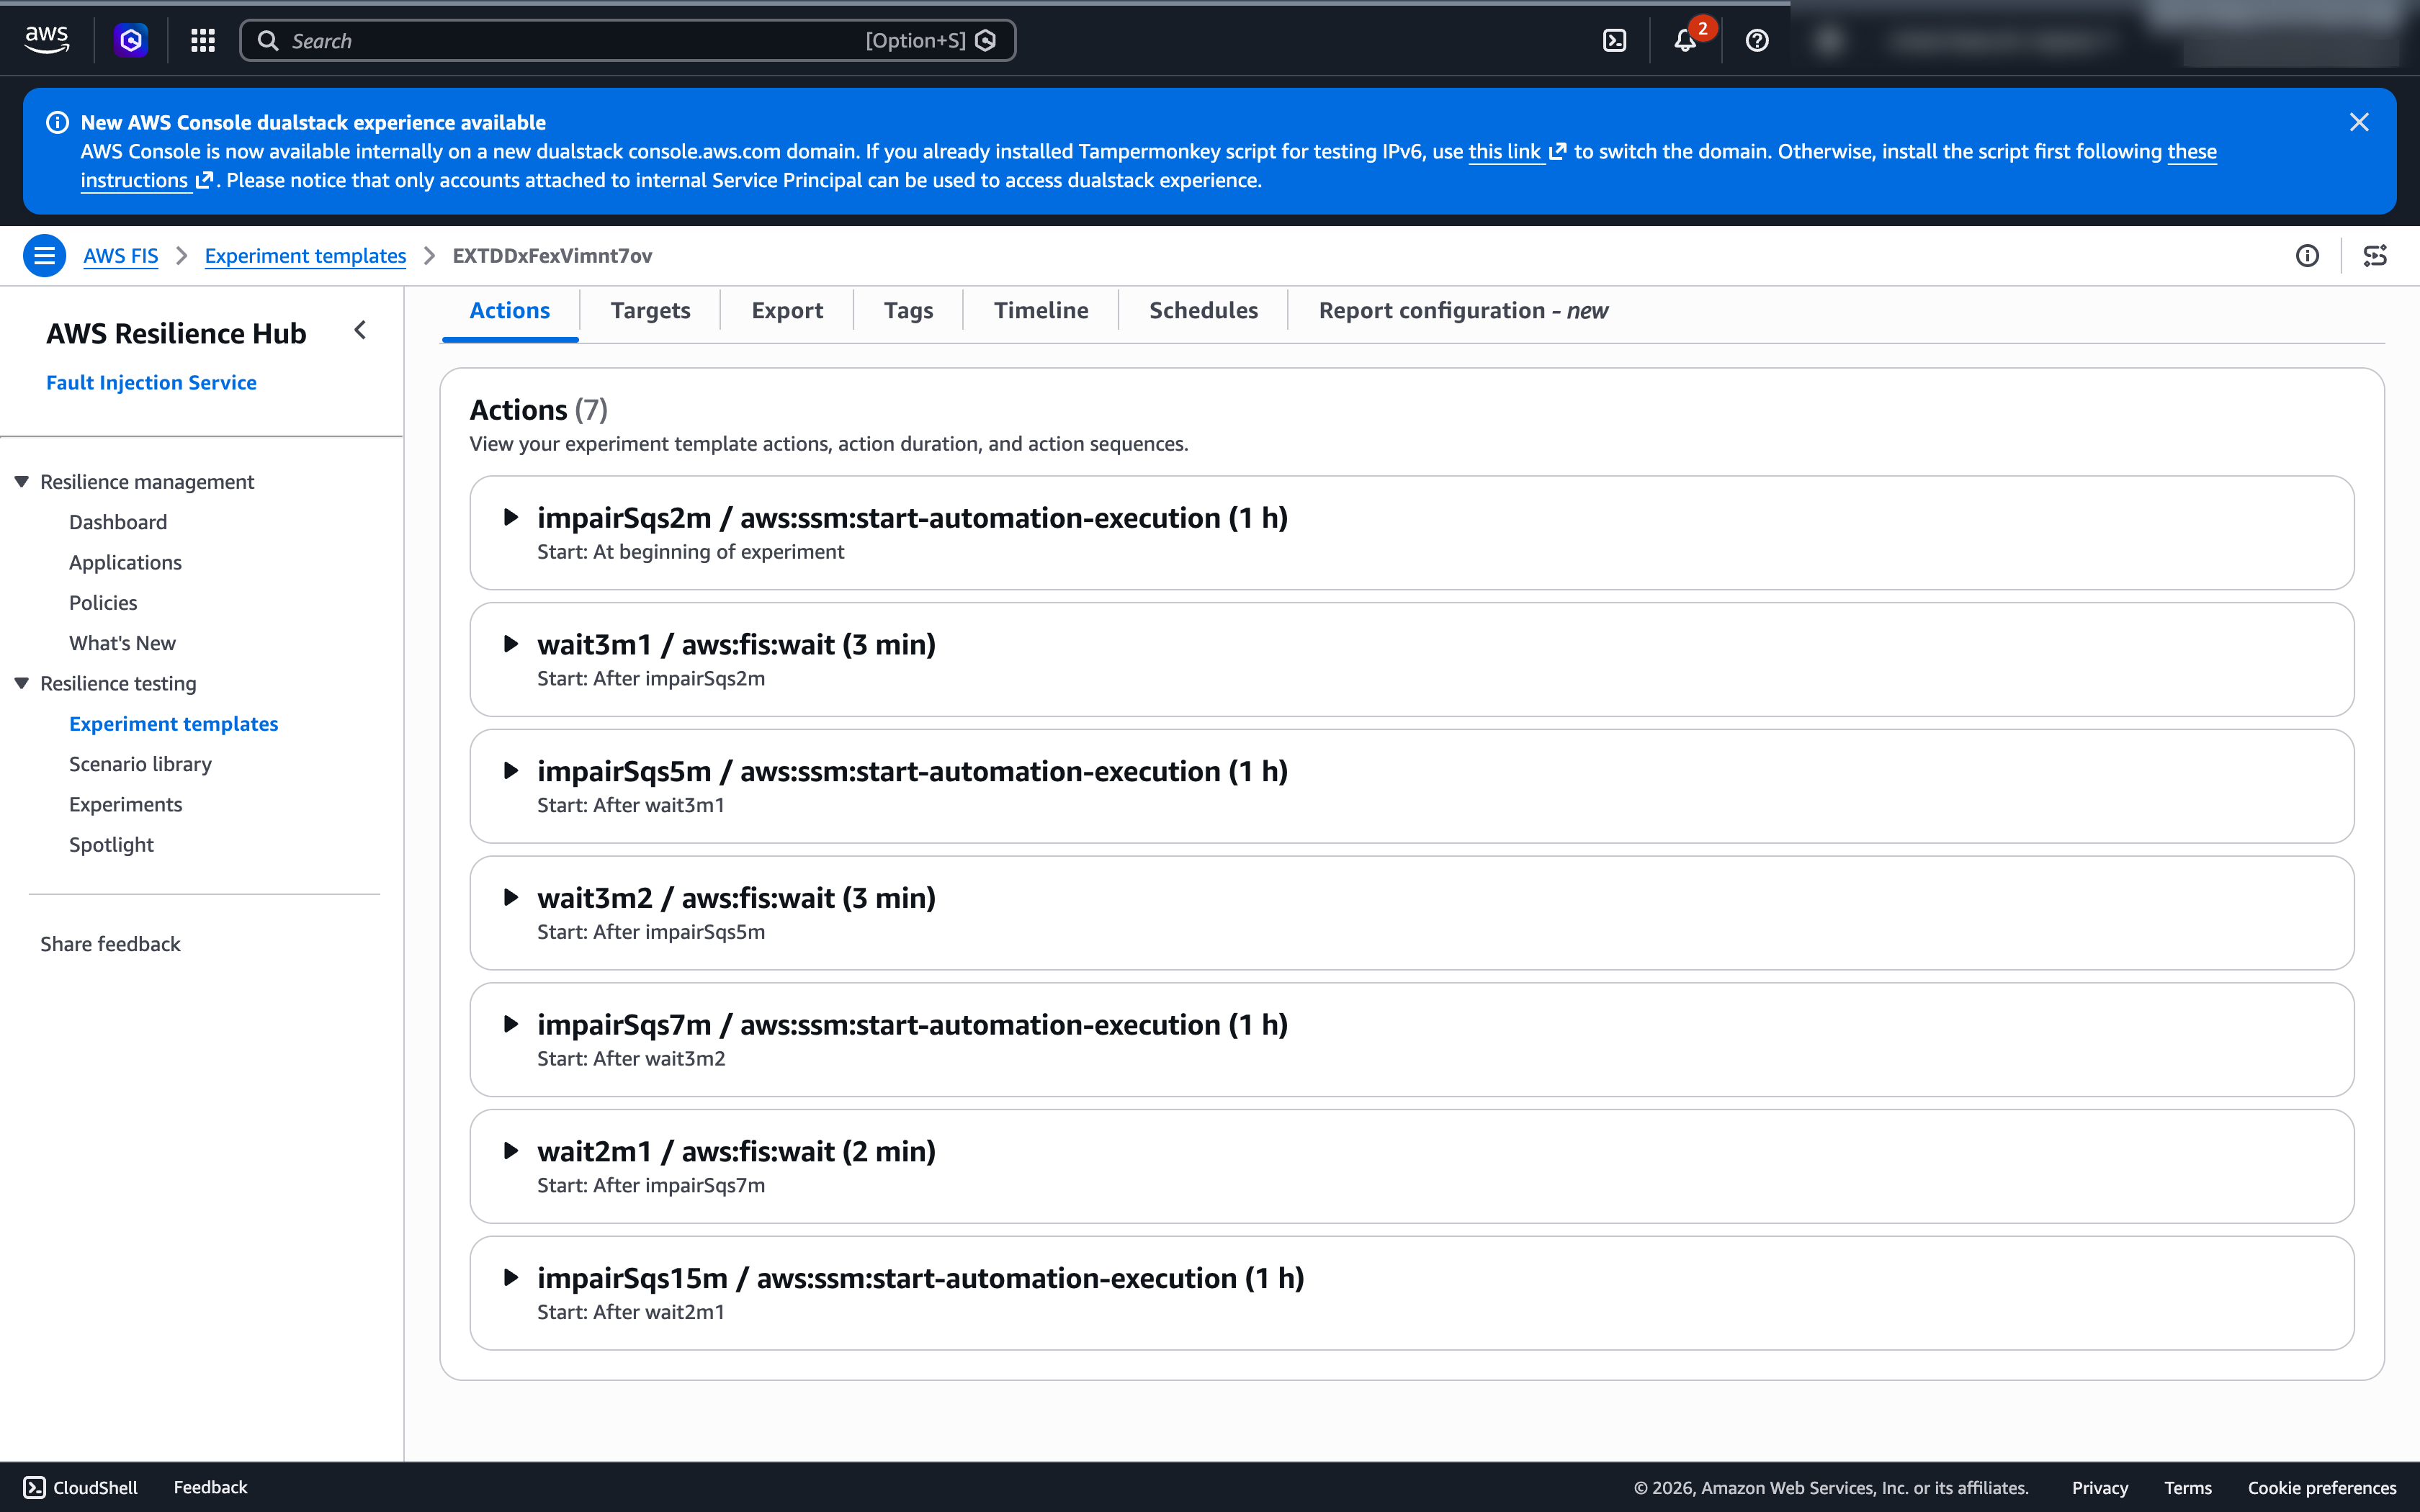
Figure: The FIS experiment template: four impairment actions (2, 5, 7, and 15 minutes) chained with recovery waits between them.
Stop conditions. A stop condition halts the experiment automatically if a specified CloudWatch alarm fires, an essential control for an escalating experiment. A triggered stop condition also unwinds what it can: FIS cancels the run, and the automation’s onCancel step removes the deny, restoring access. That rollback is a property of this experiment’s design, not of stop conditions in general: an action like EC2 instance termination does not support rollback, so check each action’s rollback behavior before relying on a stop condition to help limit damage. The library template ships with "stopConditions": [{"source":"none"}], because the right alarm depends on health signals the template can’t assume.
Metric choice matters: alarming on a queue metric like ApproximateAgeOfOldestMessage or NumberOfMessagesSent would be incorrect, as those are supposed to move during impairment. So, the alarm would trip in the first 2-minute phase and abort the run before the longer phases surface anything interesting. You’d be alarming on the effect you’re injecting.
Instead, tie the stop condition to a signal that should stay healthy if your resilience mechanisms are working. This would reflect real customer impact. If that signal degrades more than you’ll tolerate (error rates that don’t recover within the 2 minutes your hypothesis allows), your resilience has already failed and continuing risks further customer impact. Some metrics to consider alarming on:
- An application error rate or transaction-success metric (a custom CloudWatch metric your app emits, for example failed orders per minute), the most direct measure of customer impact and independent of the SQS metrics you’re perturbing.
- Load balancer 5xx count or target response time (for example
HTTPCode_Target_5XX_Counton an Application Load Balancer), a good proxy when you don’t yet emit a business metric. - DLQ depth:
ApproximateNumberOfMessagesVisibleon the dead-letter queue crossing a threshold, which signals messages are failing permanently rather than only backing up recoverably.
See Stop conditions for AWS FIS for more information.
Deriving the threshold from your hypothesis. The preceding hypothesis expects recovery within 2 minutes of access being restored. That number is also your alarm. If failed orders per minute is your customer-impact metric and its baseline is near zero, set the alarm to failed orders per minute > 10 for 2 consecutive 1-minute periods: long enough that a spike while the circuit breaker opens shouldn’t abort the run, short enough that failing to recover inside your hypothesis window stops it. Design the alarm for how the metric behaves during failure rather than for the test: when the circuit breaker opens, a low-volume custom metric might stop emitting data points entirely. Tighten it as you approach production.
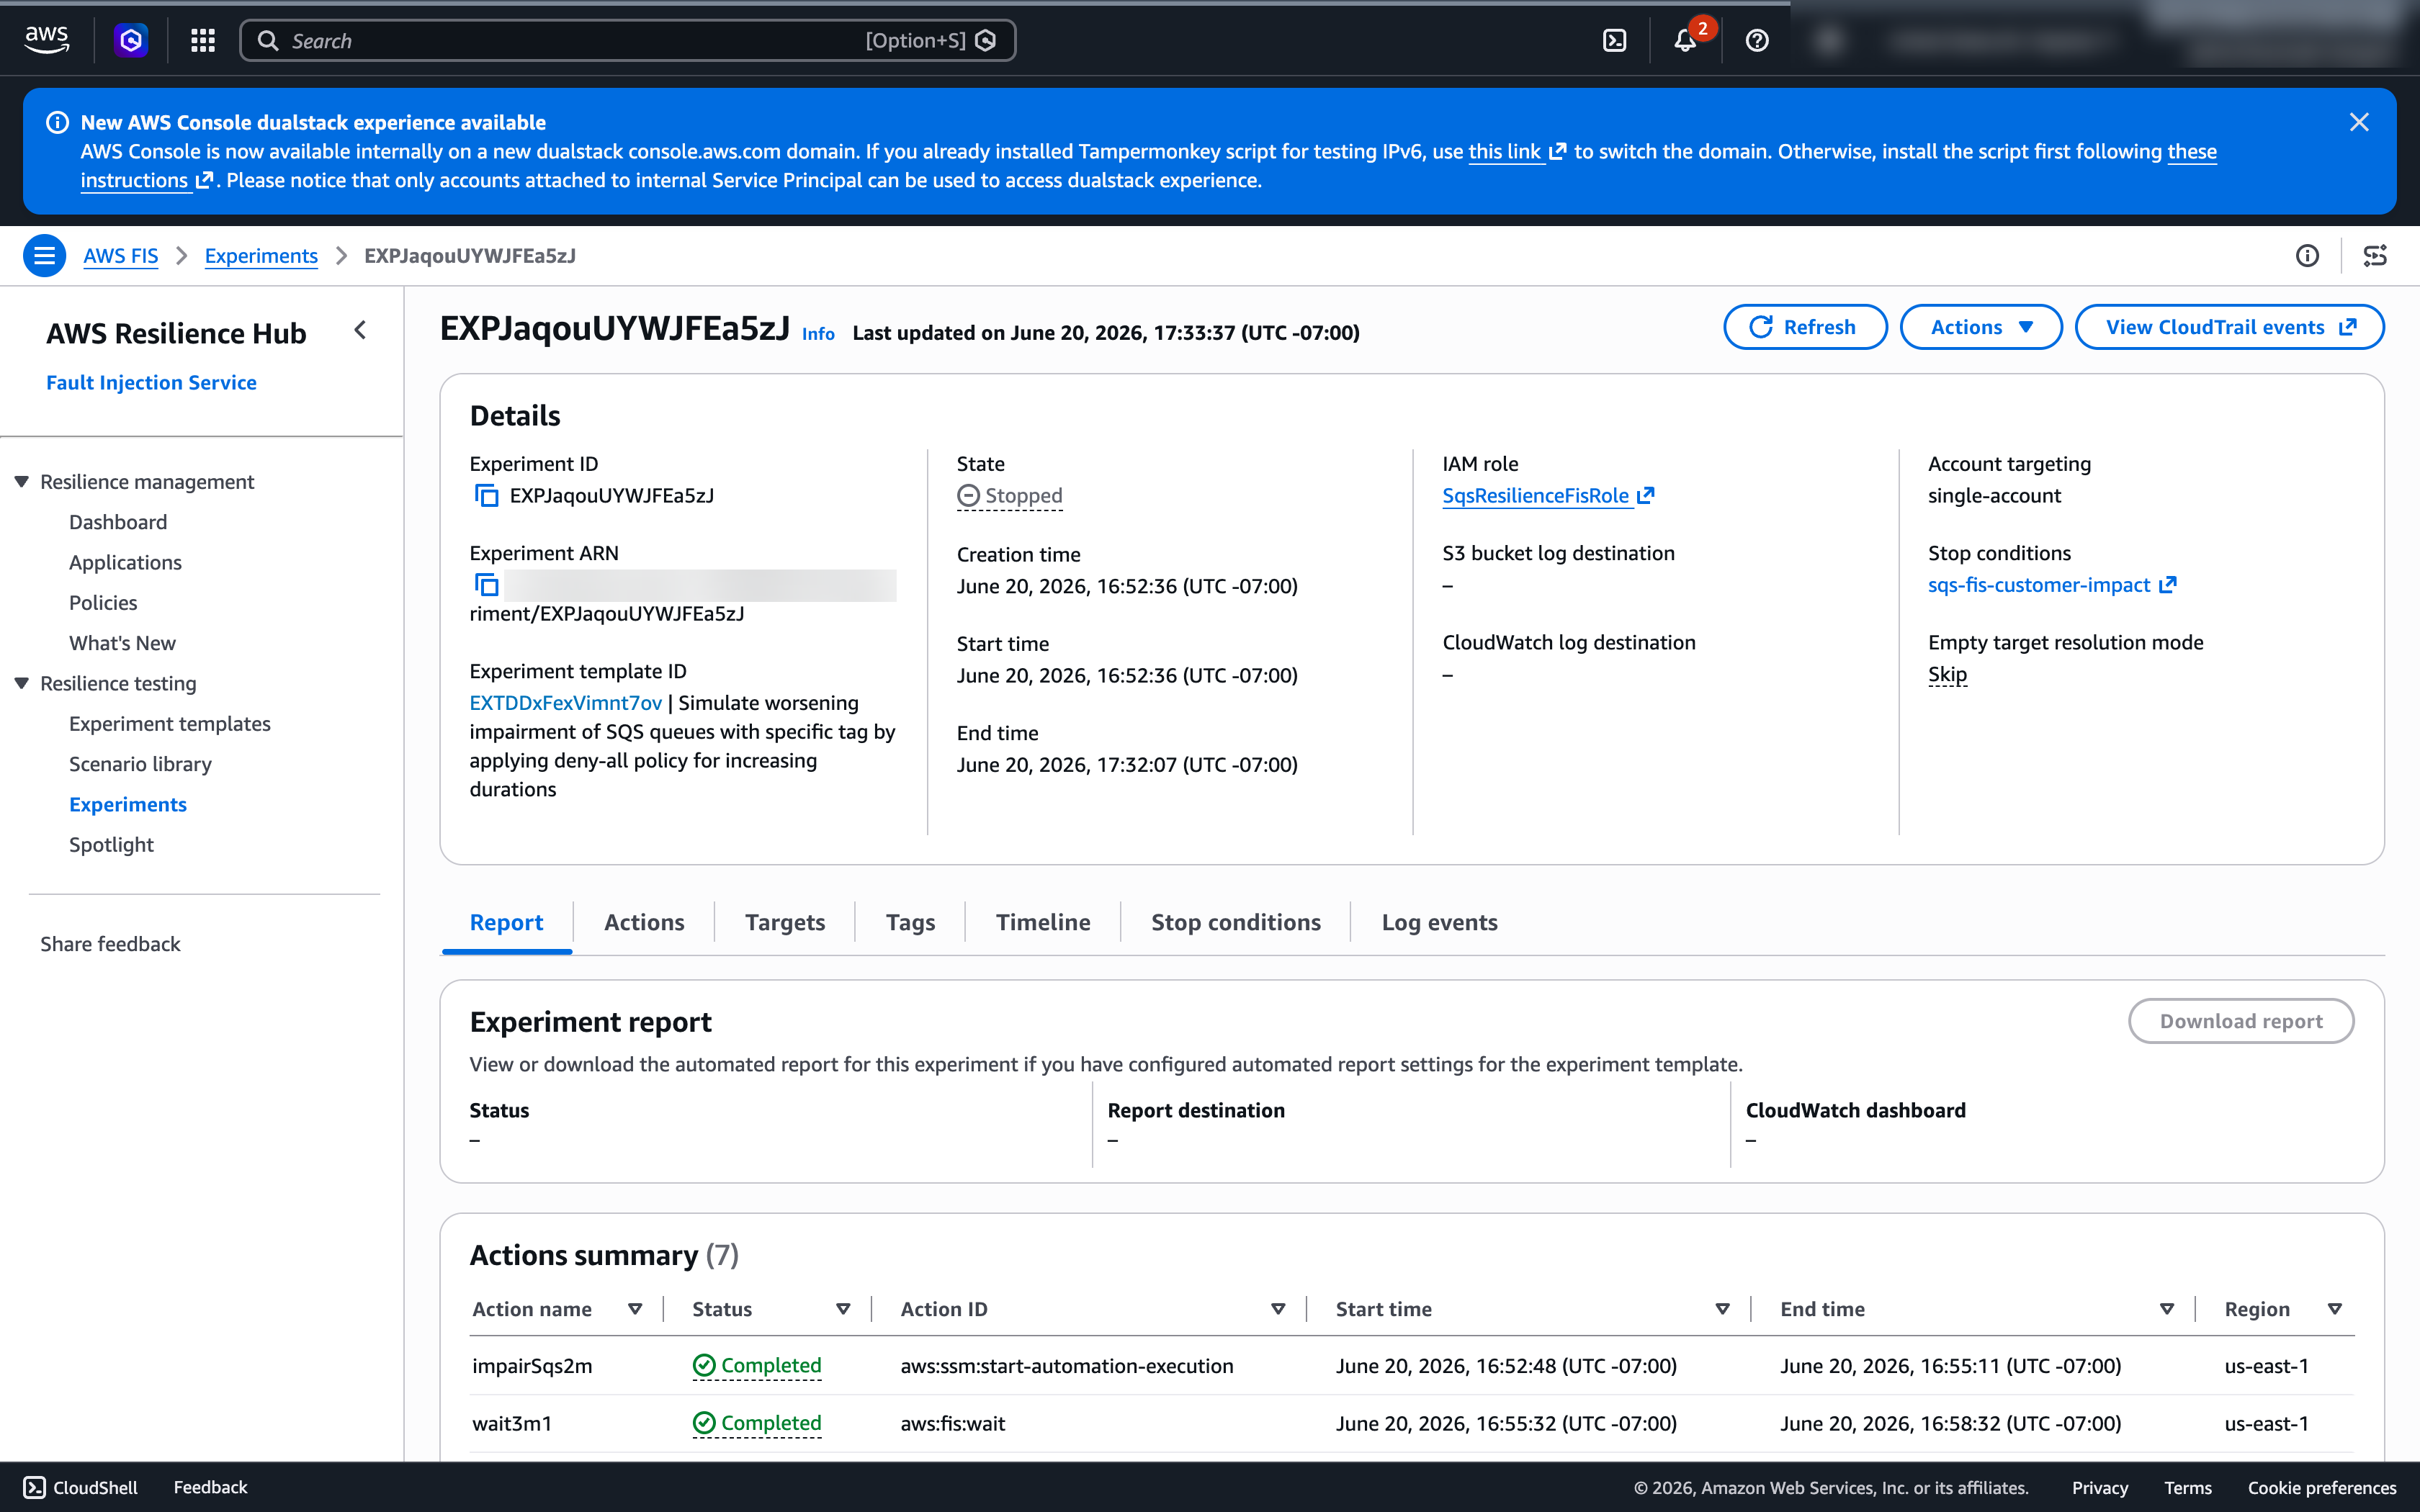
Figure: When the customer-impact alarm breached, AWS FIS halted the experiment automatically (State: Stopped)
Running the experiment
To start the experiment with AWS FIS you can use the console or the AWS CLI:
What to observe during impairment
During each phase, SQS operations return AccessDenied errors. Note what that does and doesn’t exercise: a 403 is non-retryable, so this experiment validates that your code recognizes it and stops, not your backoff path. To exercise retries and backoff, inject a retryable fault such as throttling or timeouts. The producer and the consumer fail differently, so watch them separately.
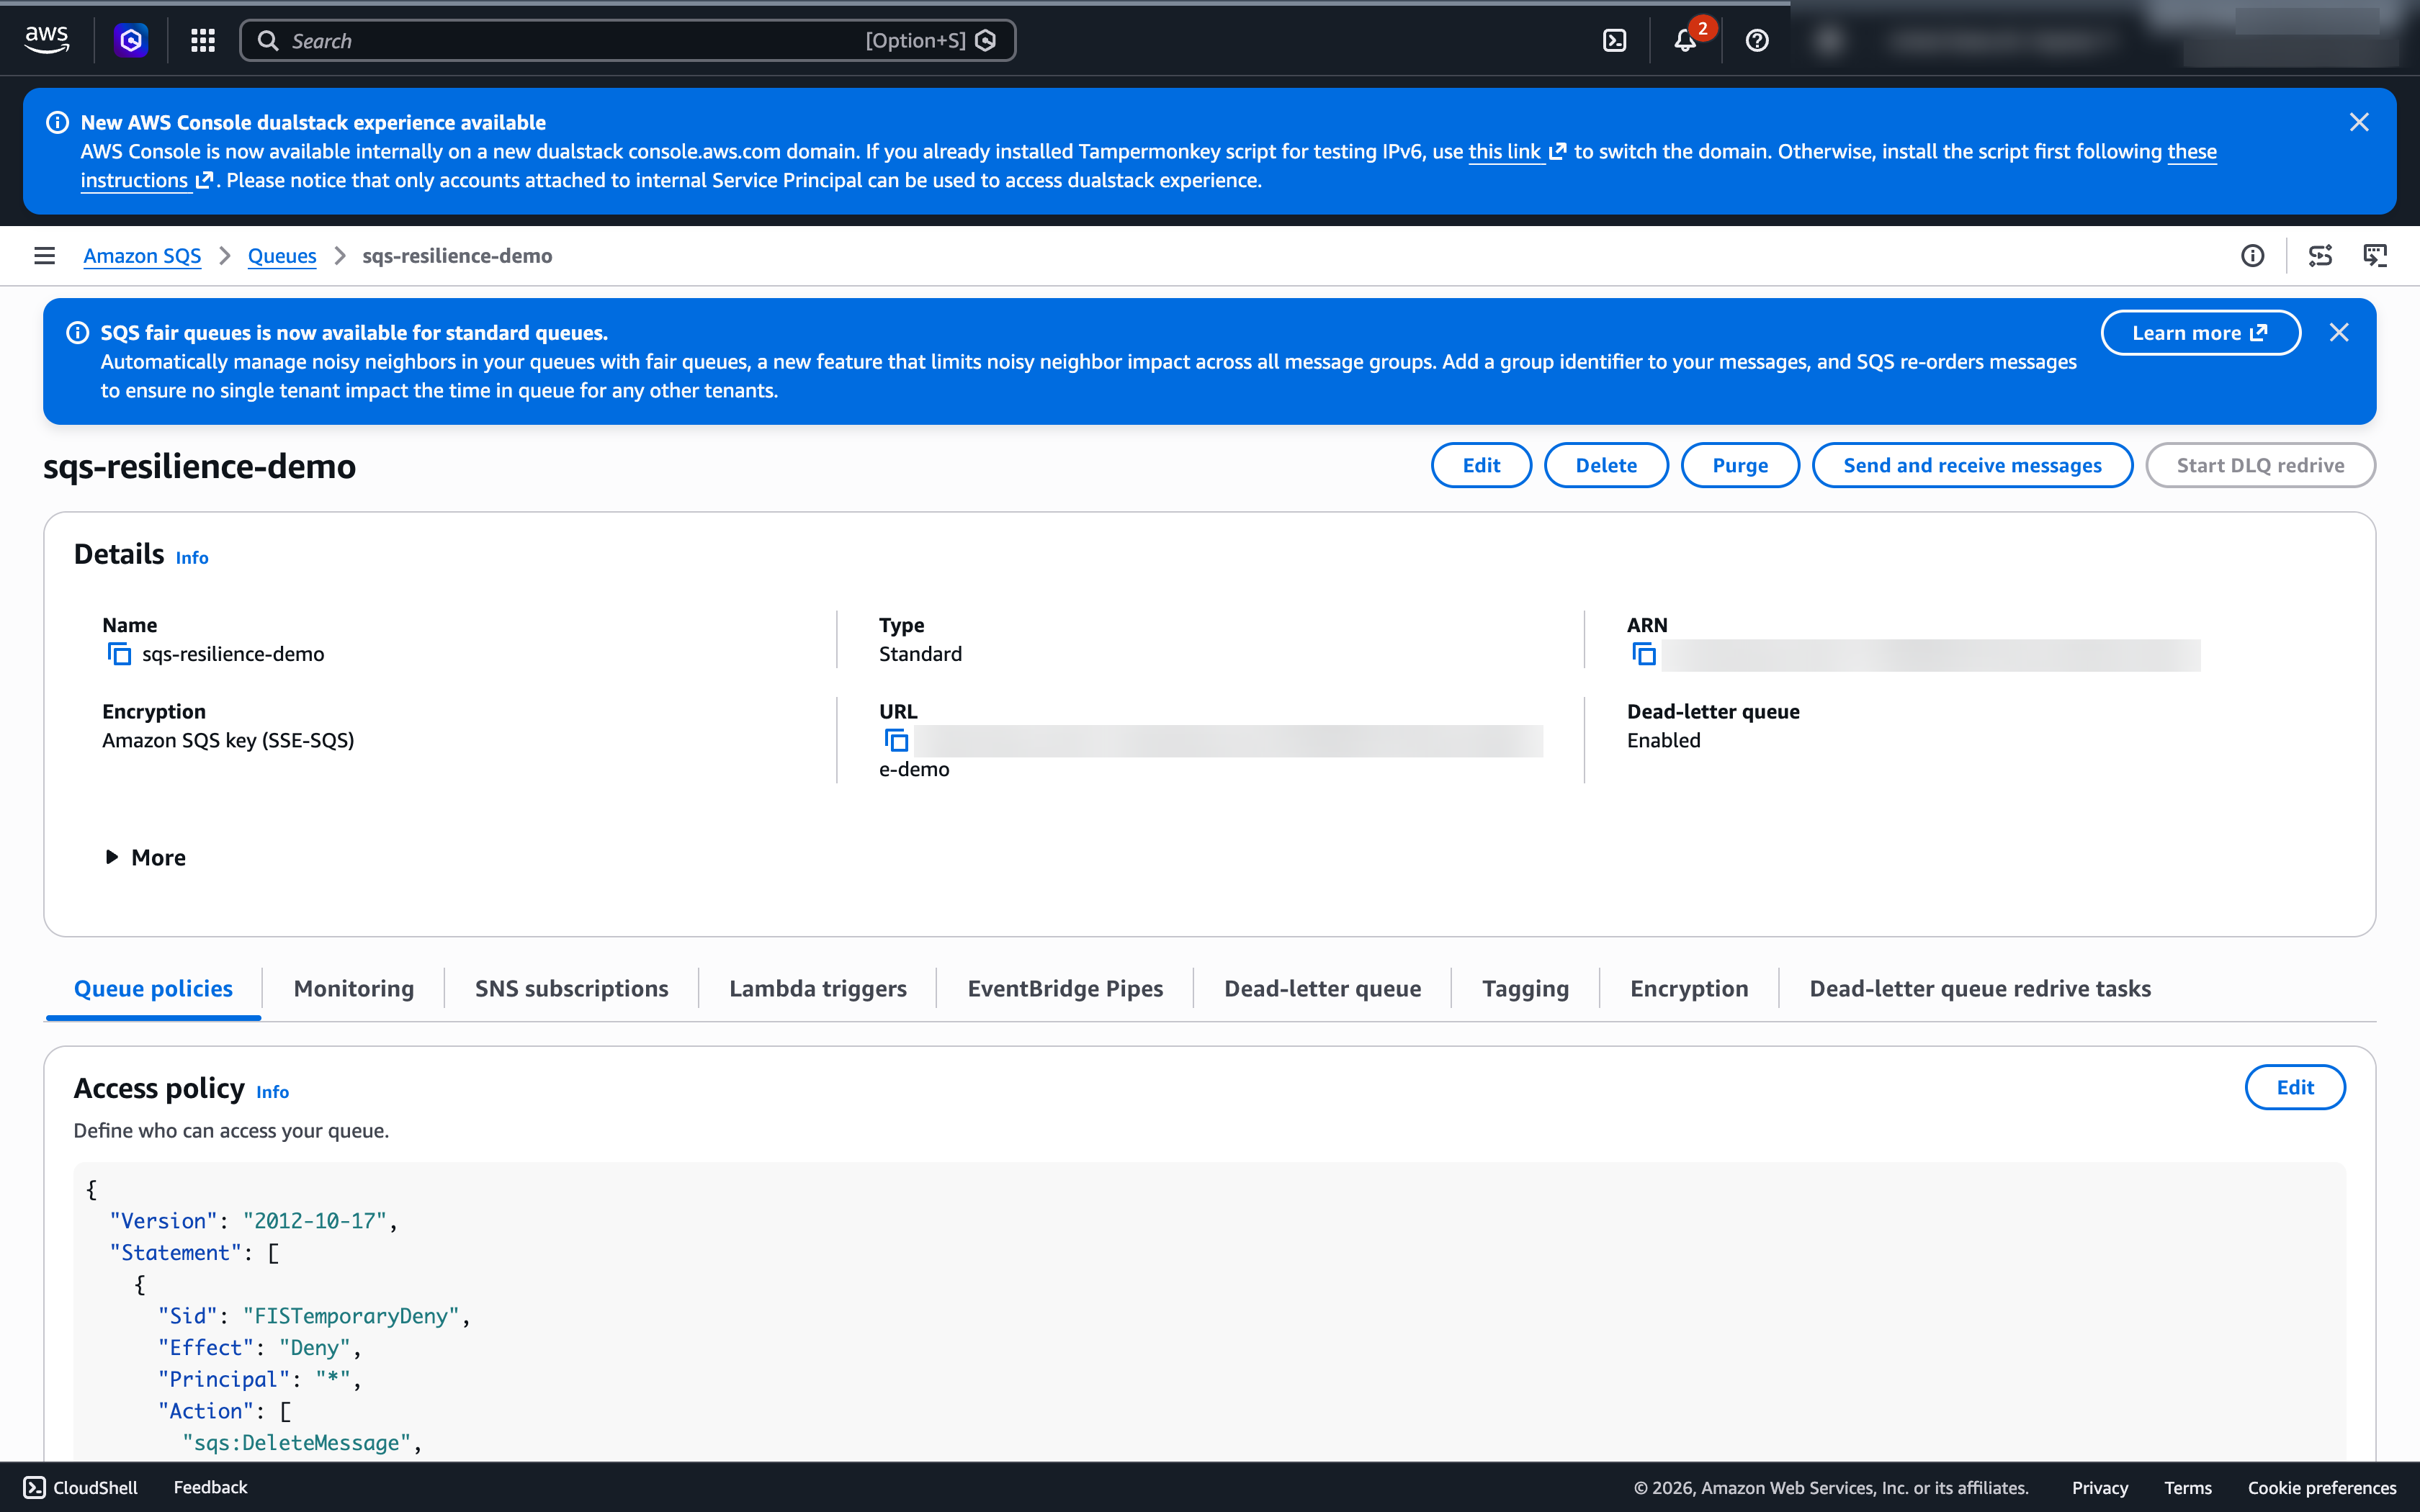
Figure: During impairment, the queue’s access policy carries the scoped FISTemporaryDeny statement; SendMessage and ReceiveMessage return AccessDenied while management actions still work.
Producer side (the component calling SendMessage):
| Stage | Healthy response | Unhealthy response | Signal to watch |
First failed SendMessage |
Recognizes AccessDenied and fails fast | Crashes, hangs, or blocks the calling thread | NumberOfMessagesSent drops to ~0. Producer error rate rises |
| After 3 to 5 consecutive failures | Circuit breaker opens. Sheds or buffers load | Continues retrying indefinitely | Circuit-breaker state metric. Producer CPU / threads / connections |
| Send gives up (non-retryable error, or retry budget exhausted) | Fails fast and persists the payload to durable fallback storage, or alerts, does not silently drop | Drops the message silently (permanent loss) | Producer “failed send / dropped” counter. Fallback-store writes |
| Application state | Stays responsive. Degrades gracefully | Returns 500s to callers. Unbounded in-memory queueing | Producer health checks, request latency |
| Resource usage | Bounded by backoff and circuit breaker | CPU/memory/connections climb (tight retry loops) | Producer CPU, memory, connection-pool usage |
Note: a producer that gives up on a send does not route anything to the DLQ.
Consumer side (the component calling ReceiveMessage / DeleteMessage):
| Stage | Healthy response | Unhealthy response | Signal to watch |
First failed ReceiveMessage / DeleteMessage |
Backs off its poll loop rather than hammering. Any in-flight message returns to the queue after the visibility timeout | Crashes or hangs the consumer loop | NumberOfMessagesReceived / NumberOfMessagesDeleted drop |
| Backlog accumulates (consumers can’t drain) | Backlog alarm fires. Scaling responds if keyed to queue depth (for example, backlog per worker) | Backlog grows unbounded. Consumers idle-loop | ApproximateNumberOfMessagesVisible stops draining (goes flat or climbs); ApproximateAgeOfOldestMessage climbs |
| Application state | Idempotent processing. Safe to retry | Duplicate side effects on redelivery | Downstream idempotency / duplicate-write metrics |
| Resource usage | Bounded by visibility timeout and backoff | In-flight messages pile up. Consumer saturation | ApproximateNumberOfMessagesNotVisible. Consumer CPU/memory |
Don’t expect the DLQ to fill during impairment. Redrive is driven by
maxReceiveCount: a message moves to the DLQ only after a consumer has received it that many times without deleting it. WithReceiveMessagedenied, nothing is delivered, the receive count doesn’t increment, and nothing redrives. The DLQ depends on the very call that’s blocked, so it’s something to watch for during recovery, not during the outage.
Key CloudWatch metrics, and how to read them:
NumberOfMessagesSent: drops to zero when the deny policy takes effect and producers can no longer enqueue.
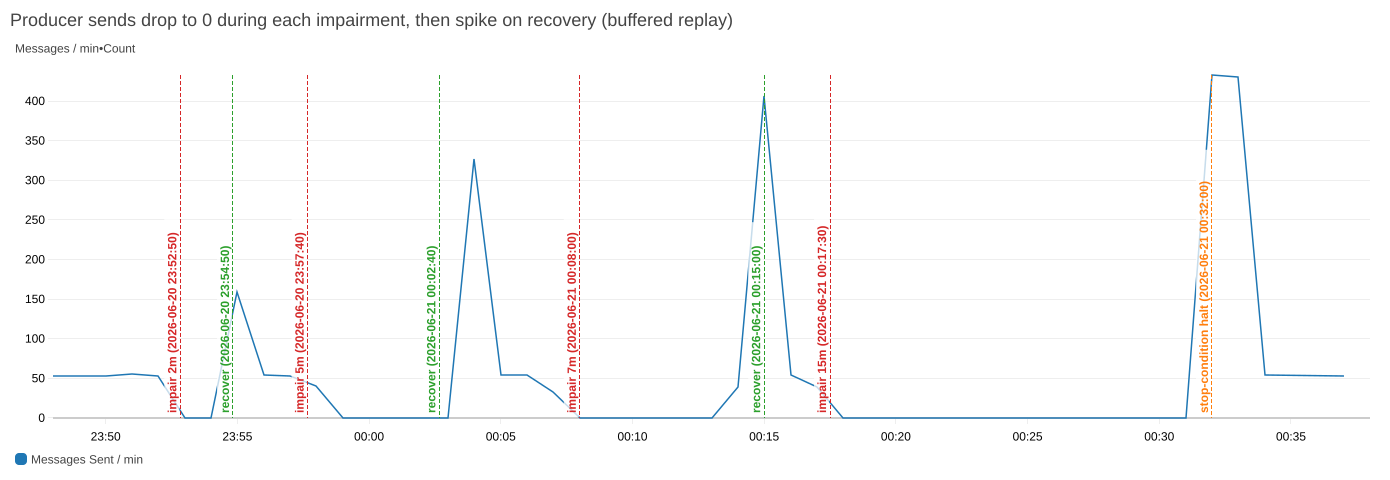
Figure: NumberOfMessagesSent drops to zero during every impairment window (red) and spikes on recovery (green) as buffered messages replay. The final phase ends at the stop-condition halt (orange).
ApproximateNumberOfMessagesVisible: the current backlog of messages available for retrieval. During impairment this often stops changing, a signal that tells you something is wrong precisely because it goes flat (nothing is being sent or drained).ApproximateAgeOfOldestMessage: increases as unprocessed messages age, but only if the queue already held a message when the deny took effect. On an empty queue it won’t climb, which is why you read it alongside the visible-message count.
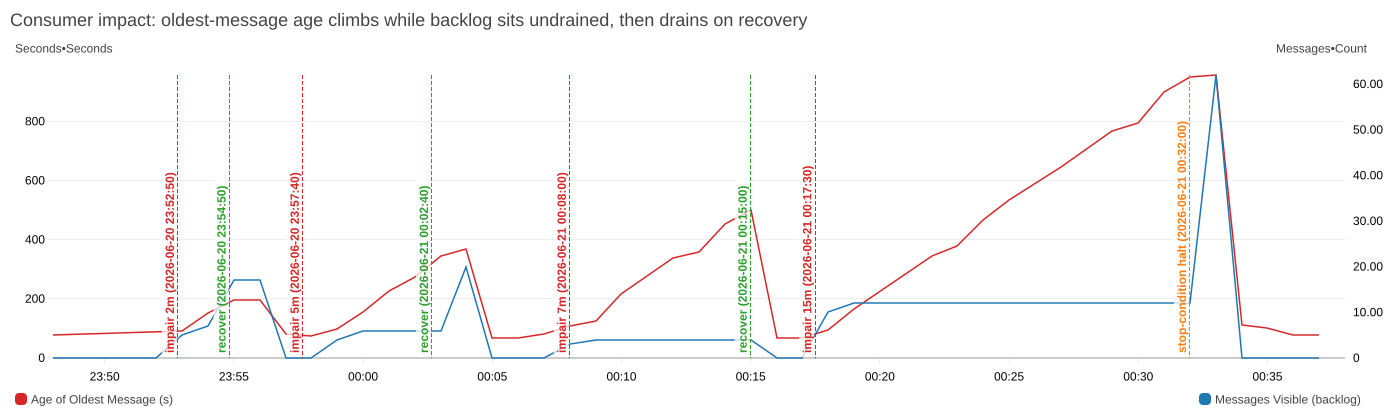
Figure: Consumer-side impact: ApproximateAgeOfOldestMessage climbs while the visible backlog sits undrained during the 15-minute phase, then both collapse the moment access is restored.
Application error rate: spikes initially, then stabilizes if circuit breakers engage.
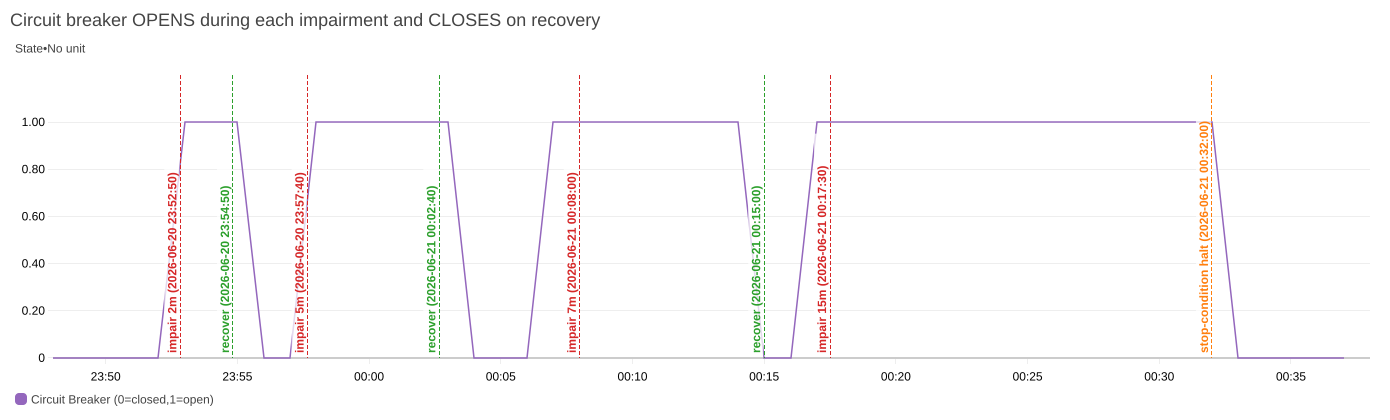
Figure: The producer’s circuit breaker opens (1) within seconds of each impairment and closes (0) on recovery, a clean square wave that lags each fault window slightly because it opens only after a few sustained failures.
Count-based metrics (
NumberOfMessagesSent/Received/Deleted) reflect system-level activity and can include retries and duplicates, so treat them as trend indicators rather than exact unique-message counts.
What to observe during recovery
When the deny policy is removed, the producer and consumer recover on different timelines.
Producer side:
| What to observe | Healthy response | Unhealthy response |
| Send resumes | NumberOfMessagesSent climbs back to baseline. Circuit breaker half-opens, then closes within ~30 seconds |
Circuit breaker stays open (stale failure state). Manual restart needed |
| Buffered / fallback payloads | Replayed from durable fallback storage and re-sent idempotently | Lost permanently (if silently dropped during impairment) |
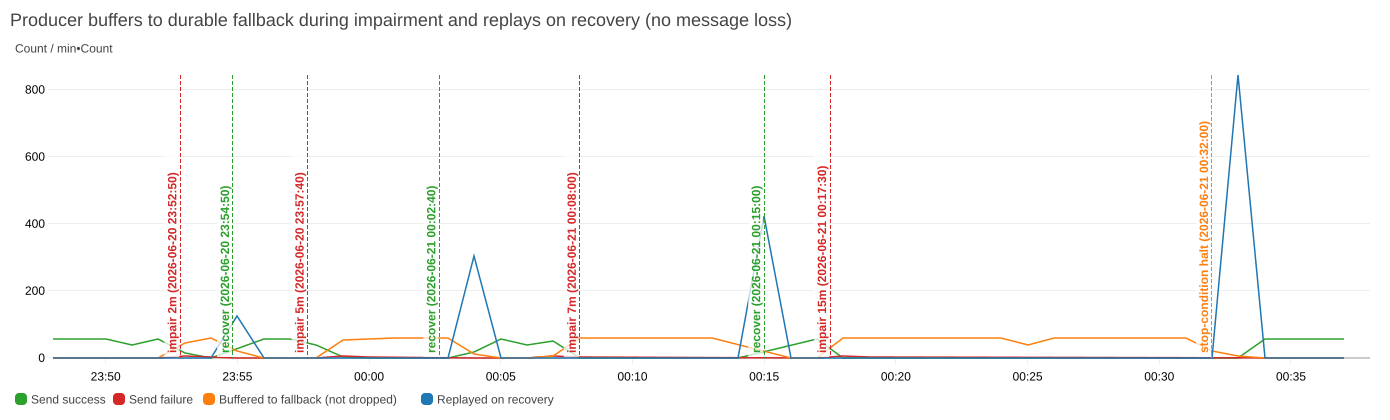
Figure: The producer buffers to durable fallback storage during impairment (no dropped messages) and replays the buffer on recovery: send success, buffered writes, and replays over the run.
Consumer side:
| What to observe | Healthy response | Unhealthy response |
| Receive / delete resumes | NumberOfMessagesReceived / NumberOfMessagesDeleted recover |
Consumers stay wedged. No auto-recovery |
| Backlog burndown | ApproximateNumberOfMessagesVisible drains steadily; ApproximateAgeOfOldestMessage falls |
Drain stalls: the rate spikes, then drops to zero and stays there (consumer overwhelmed or stuck) |
| DLQ contents | Genuinely-poison messages redriven and reprocessed in controlled batches within the DLQ retention period | Reprocessed all at once (overwhelming downstream), or left to age out of the DLQ and be deleted |
Recovery is when the DLQ can move. A consumer overwhelmed by the accumulated backlog can re-fail messages and push some to the DLQ. If healthy messages land there, your
maxReceiveCountis too low or your consumer isn’t keeping up.
Analyzing results
After the experiment completes, compare what happened against your hypothesis. Focus on these questions:
- Did your circuit breakers activate? Measure from the first
AccessDeniedto when your application stopped attempting SQS operations. Over your target (typically 30 seconds) means your detection threshold is too high. - Did your system preserve messages? Reconcile attempted sends against messages processed after recovery, plus the DLQ and producer-side fallback storage. If the numbers don’t add up you have message loss, and the gap tells you which side lost them.
- Are the recovered messages still worth processing? Preservation and relevance are different questions. After a long outage, some buffered sends and backlogged messages represent requests the client has already given up on, and processing them spends recovery capacity acting on stale intent. Compare each message’s timestamp to the current time as you consume it, and drop or sideline anything no longer actionable, deliberately rather than by letting it age out. See REL05-BP04: Fail fast and limit queues.
- How did recovery behave? Look at
ApproximateNumberOfMessagesVisibleafter each recovery period. A healthy system drains steadily. If the drain stalls (the rate spikes, then drops to zero and stays there), your consumer is overwhelmed or stuck. - Did longer disruptions reveal new failure modes? Compare the 2-minute phase against the 15-minute one. What tends to surface only under sustained failure:
- Thread pool exhaustion from accumulated retry threads.
- Memory pressure from buffered messages.
- Connection pool starvation.
- DLQ messages aging out: messages that sit in the DLQ longer than its retention period are deleted (see Best practices).
Results that match your hypothesis are evidence your resilience mechanisms work. Results that don’t are your work list.
Best practices
The sections below cover the resilience patterns that turn the gaps this experiment surfaces into fixes: retry logic, circuit breakers, dead-letter queues, and monitoring.
Retry logic with exponential backoff
Don’t retry everything. Retry only errors that might succeed on a repeat, such as throttling, timeouts, and transient 5xxs, and fail fast on non-retryable ones like the AccessDenied (403) this experiment injects. For the errors worth retrying, use exponential backoff with jitter: each failure increases the wait exponentially (1s, 2s, 4s, 8s, and so on) with a random offset that prevents producers who failed together from retrying together and spiking a recovering dependency.
The AWS SDKs have configurable retry behavior built in, so configure it rather than rolling your own. See Timeouts, retries, and backoff with jitter.
Circuit breakers
A circuit breaker stops attempting operations after a threshold of consecutive failures, then lets a single test call through after a recovery timeout. That saves resources on calls that are likely to fail and gives the dependency room to recover. Choose the open-state behavior deliberately: shedding or buffering load is safer than silently switching to an alternate path, because fallback paths are exercised only during failures and tend to fail with them. See Using load shedding to avoid overload and Avoiding fallback in distributed systems.
Dead letter queues
Configure a DLQ for every queue. It’s a consumer-side safety net for poison messages, not a producer overflow buffer. Set maxReceiveCount to the number of processing attempts that make sense for your workload (typically 3 to 5). Because redelivery is what feeds a DLQ, every consumer must tolerate seeing a message twice. See Making retries safe with idempotent APIs. For what a large post-recovery backlog can do, see Avoiding insurmountable queue backlogs.
A DLQ has no depth limit. The constraint is the retention period, after which SQS deletes the message (default 4 days, maximum 14). Set the DLQ’s retention longer than the source queue’s to provide more investigation time before messages are deleted. For standard queues, note that the retention clock runs from the original enqueue time and does not reset on the move to the DLQ, so time in the source queue counts against it. (FIFO queues do reset it.) After the experiment, confirm messages were preserved rather than aged out.
Monitoring strategy
For what to emit and at what granularity, see Instrumenting distributed systems for operational visibility. Build a CloudWatch dashboard combining these across the producer, the consumer, and the queue:
Queue-level metrics: NumberOfMessagesSent, NumberOfMessagesReceived, NumberOfMessagesDeleted, ApproximateNumberOfMessagesVisible, ApproximateNumberOfMessagesNotVisible, and ApproximateAgeOfOldestMessage, read as described in what to observe during impairment.
Application-level metrics:
- Error rates by type (distinguish
AccessDeniedfrom other failures), tagged by producer vs. consumer. - Circuit breaker state changes (open / closed / half-open transitions).
- DLQ message count.
- End-to-end message processing latency.
Alarm on ApproximateAgeOfOldestMessage exceeding your SLA threshold as a production alert, but not as an experiment stop condition, since the metric is supposed to rise during impairment. Use a customer-impact signal there instead (see Stop conditions).
Clean up your environment
- Verify the deny policy is gone. Check each queue’s access policy on the console or run
aws sqs get-queue-attributes --queue-url <URL> --attribute-names Policy. IfFISTemporaryDenyis still there, retrieve the policy, delete the statement, and reapply withaws sqs set-queue-attributes. - Process messages that landed in your DLQs during the experiment.
- Review CloudWatch metrics to confirm your queues have returned to normal operation.
- Document your findings: What matched your hypothesis, what didn’t, and what you’re fixing.
Expand your resilience testing
Once the basics hold, extend the experiment:
Partial failure: Impair only a subset of your queues to test whether your application handles mixed healthy/unhealthy dependencies.
Note: Don’t run two impairment experiments against the same queue concurrently. The automation reads the policy, modifies it, and writes it back. Concurrent runs can overwrite each other and leave a stale deny behind. Target distinct queues, or run them in sequence.
Consumer-side only: Block only ReceiveMessage and DeleteMessage while allowing SendMessage, to simulate a consumer outage while producers keep filling the queue (the most common real-world scenario).
Combine with other failures: Run the SQS experiment alongside EC2 instance termination or network latency injection to test compound failure scenarios.
Explore AWS Resilience Hub: Use AWS Resilience Hub to assess your application’s resilience posture and get recommendations for improvement.
Using FIS scenarios
A scenario is an AWS-authored template bundling the actions, targets, and duration for a recognizable event, so you start from a reviewed definition instead of assembling actions yourself. While AWS provides multiple scenarios in the library, here are two that are a good place to start.
AZ Availability: Power Interruption induces the symptoms of losing power in one Availability Zone: zonal EC2, ECS, and EKS compute stops, new launches in that AZ fail, and subnet connectivity is lost. It’s the sharper test of the queue-based decoupling this post exercises, because producers and consumers lose capacity while the queue itself is not targeted. You learn whether surviving consumers absorb the backlog, whether Auto Scaling replaces capacity in the remaining AZs rather than retrying in the impaired one, and whether the backlog drains inside your hypothesis window. It defaults to 30 minutes of impairment plus 30 of recovery, twice this post’s longest phase.
AZ: Application Slowdown introduces additional latency between resources within a single Availability Zone (AZ). This latency creates many of the symptoms of an application slowdown, a partial disruption, sometimes known as a gray failure. It adds latency to network flows between target resources. Network flows represent the traffic between computing resources: the data packets carrying requests, responses, and other communications between your servers, containers, and services. The scenario can help to validate observability setups, tune alarm thresholds, discover application sensitivity to slowdowns, and practice critical operational decisions like AZ evacuation.
Scenarios carry the same obligations: write the hypothesis first and set the stop condition on a customer-impact metric rather than one the scenario is designed to move. Your derived threshold works unchanged. Copy a scenario into your own template to narrow the targets or change the duration. See Working with the AWS FIS scenario library.
Conclusion
In this post, you learned how to discover what your application does when SQS operations fail, and whether you’d notice. Every gap between your hypothesis and the results is an opportunity to improve your system’s resilience and its observability.
Start with the 2-minute phase in a non-production environment. Fix what breaks. Then run the full sequence and keep running it as the application evolves. Each phase of growth brings failure modes you might only find under load.
For more information, see:
- AWS FIS experiment templates.
- Amazon SQS resource-based access policies.
- Amazon SQS dead-letter queues.
- Available CloudWatch metrics for Amazon SQS.
- Verify the resilience of your workloads using chaos engineering.
- AWS Well-Architected Reliability Pillar: Test resiliency using chaos engineering.
- AWS Well-Architected Reliability Pillar: REL05-BP04 Fail fast and limit queues.
- AWS FIS samples on GitHub.