AWS News Blog
Elastic Beanstalk Update – Enhanced Application Health Monitoring
My colleague Abhishek Singh shared a guest post that brings word of a helpful new Elastic Beanstalk feature!
— Jeff;
AWS Elastic Beanstalk simplifies the process of deploying and scaling Java, .NET, PHP, Node.js, Python, Ruby, Go, and Docker web applications and services on AWS. Today we are making Elastic Beanstalk even more useful by adding support for enhanced application health monitoring.
To understand the benefit of this new feature, imagine you have a web application with a bug that causes it to return an error when someone visits the /blog page but the rest of your application works as expected. Previously, you could detect such issues by either monitoring the Elastic Load Balancers HTTPCode_Backend_5XX metric or going to the URL yourself to test it out. With enhanced application health monitoring, Elastic Beanstalk does the monitoring for you and highlights such issues by changing the health status as necessary. With this new feature, Elastic Beanstalk not only monitors the EC2 and ELB health check statuses but also monitors processes (application, proxy, etc.) and essential metrics (CPU, memory, disk space, etc.) to determine the overall health of your application.
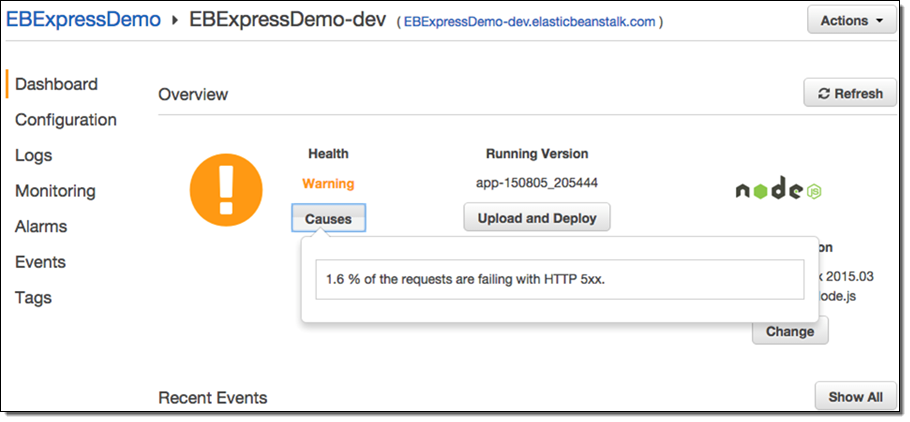
At the core of the enhanced health monitoring feature are a set of rules that allow Elastic Beanstalk to detect anomalies in your running application and flag them by changing the health status. With every change in health status, Elastic Beanstalk provides a list of causes for the change. In the example above, the system would detect an increase in 500 errors as visitors visit the /blog page and flag it by changing the health status from “Ok” to “Warning” with a cause of “More than 1% of requests are failing with 5XX errors”.
Here’s what the status looks like in the AWS Management Console:

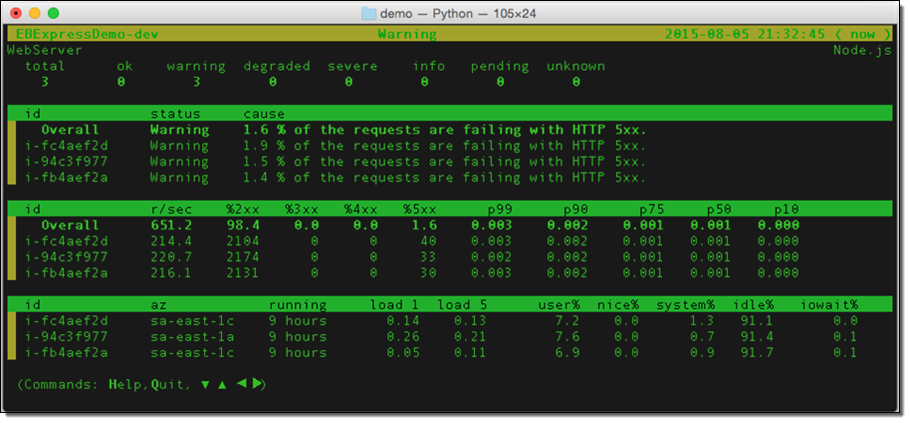
And from the command line (via eb health --refresh):

As you can see, this makes it much easier to know when your application is not performing as expected, and why this is the case (we are working on a similar view for the Console). For further details on how enhanced application health monitoring works, see Factors in Determining Instance and Environment Health.
As part of this feature we have also made some other changes:
- Health monitoring is now near real-time. Elastic Beanstalk now evaluates application health and reports metrics every 10 seconds or so instead of every minute.
- Rolling deployments require health checks to pass before a version deployment to a batch of instances is deemed successful. This ensures that any impact due to regressions in application versions is minimized to a batch of instances. For more information, see Deploying Application Versions in Batches.
- The set of values for the health status has been expanded from three (Green, Yellow, and Red) to seven (Ok, Warning, Degraded, Severe, Info, Pending, and Unknown). This allows Elastic Beanstalk to provide you with a more meaningful health status. For more information, see Health Colors and Statuses.
- We have added over 40 additional environment and instance metrics including percentiles of application response times, hard disk space consumption, CPU utilization, all of which can be published to Amazon CloudWatch as desired for monitoring and alarming. For a complete list of available metrics and more information on how to use Amazon CloudWatch with this feature, see Enhanced Health Metrics.
To begin using this feature, log in to the AWS Elastic Beanstalk Management Console or use the EB CLI to create an environment running platform version 2.0.0 or newer.
— Abhishek Singh, Senior Product Manager, AWS Elastic Beanstalk