AWS Big Data Blog
Optimize HBase reads with bucket caching on Amazon EMR
Apache HBase is a database system for big data applications that efficiently manages billions of rows and millions of columns. Its distributed, column-oriented structure handles both structured and unstructured data while addressing speed, flexibility, and scalability challenges. Amazon EMR HBase on Amazon S3 extends these features by storing data directly in Amazon S3, enabling data persistence and cross-zone access while supporting compute-based cluster sizing and read-only replicas.
HBase BucketCache serves as an advanced L2 caching mechanism that works alongside traditional on-heap memory cache. It stores large data volumes outside the JVM heap, reducing garbage collection overhead while maintaining fast access. When combined with Amazon EBS gp3 SSDs, it provides near-HDFS performance at lower costs.
However, implementing terabyte-scale BucketCache in production environments presents challenges: determining optimal cache sizes, balancing cost versus performance, and configuring eviction policies for S3-backed storage.
In this post, we demonstrate how to improve HBase read performance by implementing bucket caching on Amazon EMR. Our tests reduced latency by 57.9% and improved throughput by 138.8%. This solution is particularly valuable for large-scale HBase deployments on Amazon S3 that need to optimize read performance while managing costs.
The following diagram shows Amazon EMR’s integration with Apache HBase and Amazon S3 to implement a multi-tiered caching strategy.
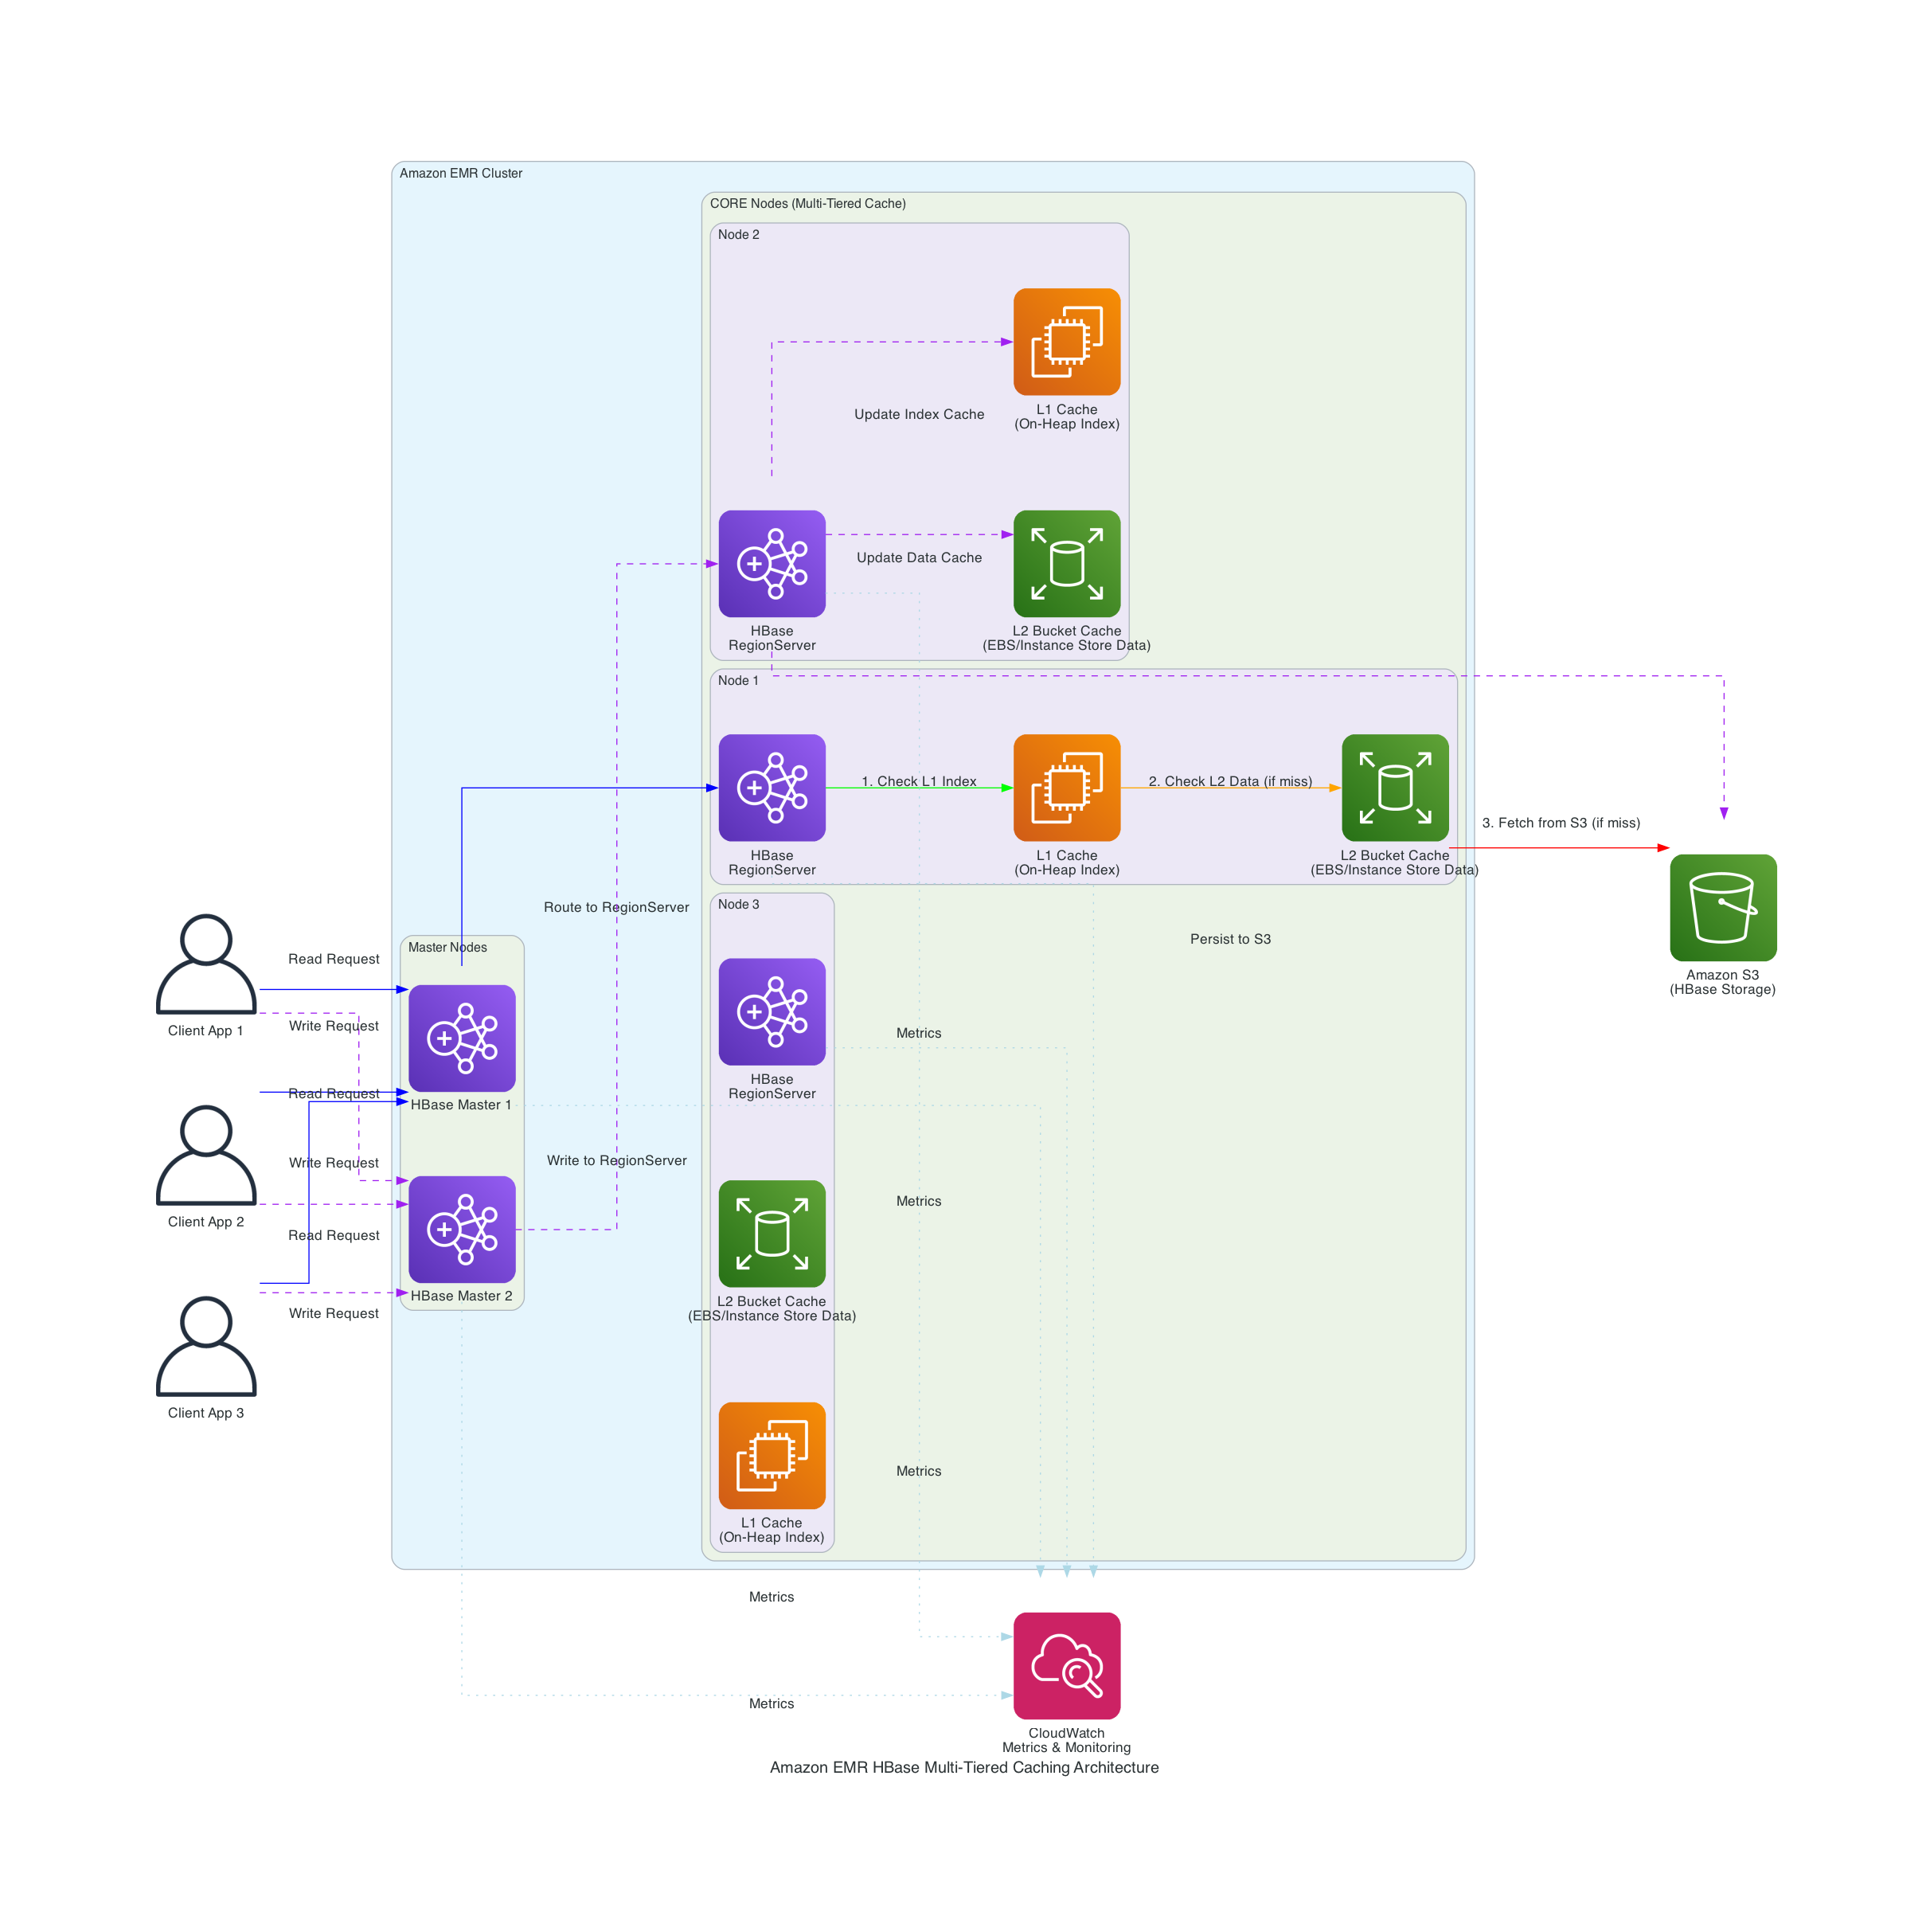
Figure 1 – Solution Architecture
The solution implements key components:
- Configure persistent bucket cache with validated parameters
- Implement cache-aware load balancing
- Use ZGC for improved garbage collection performance
- Monitor cache effectiveness through l2CacheHitRatio using Amazon EMR metrics
In our testing with datasets in terabytes, we achieved:
- Bucket cache hit ratios exceeding 95%
- S3 GET requests reduced to under 1,000/hour at peak performance
- Read latencies reduced to milliseconds
- Zero JVM pause detection during high read workloads
- 138.8% improvement in read throughput
Walkthrough
Prerequisites
This section shows how we improved HBase read performance using bucket caching on Amazon EMR in our tests. Before implementing this solution, you should have:
AWS resources
- An AWS account with appropriate permissions
- The following IAM roles:
- EMR_DefaultRole_V2
- EMR_EC2_DefaultRole with Amazon S3 access
- Familiarity with Apache HBase and Amazon EMR
Technical requirements:
- Amazon EMR version 7.10.0 or later
- Apache HBase 2.6.2 on Amazon EMR 7.10.0 or later
- ycsb 0.17.0 for benchmarking
- AWS CLI installed and configured
For setup instructions, refer to:
Create an EMR Cluster with optimized configuration
Create your EMR cluster using the following exampled launch command. This command is an optimization demo for terabyte-scale bucket caching:
Explain configurations for HBase optimized cache performance
In the above launch command, you can see configurations through the EMR software configurations. These settings are specifically for terabyte-scale caching scenarios. When HBase is installed on EMR, Apache YARN’s memory allocation is reduced by approximately 50% from its default configuration (68-73% of RAM) to 34-36% of physical RAM, reserving memory for HBase RegionServer operations. The cache and memstore sizes must be carefully balanced against available node memory to prevent resource contention.
The hbase.bucketcache.size parameter determines the total bucket cache size per RegionServer in megabytes, which directly affects how much data can be stored in bucket cache. If the data files are stored in compressed formats, you have to enable hbase.block.data.cachecompressed . This feature keeps blocks compressed in the cache, reducing memory footprint while maintaining quick access times. Your EBS size per RegionServer depends on the value of hbase.bucketcache.size. The configured EBS size can be the value of this feature plus a buffer for system usage. The hbase.bucketcache.bucket.sizes setting defines bucket sizes to efficiently accommodate different data block sizes, while hbase.bucketcache.writer.threads controls the number of threads used for writing to the cache, optimizing write performance.
In the above launch command, we configured ZGC settings to optimize garbage collection.
Using ZGC minimizes the need for a large JVM heap to accommodate JVM objects for large-scale bucket cache operations, resulting in fewer JVM pauses. By adjusting the heap size through increasing or decreasing the HBASE_HEAPSIZE parameter, you can optimize memory allocation for your specific workload. A key advantage of ZGC is that it keeps JVM pause times short regardless of heap size, whereas traditional garbage collectors experience longer full GC times as heap size increases. This makes ZGC particularly valuable for HBase deployments with terabyte-scale bucket caches, where maintaining consistent low-latency performance is critical.
The generational garbage collection settings efficiently manage memory by separating short-lived objects from long-lived ones, reducing collection frequency and overhead. The AlwaysPreTouch parameter improves Apache HBase responsiveness by pre-allocating memory during operation.
Explain EMR metrics collection configurations
In the above launch command, we set up configurations to publish emr metrics to CloudWatch through CloudWatch Agents. We can use these metrics to track bucket cache request amount and hit ratios. If L2CacheHitRatio is high but L2CacheMissCount is low, it means HBase can fetch most of the requested data in bucket cache. The read latencies can be shorted to milliseconds in this case.
Performance testing and results
This section details our performance testing methodology and results using a 7.9 TB dataset.
Test setup
- We used ycsb to generate and test with a 7.9 TB dataset.
- We used the following command to run a read-only workload:
| Configuration | Throughput (ops/sec) | Latency (ms) |
| Without Cache | 371.93 | 2680 |
| With Cache | 888.67 | 1127 |
| Improvement | 138.80% | 57.90% |
In our read performance test using bucket cache to cache terabytes of data, we achieved a 138.8% improvement in read throughput (from 371.93 to 888.67 ops/sec) and a 57.9% reduction in read latency (from 2680ms to 1127ms) compared to a scenario without bucket cache.
Read performance improvement
As shown in the previoustable, implementing bucket cache led to improvements in both throughput and latency. The system achieved a 138.8% increase in throughput, processing 888.67 operations per second compared to the baseline 371.93 ops/sec. Similarly, latency was reduced by 57.9%, dropping from 2680ms to 1127ms, demonstrating the performance benefits of the caching solution. The following chart shows implementing bucket cache led to improvements in average throughput compared to a scenario without bucket cache.
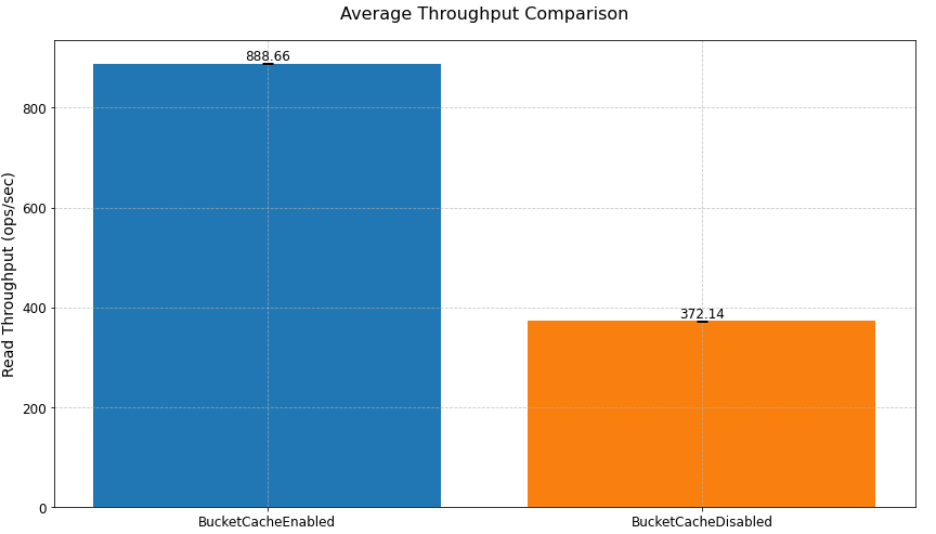
Figure 2 – Average throughput comparison
Cache hit ratio progression
The cache hit ratio data demonstrates the effectiveness of the bucket cache implementation over time. Starting from 0% at initialization, the cache hit ratio improved to 85% within 12 hours, ultimately stabilizing above 95% after 24 hours. This progression corresponded with an extensive reduction in Amazon S3 GetObject requests, from 95,000 per hour initially to fewer than 1,000 per hour at peak performance, reducing both latency and costs.
| Time (hours) | Hit Ratio | S3 Requests/hour |
| 0 | 0% | 95,000 |
| 12 | 85% | 15,000 |
| 24 | 95%+ | <1,000 |
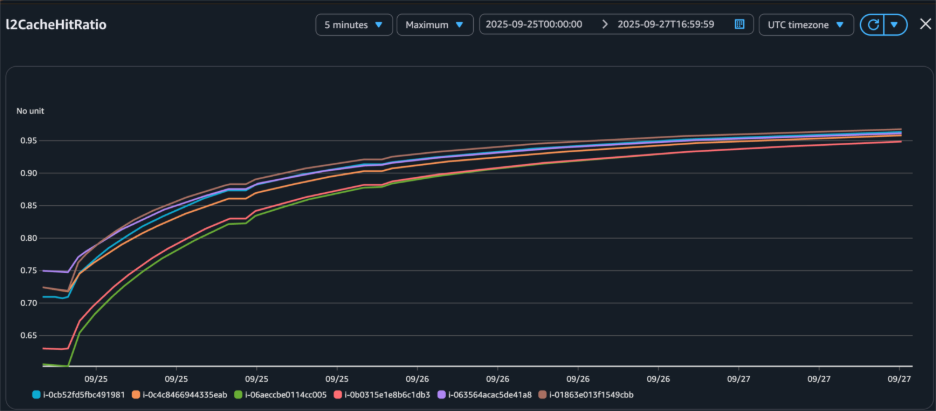
Figure 3 – Bucket cache hit ratio increased after we loaded data to bucket cache through read-only workload.
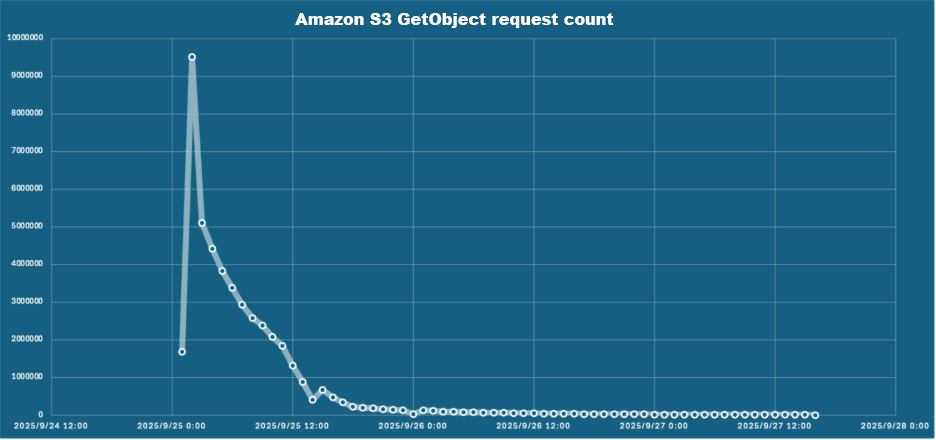
Figure 4 – Amazon S3 GetObject request count decreased as bucket cache hit ratio increased.
Key implementation: persistent bucket cache
One of the key features introduced in HBase 2.6.0 after Amazon EMR 7.6.0 is persistent bucket cache, which maintains cache data across RegionServer restarts. This feature is particularly for production environments where maintaining consistent performance during maintenance operations is crucial. The following section demonstrate how to configure persistent bucket cache.
Configuring persistent bucket cache
Set up persistent bucket cache by implementing these configurations:
Performance impact of persistent cache
The following table shows the tests demonstrated significant improvements in RegionServer restart performance. With persistent cache enabled, the HBase cluster maintained consistent read request performance and low latency after RegionServer restarts since data remained directly accessible in the bucket cache. In contrast, clusters without persistent cache required 6 hours to reload bucket cache after RegionServer restarts before achieving comparable read operation performance and latency levels. It demonstrates significant improvements from enabling persistent cache.
| Pre-restart throughput | Post-restart throughput | Recovery time | |
| Without Persistent Cache | 888.67 ops/sec | 371.93 ops/sec | ~6 hours |
| With Persistent Cache | 889.08 ops/sec | 886.71 ops/sec | <2 minutes |
In the following graph, the RegionServer L2 cache size metrics revealed that the bucket cache size remained stable after RegionServer restart, confirming that the cached data was preserved rather than reset during the process. The metrics were unavailable between 16:30 and 16:35 because the RegionServer was stopped and restarted.
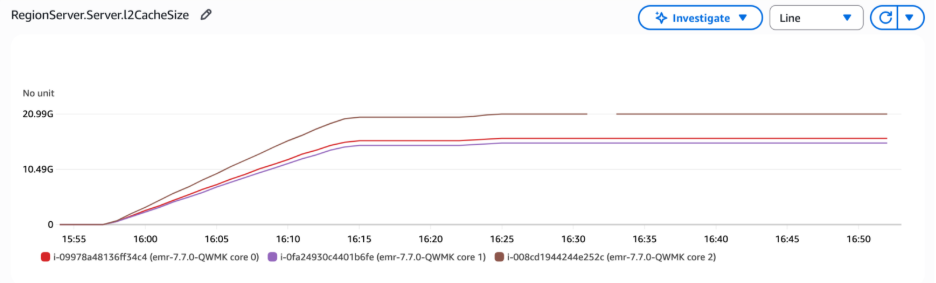
Figure 5 – The bucket cache size remained stable after RegionServer restart
L2 cache miss count is a cumulative metric that tracks cache misses from RegionServer startup. When the RegionServer restarts, this metric resets to zero. In the following graph, the L2 cache miss count increased steeply at the beginning because read requests retrieved data from HFiles, as the data had not yet been loaded into bucket cache. Over time, the bucket cache was populated with data through read-only workload, and the slope of the L2 cache miss count decreased. We restarted RegionServer between 16:30 and 16:35 . Thus, L2 cache miss count reset to 0. Notably, these metrics remained at zero even during subsequent client read operations. The requests did not retrieve data from HFiles that caused an increase in L2 cache miss count. This confirmed that data persisted in the bucket cache and was directly accessible without requiring cache rebuilding.
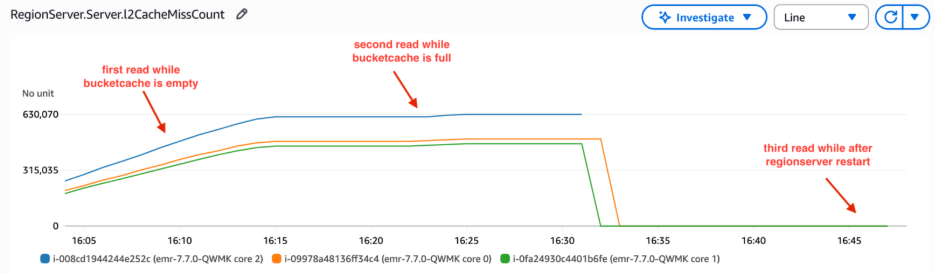
Figure 6 – Regionserver bucketcache miss count remained 0 after restarting RegionServer
The RegionServer read request count metrics demonstrated consistent read operation volumes following restart. This indicated that RegionServers maintained read performance levels without needing to fetch HFiles from Amazon S3, thus avoiding the increased latency and reduced throughput typically associated with S3 lookups. This persistent cache behavior directly reduces S3 costs by minimizing API calls—our above testing statistics showed S3 GET requests dropping from 95,000 per hour during initial cache warming to fewer than 1,000 per hour once the cache reached optimal performance, representing a 99% reduction in S3 API call volume.
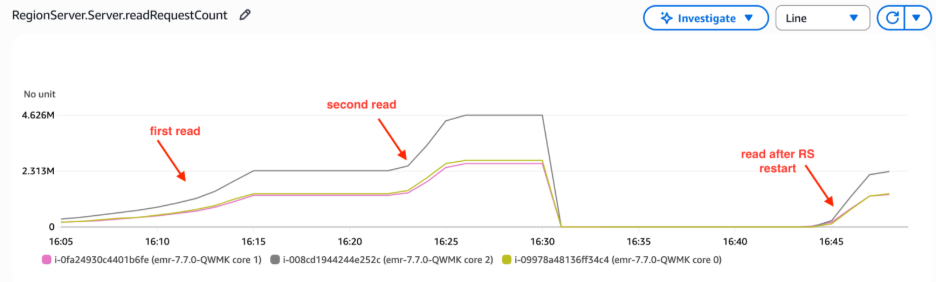
Figure 7 – Regionserver read request count
Best practices and recommendations
In this section, we share guidelines to optimize HBase bucket cache performance.
cache sizing guidelines
- Enable
hbase.block.data.cachecompressedwhen working with compressed Hfiles: This setting ensures data blocks are stored in the bucket cache in compressed form, saving memory and improving efficiency. - Activate
hbase.rs.cachecompactedblocksonwrite: This prevents data eviction during HBase compactions.
For optimal performance, size your bucket cache appropriately by ensuring the total cache size exceeds your target cached data volume. Insufficient bucket cache size will lead to frequent data evictions, degrading system performance. Monitor free cache space using Amazon CloudWatch metrics to prevent overflow issues. Furthermore, consistently analyze L2 cache hit ratio metrics to assess performance, and adjust bucket cache size based on your specific workload patterns and L2 hit ratio trends. These ongoing monitoring and adjustment practices will help maintain optimal cache performance and resource utilization.
Performance optimization
To further enhance HBase read performance, consider implementing the following configuration settings. These optimizations are designed to improve cache utilization, reduce disk I/O, and minimize latency for common read operations:
Resource monitoring
Set up Amazon CloudWatch dashboards to monitor key metrics. These dashboards should track L2 cache hit ratios, which provide insight into the effectiveness of your caching strategy. Additionally, monitor Amazon S3 request patterns to understand your data access trends and optimize accordingly. Keep a close eye on memory utilization to ensure your instances have sufficient resources to handle the workload efficiently. Finally, regularly analyze garbage collection (GC) patterns to identify and address any potential memory management issues that could impact performance.
Cleaning up
To avoid incurring unnecessary charges, clean up your resources when you’re done testing
Conclusion
In this post, you learned how to implement and optimize HBase bucket cache with persistent storage on Amazon EMR. In our testing, we achieved 95%+ cache hit ratios with consistent millisecond latencies. The implementation reduced Amazon S3 access costs by minimizing the number of direct Amazon S3 requests required. Read performance saw 138.8% improvement in read throughput. The system maintained stable performance during maintenance windows, eliminating performance degradation during routine operations. Additionally, the solution demonstrated better resource utilization, maximizing the efficiency of the allocated infrastructure while minimizing waste.