AWS Big Data Blog
Set up production-ready monitoring for Amazon MSK using CloudWatch alarms
Organizations running Apache Kafka as their streaming platform need comprehensive monitoring to maintain reliable operations. Without proper visibility into broker health, resource utilization, and data flow metrics, teams risk service disruptions, data loss, and degraded performance that can impact critical business operations. Effective monitoring and alerting are essential to detect anomalies early, from high system load to connectivity issues, enabling teams to take preventive action before problems affect production workloads.
Amazon Managed Streaming for Apache Kafka (Amazon MSK) addresses these monitoring challenges by publishing detailed metrics to Amazon CloudWatch. The service emits metrics at 1-minute intervals for provisioned (Standard) clusters, with flexible monitoring levels (DEFAULT, PER_BROKER, PER_TOPIC_PER_BROKER, or PER_TOPIC_PER_PARTITION) to control granularity and cost. At the DEFAULT level (free), cluster-level metrics are available; higher levels (paid) expose broker-level, per-topic and per-partition metrics.
In this post, I show you how to implement effective monitoring for your MSK clusters using Amazon CloudWatch. You’ll learn how to track critical metrics like broker health, resource utilization, and consumer lag, and set up automated alerts to prevent operational issues. By following these practices, you can work to improve streaming operations reliability, optimize resource usage, and support high availability for your mission-critical applications.
Key metrics to monitor
This article groups important Amazon MSK metrics into logical categories. For each, we highlight key metrics and what they indicate:
- Broker Health and Cluster Availability:
- ActiveControllerCount is a cluster-level metric where each broker reports whether it’s the active controller (1) or not (0). In a healthy cluster, exactly one broker serves as the active controller at any time. When viewing this metric with the average statistic, the value equals 1 divided by the number of brokers. For example, a 3-broker cluster shows 0.33 (1/3). Set CloudWatch alarm thresholds accordingly—for 6 brokers, alert if average falls below 0.166(1/6). When using the sum statistic, the value should always be 1, indicating one active controller regardless of cluster size. If the sum differs from 1, a controller election is in progress—typically during maintenance activities, configuration changes, or rolling restarts.
Note: For a KRaft-based clusters, the ActiveControllerCount is only exposed on dedicated controller endpoints so the sample count is 3 and only controller will report value of 1. Thus, the average is always 0.33 no matter how many brokers there are in the cluster. To monitor the broker health for Kraft-based clusters, check LeaderCount metric. If a broker is not emitting any metric, then it’s a good indication that broker might be unhealthy. - OfflinePartitionsCount (cluster): Number of partitions with no active leader. Non-zero values mean data is temporarily unavailable or unwritable. Trigger alerts if it rises above 0.
- UnderReplicatedPartitions (per broker): Number of partitions where not all replicas are caught up. This should stay at 0 under normal conditions. Spikes indicate traffic exceeds capacity or replication lag; sustained values often mean a configuration/ACL issue. Refer to Troubleshoot your Amazon MSK cluster
- UnderMinIsrPartitionCount (per broker): Partitions below the minimum in-sync replica (ISR) count. A non-zero value means potential data loss risk if brokers fail. Monitor to ensure replication is healthy. Refer to Custom configurations
- GlobalPartitionCount (cluster): Total number of partitions across all topics (leaders only). Useful for capacity planning and sanity checks.
- PartitionCount (per broker): Number of partitions (including replicas) hosted by a broker. Sudden changes may indicate re-balances. (Excess partitions per broker can degrade performance).
- ActiveControllerCount is a cluster-level metric where each broker reports whether it’s the active controller (1) or not (0). In a healthy cluster, exactly one broker serves as the active controller at any time. When viewing this metric with the average statistic, the value equals 1 divided by the number of brokers. For example, a 3-broker cluster shows 0.33 (1/3). Set CloudWatch alarm thresholds accordingly—for 6 brokers, alert if average falls below 0.166(1/6). When using the sum statistic, the value should always be 1, indicating one active controller regardless of cluster size. If the sum differs from 1, a controller election is in progress—typically during maintenance activities, configuration changes, or rolling restarts.
- Resource Utilization:
- CPU: Total broker CPU utilization is defined as CpuUser + CpuSystem. Best practice is to keep average CPU utilization under 60% . Set alarms on the sum of user+system to detect overload.
- CPUCreditBalance / CPUCreditUsage (per broker): For burstable instance types(T3), tracks earned/spent CPU credits. A declining credit balance or high credit usage warns that the instance may be CPU-starved.
- Memory: MemoryUsed, MemoryFree (per broker) show RAM usage. Critically, HeapMemoryAfterGC (per broker) reports JVM heap usage (%) after garbage collection. AWS recommends alerting if HeapMemoryAfterGC exceeds 60%, to avoid out-of-memory issues.
- Disk: Kafka brokers use attached EBS storage for topic data. Monitor KafkaDataLogsDiskUsed (per broker) – percentage of disk used by message logs. Best practice: alarm when data log usage exceeds 85%. Also track RootDiskUsed: the percentage of the root disk used by the broker.
- EBS I/O: Volume metrics (per broker) such as VolumeQueueLength, VolumeReadOps, VolumeWriteOps, VolumeReadBytes, VolumeWriteBytes indicate I/O latency and throughput. Rising queue lengths or latency (such as VolumeTotalReadTime) suggest disk contention.
- Network: Basic network stats per broker include NetworkRxPackets, NetworkTxPackets, and errors/drop counts (NetworkRxErrors, NetworkTxErrors, NetworkRxDropped, NetworkTxDropped). Unexpected errors or drops can indicate network issues.
- Topic and Partition Activity:
- Throughput: BytesInPerSec and BytesOutPerSec measure inbound/outbound data rates per broker or per topic. Sustained drops can signal lost producers/consumers; spikes may require scaling.
- Replication Traffic: ReplicationBytesInPerSec/ReplicationBytesOutPerSec (per topic) show inter-broker replication volume.
- Consumer Lag: Consumer lag metrics quantify the difference between the latest data written to your topics and the data read by your applications. Amazon MSK provides the following consumer-lag metrics, which you can get through Amazon CloudWatch or through open monitoring with Prometheus: EstimatedMaxTimeLag, EstimatedTimeLag, MaxOffsetLag, OffsetLag, and SumOffsetLag. For information about these metrics, see Amazon MSK metrics for monitoring Standard brokers with CloudWatch.
- Client Connections :
- ConnectionCount (per broker): Total active connections (clients + inter-broker). Sudden drops or sustained high counts (hitting limits) merit attention.
- ClientConnectionCount (per broker, with auth filter): Active authenticated client connections.
- ConnectionCreationRate / ConnectionCloseRate (per broker): New or closed connections per second. Spikes in connection churn may indicate client issues.
- Authentication: IAMNumberOfConnectionRequests and IAMTooManyConnections (per broker) show IAM auth request rates and throttle breaches (limit of 100 simultaneous connections).
- Network Bandwidth Metrics:
- TrafficShaping > 0 (any throttling) metric serves as your primary warning signal. When this value exceeds zero, your MSK cluster is experiencing network throttling at the EC2 layer, with packets being dropped or queued due to exceeded allocations. This throttling manifests as reduced throughput, increased latency, and potential network errors that impact both producer and consumer performance. TrafficShaping issues stem from two possible bandwidth limitations: BwInAllowanceExceeded & BwOutAllowanceExceeded :
- BwInAllowanceExceeded tracks when inbound aggregate bandwidth surpasses broker maximums.
- BwOutAllowanceExceeded monitors when outbound aggregate bandwidth exceeds limits.
Both BwInAllowanceExceeded and BwOutAllowanceExceeded metrics directly contribute to overall network throttling events.
- Other Operational Metrics:
- Thread Pools: RequestHandlerAvgIdlePercent, NetworkProcessorAvgIdlePercent (per broker) show how busy Kafka’s internal thread pools are. Consistently low idle (%) can indicate bottlenecks.
- ZooKeeper: For ZooKeeper-based MSK clusters, ZooKeeperRequestLatencyMsMean and ZooKeeperSessionState reflect ZK performance (for older Kafka versions that use Zookeeper). For ZooKeeperSessionState, anything other than 1 for 5-10 mins should be alarming as there can be chances broker has an issue or zookeeper is not able to connect to brokers due to some intermittent network issue.
- Tiered Storage: For clusters with tiered storage enabled, Amazon MSK provides metrics like RemoteFetchBytesPerSec, RemoteCopyBytesPerSec, RemoteLogSizeBytes, and related error/queue metrics. These track offloading to remote storage.
- Intelligent rebalancing metrics: For MSK Provisioned clusters using Express brokers, Amazon MSK provides two key metrics to monitor rebalancing operations: RebalanceInProgress and UnderProvisioned metrics. See Monitor Intelligent rebalancing metrics
By grouping metrics into these categories, you can build dashboards and alerts that comprehensively cover Amazon MSK health and performance. Amazon CloudWatch also provides automatic dashboards for Amazon MSK.
Let’s take a quick look on how to access CloudWatch automatic dashboard. In the AWS Console, go to the CloudWatch service. When in the CloudWatch console, select Dashboards. Open the Automatic dashboard tab and search for MSK in the Filter Bar.
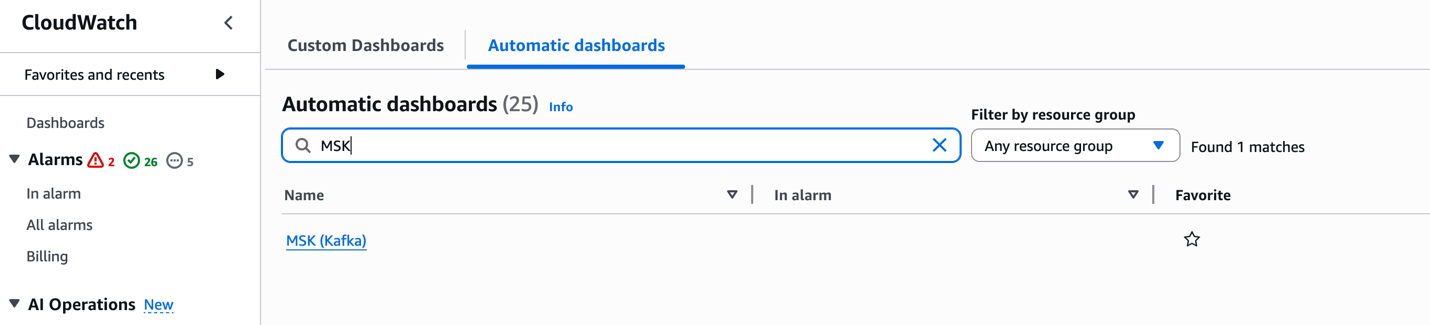
These dashboards offer per-configured visualizations of key metrics, enabling quick insights into the health and performance of your MSK clusters.
Recommended CloudWatch alarms
Setting alarms on key metrics helps catch issues early. Detecting issues early is crucial in streaming applications where every second counts. A single failing broker can trigger a chain reaction – halting data ingestion, backing up upstream systems, and breaking downstream applications. This can quickly escalate from delayed order processing to lost revenue. Proactive monitoring helps catch and fix problems before they impact your business operations. Based on AWS best practices and experience, consider alarms such as:
| Metric (Dimension) | Alarm Condition | Rationale |
| ActiveControllerCount (cluster) | ≠ 1 (count) | Only one active controller should exist. Deviation implies cluster instability. |
| CPU Utilization (Sum(CPUUser+CPUSystem), per broker) | > 60% (average) for 5+ mins | Helps maintain headroom for broker load and maintenance. High CPU may slow processing as outlined in the MSK best practices documentation |
| HeapMemoryAfterGC (broker) | > 60% (percentage) | Indicates Kafka heap is filling up. Helps prevent OOM by alerting early. |
| KafkaDataLogsDiskUsed (broker) | ≥ 85% (percent) | Warns that disk is nearly full. Helps prevent data loss by providing time for scaling or cleanup. |
| OfflinePartitionsCount (cluster) | > 0 (count) | Any offline partition means unavailable data. Immediate investigation needed. |
| UnderReplicatedPartitions (broker) | > 0 (count) | No replicas lagging under healthy conditions. Spikes or sustained lag can indicate overload or ACL misconfiguration. |
| UnderMinIsrPartitionCount (broker) | > 0 (count) | There must be topics with partitions that have either less in-sync replicas than the min.insync.replicas setting or with RF=MinISR. To find these topics whose partitions are under replicated, use command:
<path-to-your-kafka-installation>/bin/kafka-topics.sh –bootstrap-server <bootstrap-server:port> —command-config client.properties –describe –under-min-isr-partitions |
| ConnectionCount (broker) | Sudden drop (e.g. < 90% of baseline) or spike above high threshold | Detect client connectivity issues or connection floods. Unexpected drops may mean a broker is unreachable. Refer to Amazon MSK Standard broker quota |
| CPUCreditBalance (for T3 broker) | < some low threshold (e.g. 10 credits) | For burstable instances, alerts when credits are nearly exhausted, which degrades performance. |
| VolumeQueueLength (broker) | > 0 (sustained) or rising | Indicates I/O operations are queuing, possible disk bottleneck. |
| NetworkRxErrors/TxErrors (broker) | > 0 (count) | Any network errors can cause packet loss or disconnections. |
| IAMTooManyConnections (broker) | > 0 (count) | Exceeding IAM connection limit (100) blocks new connections. |
| Consumer Lag (MaxOffsetLag or SumOffsetLag) (per consumer-group/topic) | > threshold (depends on SLAs, e.g. growing beyond expected) | Alerts on slow consumers so you can scale consumers or investigate backlogs. |
| TrafficShaping | > 0 (any throttling) | This is an indication that brokers are exceeding their allocated network bandwidth. |
These are illustrative thresholds; adjust them for your workload and SLAs. The remaining metrics listed in the CloudWatch metrics for Standard and Express brokers documentation are susceptible to downstream impact from anomalies in the primary metrics above. It is recommended to enable CloudWatch alarms on a single test cluster first to validate thresholds before extending coverage across your MSK fleet.
Conclusion
In this post, we covered the important CloudWatch metrics and alarms for monitoring Amazon MSK clusters effectively. By implementing these recommended alarms, you can proactively detect and respond to potential issues before they impact your Kafka workloads. To learn more about Amazon MSK monitoring, refer to the Amazon MSK Monitoring Best Practices documentation or explore our Amazon MSK Workshops hands-on experience.