AWS Business Intelligence Blog
Amazon Quick Sight expands dashboard customization in tables and pivot tables
We are excited to announce the general availability of expanding dashboard customizations of tables and pivot tables in Amazon Quick Sight, the AI-powered business intelligence (BI) service. With this enhancement, readers can add or remove fields, change aggregations, and modify formatting directly in dashboards without requiring updates from authors. This enhancement boosts self-service analytics, reducing reliance on authors, and helps readers tailor insights to their role.
Solution overview
Previously, readers had limited flexibility to modify dashboard visuals. With the dashboard customizations release in November 2025, Quick Sight readers can sort, reorder, hide, show, and freeze fields in tables and pivot tables, according to their needs. With the expanded capabilities introduced in the December 2025 release, readers can now also:
- Add and remove fields in tables and pivot tables
- Change value aggregations
- Modify field formatting
In the November release, we introduced the ability for readers to persist their customizations and share personalized views. In the December 2025 release, we continue to support these capabilities:
- Save and persist the customizations for future sessions
- Share customized views through bookmarks and shared views
- Schedule and export customized visuals in PDF, CSV, and Excel formats
These capabilities address common pain points and help readers tailor dashboards to their specific needs. For example, a financial analyst can remove irrelevant columns to declutter their view and focus solely on key performance indicators, a marketing specialist can reorder columns to better visualize campaign trends and outcomes, and an operations manager can export a customized pivot table in Excel format to share with stakeholders for streamlined decision-making.
In the following sections, we demonstrate how to use these new features with a real-world use case.
Prerequisites
Before you begin, make sure you have the following:
- An active AWS account with permissions to access Quick Sight
- Quick Sight Enterprise Edition enabled in your account
- At least one Quick Sight user (Author or Author Pro) to create and manage dashboards
- Basic familiarity with Quick Sight concepts such as datasets, dashboards, analyses, and permissions
Enable reader customization
As an author, you can enable reader customization for a table or pivot table in just a few steps:
- Open your analysis in Quick Sight.
- Navigate to the table or pivot table you want to make customizable.
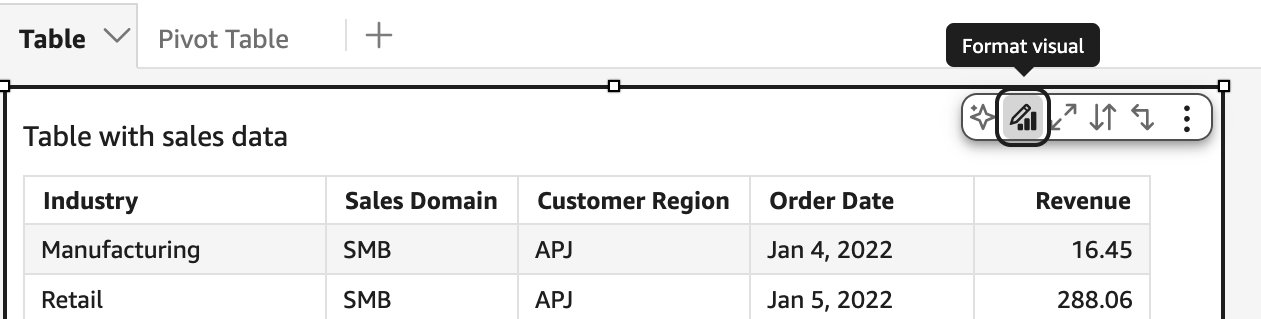
- Choose Format visual.
- In the Properties pane, on the Interactions tab, turn on Reader Customization. (By default, this option is enabled. If the author doesn’t want readers to customize the visual, they can turn it off.)
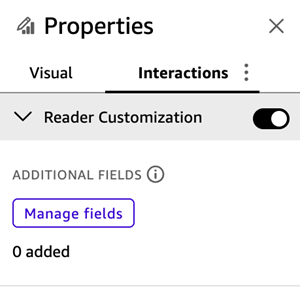
- With Reader Customization enabled, manage which fields you want readers to be able to add or remove. The available fields are based on the dataset that the visual is sourced from. By default, if the author doesn’t enable any additional fields, readers can remove, add back, hide, show, reorder, and change aggregations for the existing fields in the visual.
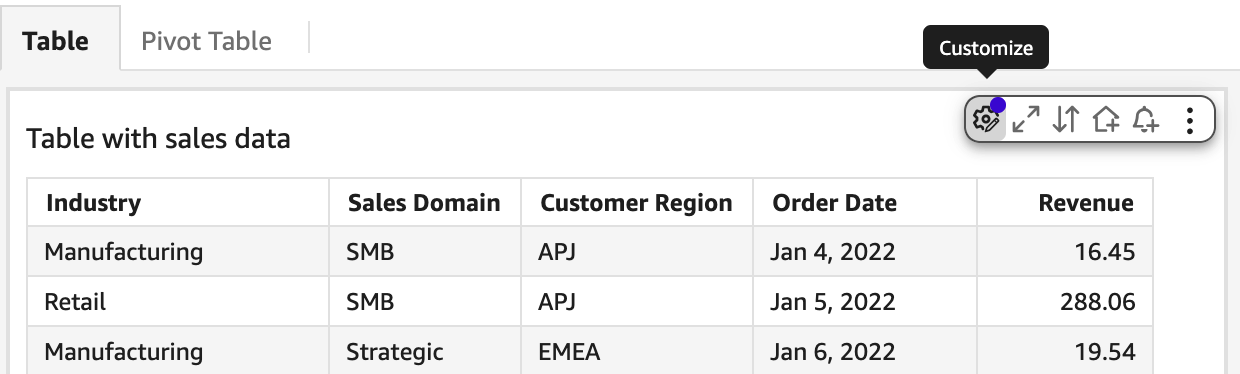
For our example, the author created a table visual with a default view that includes the dimensions Industry, Sales Domain, Customer Region, and Order Date, as well as the measure Revenue.
To make this table useful for multiple reader groups, the author enabled Reader customization and added twelve additional fields—including City, Profit, and Quantity, to the list of fields available for customization.
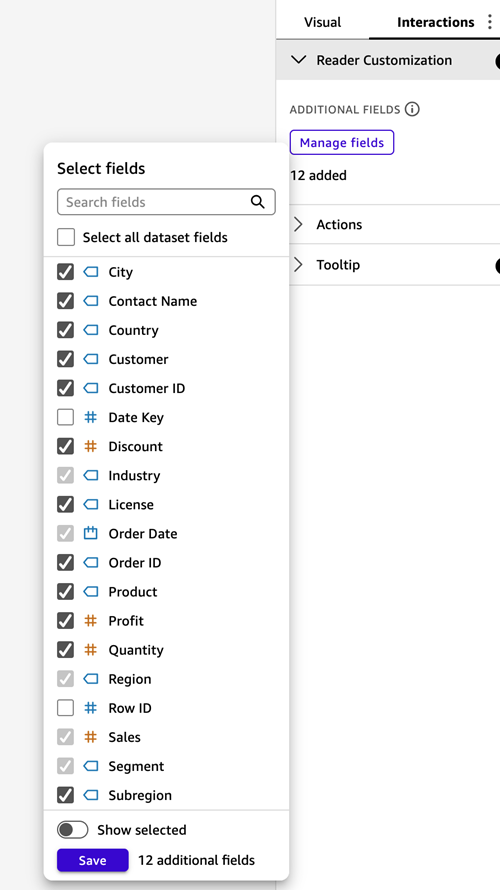
By including these more granular fields, readers can accomplish the following:
- Inspect sales details by city, customer, or other dimensions
- Compare sales revenue with profit and sales quantities to better understand performance
- Tailor the view to their specific analytical needs without waiting for updates from the author
With this configuration, readers can tailor the table or pivot table to their needs, while authors maintain control over which fields remain customizable.
Add, remove, show, hide, reorder fields, and change field aggregations in tables and pivot tables
With reader customization enabled and with selected additional fields, readers can make changes to the table visual to fit their own analysis needs:
- Open the dashboard and locate the table or pivot table with Reader Customization enabled.
- Choose Customize on the visual.
- From the field list, add fields such as
City,Profit, orQuantity.
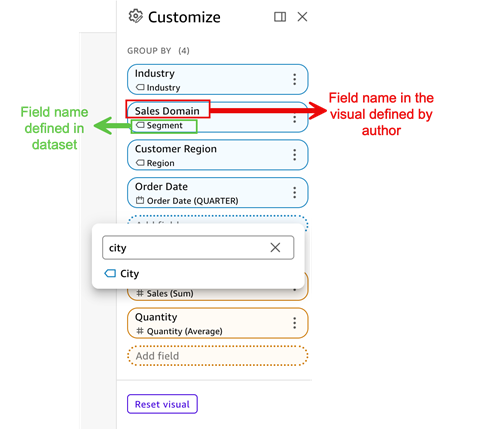
- Change the Aggregate of
Order Dateto be Quarter. - Change the Aggregate of
Quantityto be Average. - Reorder fields by dragging them into the desired sequence.
- Save your customized view as a bookmark or share it with others. You can also export the customized view to PDF, CSV, or Excel for reporting purposes.
With these capabilities, a reader such as a financial analyst can quickly compare Revenue against Profit and Avg(Quantity), and a regional manager can drill down by City or Customer to identify local trends.
Real-world use case
Let’s walk through how reader customization can help different business users get the insights they need without waiting for authors to make changes.
For our use case, a sales performance dashboard is shared across multiple teams. The author has enabled Reader Customization and included additional fields such as City, Customer, Profit, and Avg(Quantity). Our scenario involves the following personas:
- Financial analyst – Focused on profitability, the analyst removes columns like
CityandCustomer, and reorders the table to placeProfitdirectly besideRevenue. This way, they can quickly calculate margins and export the view to Excel for further modeling. - Regional sales manager – Interested in performance by location, the manager shows the
Citycolumn and filters for their region. They drill down into sales details to spot which cities are outperforming and identify areas that need attention. - Operations manager – Concerned about inventory, the manager adds the
Sum(Quantity)andAvg(Quantity)fields to compare sales volumes with revenue. They bookmark this customized view and schedule a recurring export to CSV to share with the supply chain team.
By giving readers control over their own views, customizable tables and pivot tables help users run self-service analytics tailored to their role, and authors retain governance over which fields are available. Reader customizations in the reader view are not visible to other readers of the same dashboard, unless the originating reader shares the customized view. We provide details on view sharing and collaboration in the following section.
Saving and sharing customized views
Quick Sight provides multiple ways for readers to share their customized dashboards with colleagues:
- Share this view – Readers can quickly share their current customized view of a table or pivot table without creating a bookmark. With the Share this view option, they can generate a link that preserves their applied filters, column selections, and ordering. This makes it straightforward to collaborate on one-time (ad-hoc) analysis and make sure teammates are looking at the exact same view of the data in real time.
- Bookmarks – For recurring needs, readers can save their customizations as a bookmark. Bookmarks capture visual customizations and applied filters, so readers can return to their preferred view at any time. Bookmarks can be private for individual use or shared across teams to standardize insights. This is especially helpful for recurring reporting cycles or when different stakeholders need to work from a consistent, tailored perspective.
Together, these sharing options give readers the flexibility to collaborate instantly or preserve and distribute their customized views for ongoing use.
Limitations
At the time of writing, reader customization is supported only for tables and pivot tables. Other visual types, such as bar charts, line charts, or KPIs, do not offer reader-level customization at this time. Authors should plan their dashboards accordingly, using tables and pivot tables when they want to provide readers with the flexibility to add, remove, or reorder fields. AWS will continue to evaluate expanding reader customization to additional visual types in the future.
Embedding scenarios
When embedding customized dashboards, the behavior differs depending on the embedding mode. The following are key scenarios and how they handle customization and persistence:
| Embedding Method | Can make reader customizations? | Persistence |
| Visual embedding (registered or anonymous users) | Yes | No persistence: when the page reloads, the original dashboard is displayed |
| Dashboards embedding for registered users | Yes | Behavior on reload depends on persistence settings:
If state persistence is enabled (through embedding options), the customized view is preserved and reloaded. If state persistence is not enabled, the original dashboard is displayed. |
| Dashboards embedding for anonymous (unregistered) users | Yes | No persistence: when the page reloads, the original dashboard is displayed |
In addition, the createSharedView SDK function supports generating a shared view from a customized dashboard, consistent with current functionality.
Conclusion
Reader customization of tables and pivot tables give readers greater control over their analytics experience in Quick Sight. By adding the option for readers to add, remove, show, hide, reorder, and change field aggregations, as well as share customized views, Quick Sight reduces reliance on authors and speeds up decision-making across teams. Readers can tailor dashboards to fit their role, such as a financial analyst comparing profit to revenue, a regional manager investigating city-level performance, or an operations manager scheduling exports for their team.
For more details, refer to the Amazon Quick Sight documentation.
About the authors
 Ying Wang is a Senior Specialist Solutions Architect in the Generative AI organization at AWS, specializing in Amazon QuickSight and Amazon Q to support large enterprise and ISV customers. She brings 16 years of experience in data analytics and data science, with a strong background as a data architect and software development engineering manager. As a data architect, Ying helped customers design and scale enterprise data architecture solutions in the cloud. In her role as an engineering manager, she enabled customers to unlock the power of their data through QuickSight by delivering new features and driving product innovation from both engineering and product perspectives.
 Vasha Bhatari is a Senior Product Manager at Amazon QuickSight, where she drives solutions that simplify BI migrations and help customers modernize analytics with ease. Since joining Amazon in 2017, she has led initiatives across last-mile routing optimization, database migration, and business intelligence, bringing broad experience to complex data challenges. Outside of work, Vasha is always planning her next trip, trying new foods, and exploring the best hiking and kayaking spots across the Pacific Northwest.
 Bhakti Achlerkar is a Software Development Manager working on the core analytics of Amazon QuickSight. Before that, she was a Front-End Engineer focused on data visualization. With 10 years of experience in software development, Bhakti enjoys building customer-facing features that make products more useful and impactful.