AWS Business Intelligence Blog
Ambiguous location mapping for map visuals in Amazon Quick Sight
Amazon Quick Suite is a generative AI-powered business intelligence (BI) service that combines data analysis, visual, and automation tools with conversational AI to make enterprise data analytics accessible to users without deep machine learning (ML) technical knowledge. Amazon Quick Sight is a core component of Quick Suite that makes it straightforward to create and publish interactive dashboards and perform one-time (ad hoc) analysis. Quick Sight can handle various geospatial data formats, including latitude/longitude coordinates, helping users visualize location-based insights across different geographic levels. Its geospatial features include built-in geographic hierarchies for many countries, helping users drill down from country to state to county levels seamlessly.
This post demonstrates how to resolve ambiguous location names using the location mapping feature in Quick Sight. This tool helps you explicitly define the correct geographical context for your data, achieving accurate geospatial insights.
Solution overview
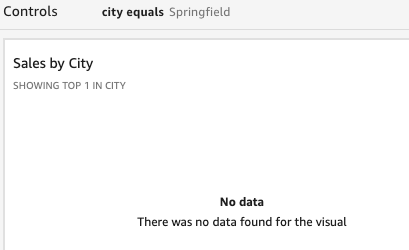
Quick Sight provides map visual capabilities that help users represent geographic data effectively. The service supports multiple map types, including points on map for location-specific data and filled maps for regional analysis. Its geospatial processing automatically identifies geographic locations when users include geospatial data fields such as cities or counties in their datasets. This geographic intelligence streamlines the creation of location-based visuals, alleviating the need for manual coordinate mapping. However, when visualizing geographical data in Quick Sight, you might encounter scenarios where location names are ambiguous. For example, a city named Springfield exists in multiple U.S. states. When Quick Sight encounters such ambiguous location names in your data, the data point for Springfield doesn’t appear in your map visual. If you apply a filter to show only Springfield’s data, your map visual displays a “No data” message, and metrics associated with Springfield aren’t represented in the visual, as illustrated in the following screenshot.
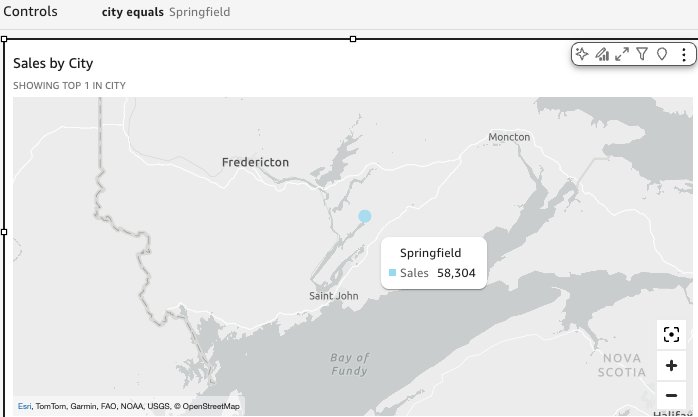
You can identify locations with either place names or longitude/latitude coordinates and either the points on map or filled map visual types. After a location is successfully identified, your metrics will automatically display on the map visual, as shown in the following screenshot with a points on map visual. With this feature, you can make sure your geospatial visuals accurately represent your data’s geographical context, leading to more reliable insights.
In the following sections, we demonstrate how to configure a points on map visual and set up location mapping for ambiguous city names. Although we use a points on map visual type with a sample dataset of city sales data, these configuration steps can be applied to other geospatial fields that work with both points on map and filled map visual types.
Prerequisites
Before implementing the location feature of Quick Sight, make sure you have an active Quick Sight account, a Quick Sight user of type Author, and a sample dataset with at least one geospatial data field with an ambiguous location. Your dataset should include common location names that could refer to multiple places, such as cities like Abbeville or Springfield, or counties like Bedford or Essex. These ambiguous names will help you understand how Quick Sight handles geographical data visuals.
Create a map visual
To create a map visual with location mapping, complete the following steps:
- On the Quick Sight analysis page, choose + Add and then choose Add visual.
- In the visual type menu, choose Points on map or Filled map. For this example, we use the points on map visual.
- In the Fields list pane, drag the following fields to the appropriate wells:
- Drag the
Cityfield to Location. - Drag a measure (such as
Population) to Size.
- Drag the
Your initial map visual appears with data points plotted according to the city names in your dataset.
Resolve ambiguous locations
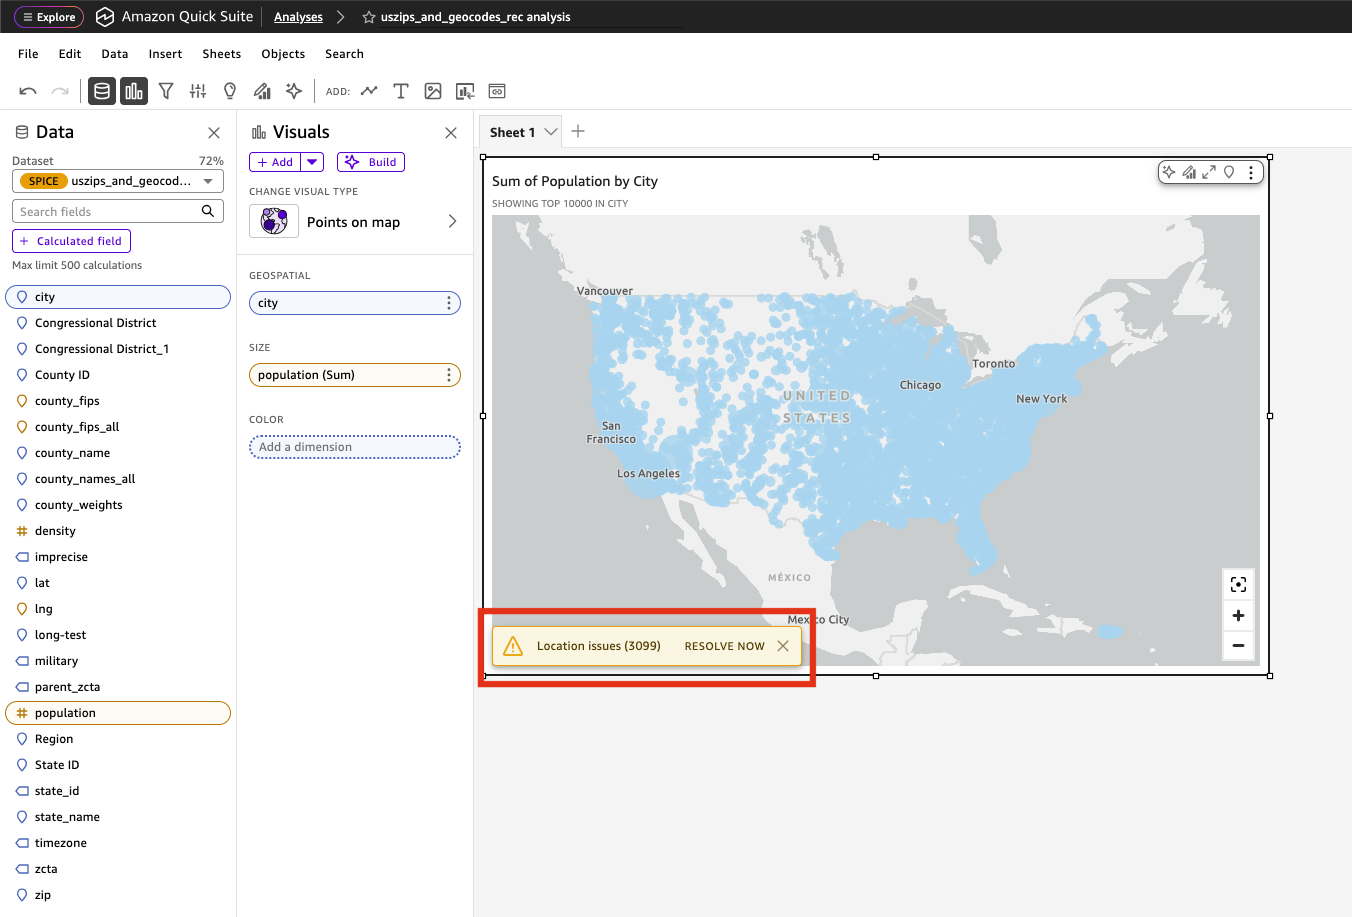
After you create your points on map visual, you might see a message indicating that some cities couldn’t be matched to specific locations. This happens when Quick Sight encounters ambiguous location names in your dataset. There are two ways to access the location mapping configuration.
First, you can choose Resolve now in the unmatched locations message.
Alternatively, you can choose Geo data match in the upper-right corner of your visual.
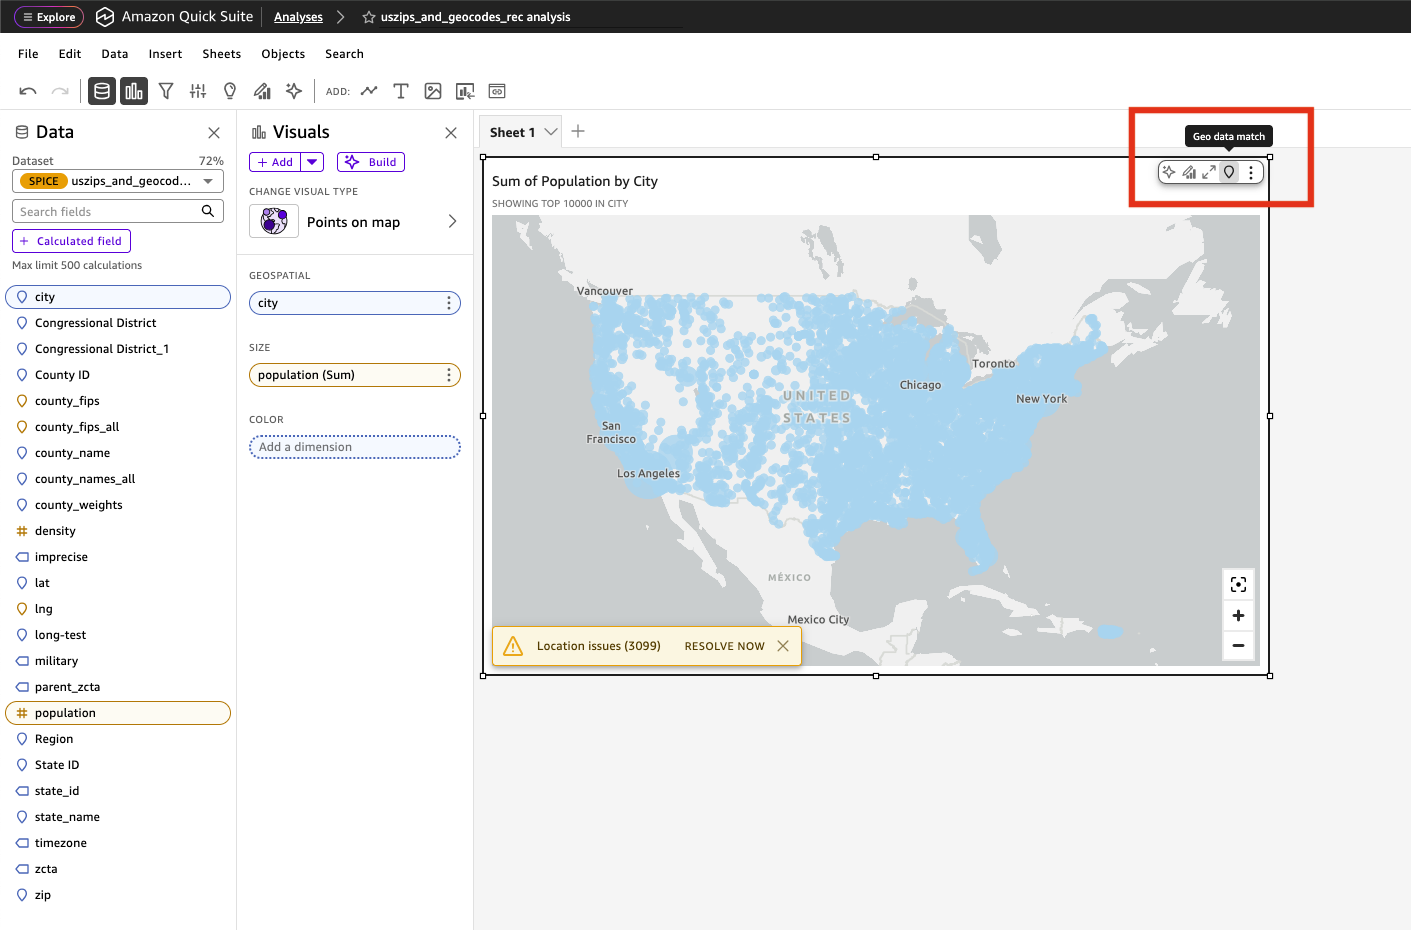
The number shown in the message represents the number of cities Quick Sight couldn’t automatically map to specific geographical coordinates. This could be because the city name exists in multiple countries or regions, or Quick Sight can’t identify the location by using the city name.
Map ambiguous locations
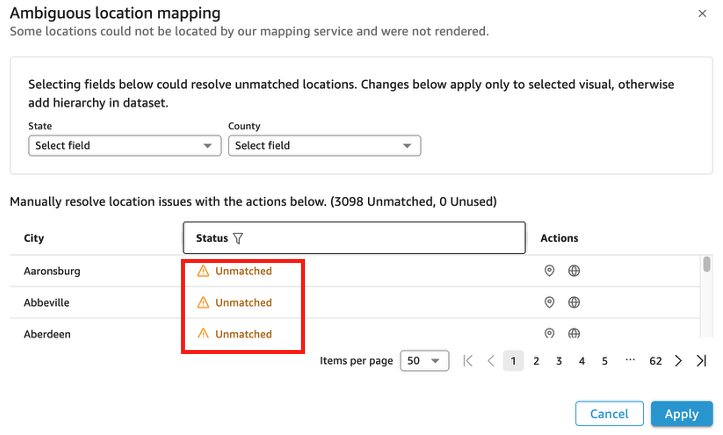
After you choose either option, the Ambiguous location mapping pane opens, where you can start mapping your ambiguous locations to their correct geographical context.
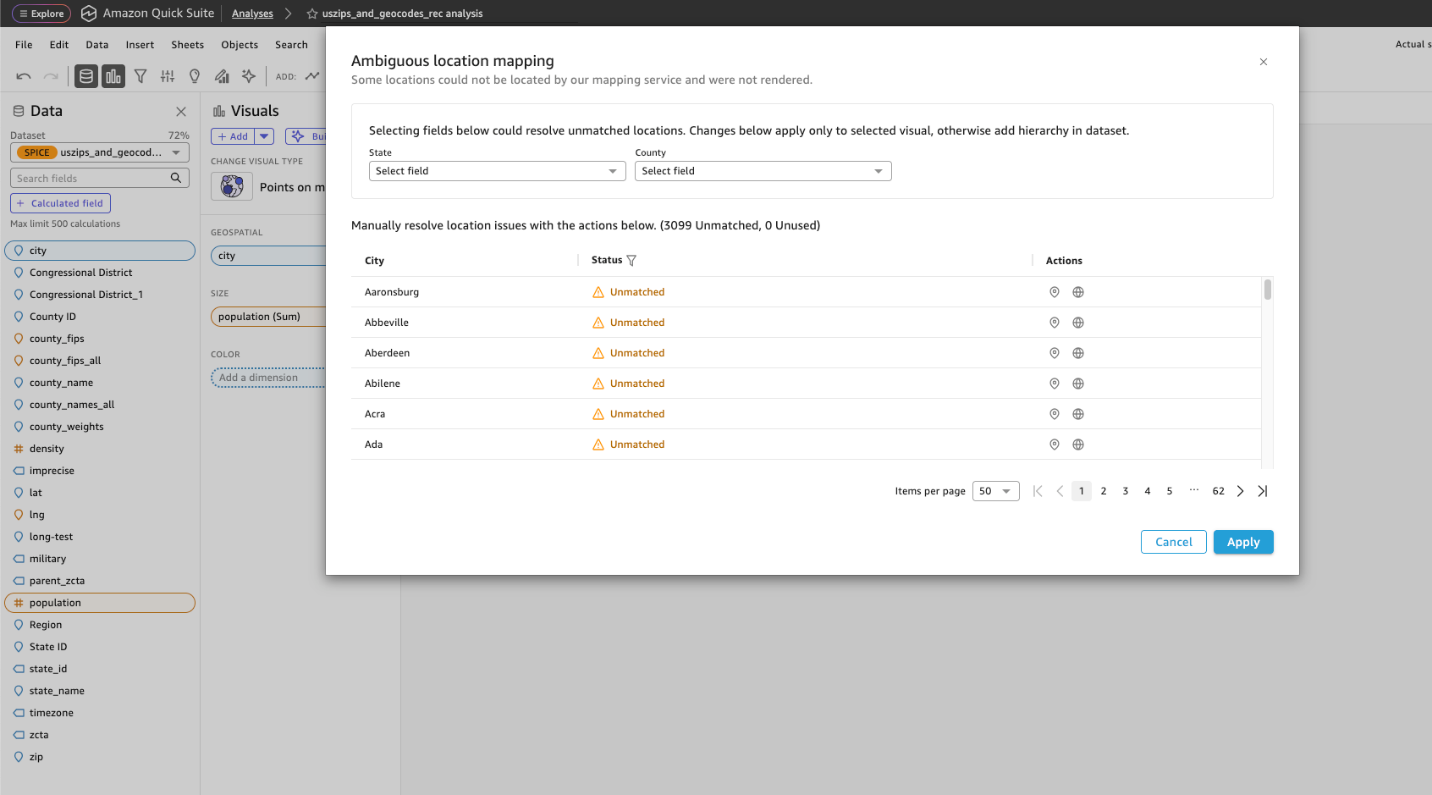
The ambiguous location mapping panel displays a list of locations that need additional context for accurate plotting. It offers three methods to resolve ambiguous locations:
- Add supporting geospatial fields – You can include additional geospatial field such as
StateorCountryby choosing it from the dropdown list. Quick Sight will add the field into a location hierarchy in the visual and reduce the number of unmatched locations based on this additional context. For example, addingStatehelps identify the location of the city Abbeville because it exists in multiple states in the US. Consider using this approach for a dataset with an existing hierarchical data such as locations organized by city, state, and country.
- Search for specific locations – Use the match location action to find the exact location from the geographical database in Quick Sight. Choose from a list of matching results that show the complete geographical hierarchy. Consider using this approach for a dataset that has several ambiguous locations, because it provides direct control over location matching and resolution.
- Enter exact latitude and longitude values for precise location mapping – You can provide latitude and longitude to specify coordinate data for your locations to achieve the highest accuracy in data plotting. Consider using this approach for precise location requirements or custom locations that might not exist in standard geographical databases. This method is particularly valuable when working with specialized locations that require exact geographical positioning. This method is only available for the points on map visual because the filled map doesn’t support latitude and longitude.
Understanding location mapping status
When working with location mapping in Quick Sight, you will see three different statuses of the locations: Unmatched, Matched, and Unused. Let’s explore each status and understand when they occur.
All ambiguous locations initially appear as Unmatched in the Ambiguous location mapping pane. These are locations that Quick Sight can’t automatically plot without additional context.
After you resolve an ambiguous location by providing additional context, the number of Unmatched locations reduces or becomes 0. You can see whether the location was matched by location field or latitude and longitude.
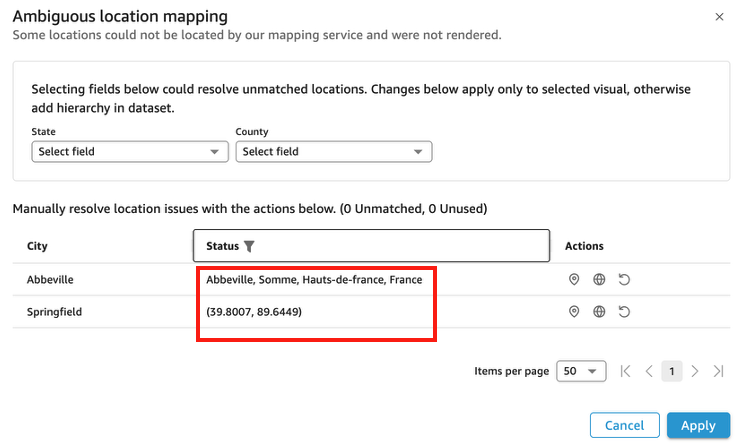
The Unused status appears when changes to your visual’s data affect previously defined location mappings. This can occur through several different scenarios in your Quick Sight analysis. When you update the geospatial hierarchy in your visual, perhaps by adding or removing levels, existing location mappings might become unused as the geographical context changes. In the following example, the location mappings were not used because the additional geospatial field state was used to identify those two cities.
Similarly, adding a filter to your visual can alter the displayed dataset, potentially making some location mappings temporarily irrelevant. Dataset refreshes can also trigger this status change; when your underlying data is updated, some previously mapped locations might no longer exist in the current dataset, causing their mappings to become unused. In all these cases, Quick Sight preserves these unused mappings, allowing them to become active again if the data conditions return to their original state.
Key considerations
Although this feature is useful for identifying ambiguous locations, several factors must be considered:
- The location mapping configurations are visual-specific rather than dataset-wide, meaning they only apply to the individual visuals where they’re implemented. When you create a new map visual, the mapping configurations will not automatically carry over.
- When using the Import visual function to bring a map visual into another analysis, the location mapping settings from the original visual won’t be included in the new visual. However, location mapping configurations will be included in the JSON when you are using an API to describe the analysis definition or dashboard definition.
- Each map visual can support up to 200 location mappings. If you have more than 200 unmatched locations, consider either including an additional geospatial field in your dataset or using latitude and longitude coordinates instead.
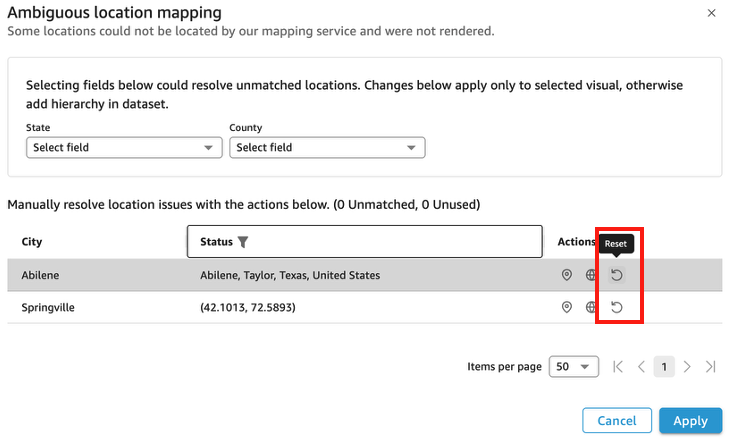
Reset location mappings
To reset location mapping, choose Geo data match, filter the matched locations, then choose the reset icon. This will clear previously configured match location selections as well as custom latitude and longitude entries you might have added.
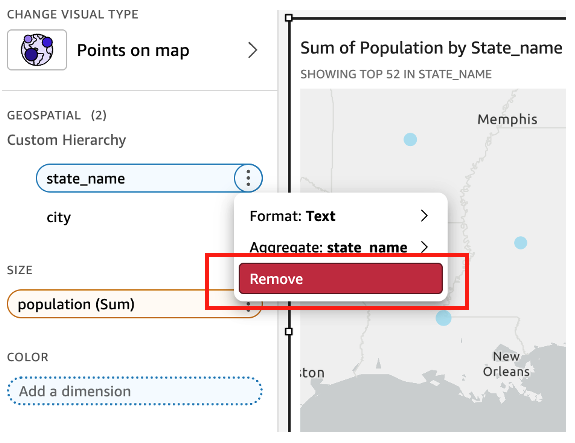
To remove additional geospatial fields such as state, choose the visual element directly. On the options menu (three dots), choose Remove.
Conclusion
In this post, we explored how to resolve ambiguous location mapping in Quick Sight. This functionality helps you accurately visualize geographical data when dealing with ambiguous location names in your datasets. By following the steps outlined in this post, you can make sure your map visuals correctly display locations, leading to more accurate geospatial insights in your dashboards. This functionality is invaluable for dashboard developers who need to maintain data integrity in their geospatial visuals, especially when dealing with cities that exist in multiple states or countries.
To learn more about the mapping capabilities in Quick Sight, refer to Geospatial troubleshooting documentation. You can also visit the Amazon Quick Suite Community to ask and answer questions, connect with peers, and stay updated on the newest features and resources.
About the authors
 Roy Yung is a Senior Specialist Solutions Architect for Amazon Quick Sight. Roy has over 10 years of experience implementing enterprise business intelligence (BI) solutions. Prior to AWS, Roy delivered BI and data platform solutions in the insurance, banking, aviation, and retail industries.
 Priyanka Bettaswamygowda is a Solutions Architect at AWS and has a great passion for Amazon Quick Sight. Priyanka works with customers across the UK regional public sector to help adopt cloud technologies and accelerate innovation.
 Amit Makashir is a SDE on the Amazon Quick Suite visualization team, specializing in geospatial visuals and data experiences that help customers understand location-based insights. He’s naturally drawn to maps, places, and problem-solving in the spatial domain, which shapes much of his work. Outside the office, he enjoys the outdoors—whether hiking, exploring new destinations, or taking long scenic drives.