AWS Business Intelligence Blog
Build conditional analytics in Amazon Quick Suite using advanced filtering
Amazon Quick Sight, the business intelligence (BI) component of Amazon Quick Suite, provides powerful tools to create interactive dashboards with capabilities like filtering, conditional analytics, and parameter-driven navigation.
This blog post demonstrates how to combine filters with calculated fields for precise data segmentation, control visual displays based on context, implement parameter-based navigation across dashboards, and integrate the Quick Suite chat agent for natural language querying. It provides practical techniques that BI developers can use to build more effective and responsive dashboards based on user actions and underlying data.
Solution overview
The core of BI (data analytics and visualization) effectively presents the results of SQL queries. In this context, a filter in Quick Sight is analogous to the WHERE or HAVING clause in SQL. Filters control which subset of data is displayed in visualizations, which helps users focus on relevant information and improving performance. Filters can be applied at multiple scopes, including the dataset, all sheets of an analysis, a single sheet, or individual visuals. They also operate at different stages of evaluation, such as normal analysis filters (equivalent to WHERE), top/bottom N filters (temporary results similar to a subquery used in WHERE), or filters based on aggregated calculations (equivalent to HAVING). Filter types include categorical, numeric, date, and custom calculated filters. It’s important to understand the evaluation order, because Quick Sight processes filters in a specific sequence based on both scope and stage. Generally, dataset filters are applied first, reducing the data loaded into the analysis. Analysis filters then refine the data for the entire dashboard, followed by visual filters that affect individual visuals. Within a single visual, the different stages, such as normal analysis filters, top/bottom N filters, and aggregated calculation filters, are applied in a defined order. Cascading filters, where the output of one filter influences the available elements of another, also follow this sequence, which ensure that dependency of selection in one filter to subsequent filters. This evaluation order makes sure filters work consistently when used together.
In the following sections, we show how to combine filters with calculated fields, control visual displays based on context, implement parameter-based navigation across dashboards, and integrate the Quick Suite chat agent for natural language querying.
Prerequisites
To follow along with the solution presented in this post, you must meet the following requirements:
- Quick Sight access – You must have access to Quick Sight with an Author or Author Pro role.
- Quick Sight edition – This solution requires Quick Sight Enterprise Edition.
- Sample dataset – You must have a dataset with a mix of categorical and numerical fields to follow the filtering, formatting, and parameter-based navigation examples. If you don’t have a dataset prepared, you can use the public Olympic Games dataset.
Make sure your environment is properly set up before proceeding.
Conditional rendering of the values of a filter or control
This section demonstrates how to construct advanced filters that extend out-of-the-box features by combining calculated fields and parameters to adapt dynamically to the data context. In many analytics use cases, we need to categorize records into different segments. However, a common challenge arises when a single record belongs to multiple segments. For example, in Olympic games, water polo is both a team sport and a water sport. In traditional filtering models, handling this kind of multi-category association often requires duplicating records, which can distort aggregations and complicate analysis. To avoid this, we designed a solution using bitwise encoding, which allows each record to be represented as a unique integer that encodes its segment memberships, without creating any duplicate rows.
Implement the sport segments
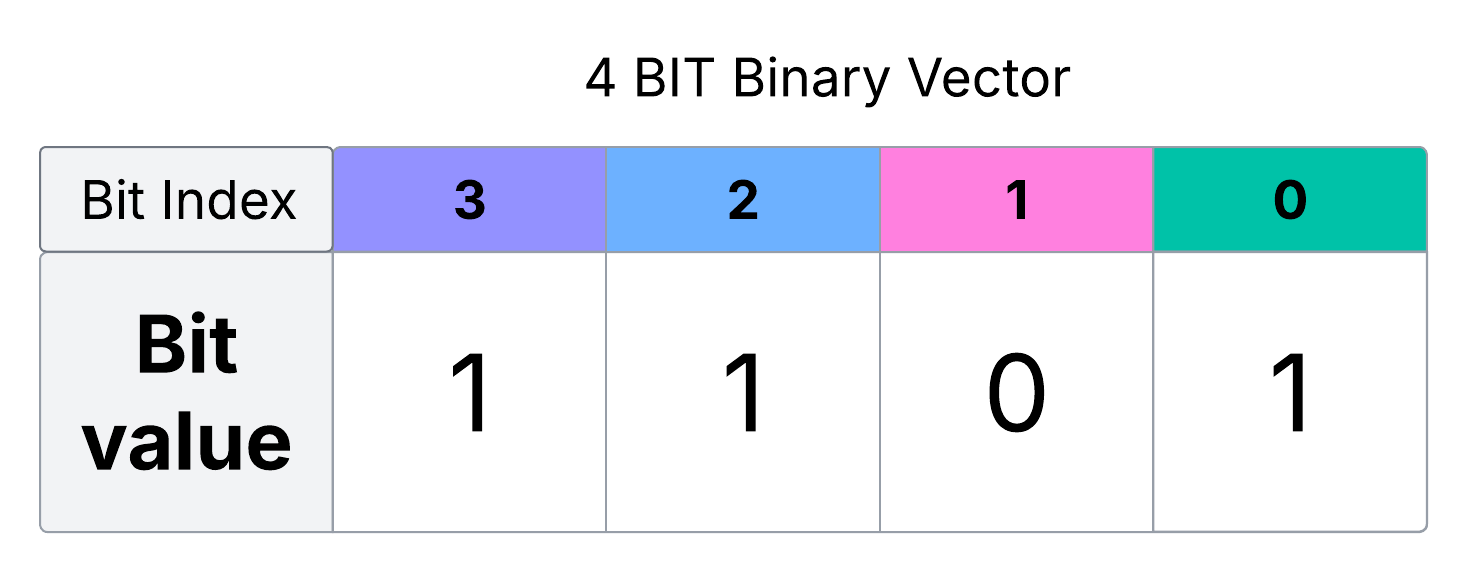
To enable dynamic segmentation of sports categories within a single analysis, each sport is assigned a 4-bit binary vector that represents its membership across multiple segments. Each bit corresponds to a specific category:
- Water Sports – For example, Water Polo, Diving, Swimming, Triathlon, Sailing
- Ball Games – For example, Football, Basketball, Volleyball, Water Polo, Tennis, Golf
- Team Sports – For example, Football, Basketball, Volleyball, Water Polo
- All Sports – All sports provided in the database
If a sport belongs to a segment, the corresponding bit is set to 1; otherwise, it remains 0. This results in a bitmask representation that alleviates the need to duplicate records for multi-segment classification. The following figure shows the bit index and bit values of a 4-bit binary vector.
The following table shows the mapping between the sports and their corresponding bit indexes.
| Sports | Bit Index | Position Value in Decimal |
| Water Sports | Bit 3 | 23=8 |
| Ball Games | Bit 2 | 22=4 |
| Team Sports | Bit 1 | 21=2 |
| All Sports | Bit 0 | 20=1 |
For example: Water Polo belongs to all four segments and is represented as 1111 (15 in decimal), while Golf, which belongs only to All Sports and Ball Games, is 0101 (5 in decimal).
| Sports | Binary | Decimal | Explanation |
| Water Polo | 15 | Belongs to all four segments | |
| Golf | 5 | Belongs only to All Sports and Ball Games |
|
| Football | 7 | Belongs only to All Sports, Ball Games, and Team Sports |
|
| Swimming | 9 | Belongs only to All Sports and Water Sports |
|
| … |
This compact bitwise representation makes it possible to encode multiple segment relationships in a single field. To build this logic in Quick Sight, complete the following steps:
- Create a calculated field called
Sport Segmentusing a bitmask formula. Each segment is assigned a bit position: 1 forAll Sports, 2 forTeam Sports, 4 forBall Games, and 8 forWater Sports. Using nestedifelsestatements, we calculate the final integer value per sport based on which segments it belongs to.
- Create a parameter named
SegmentSelectionwith values likeAll Sports,Team Sports,Ball Games, andWater Sports. Users can choose a segment from a dropdown menu. - To apply this segmentation interactively, define another calculated field called
segmentChoicethat maps each segment name to its corresponding bit value (for example,Ball Games= 4):
- Compute a
segmentIndicatorusing a bitwise check: divide the sport’sSport Segmentvalue by the selectedsegmentChoice, take the floor, and applymod 2to extract the bit at the corresponding position. Create the calculated fieldsegmentIndicator=mod(floor({Sport Segment}/segmentChoice), 2). A filter is applied to show only records wheresegmentIndicator = 1, meaning the sport belongs to the selected segment. This method supports fast, scalable filtering logic using binary arithmetic, without complex joins or lookup tables.
The following screenshot shows the results when a user chooses Ball Games from the control.

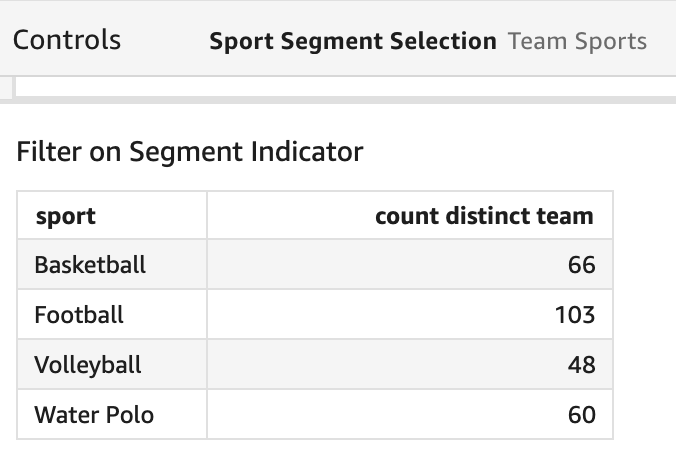
The following screenshot shows the results when a user chooses Team Sports from the control.
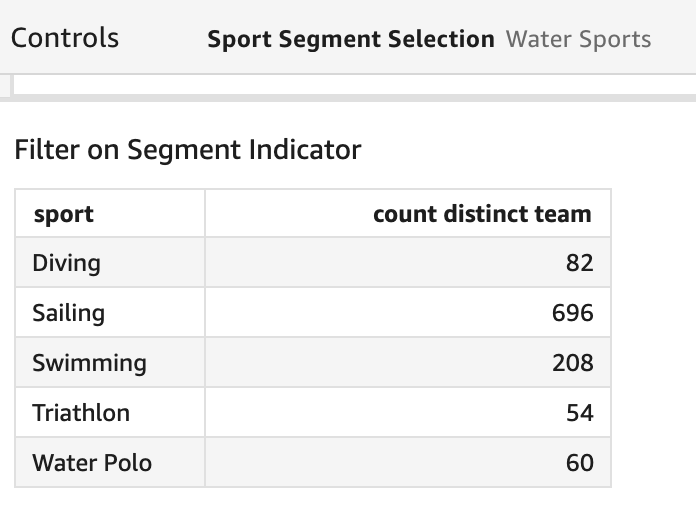
The following screenshot shows the results when a user chooses Water Sports from the control.
Open the sample dashboard and go to the “Segmentation” sheet.
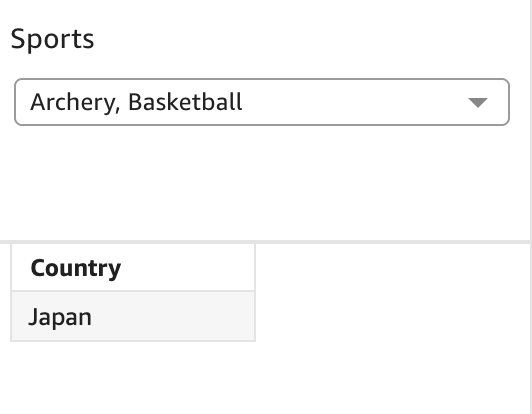
Filter for A AND B in Quick Sight
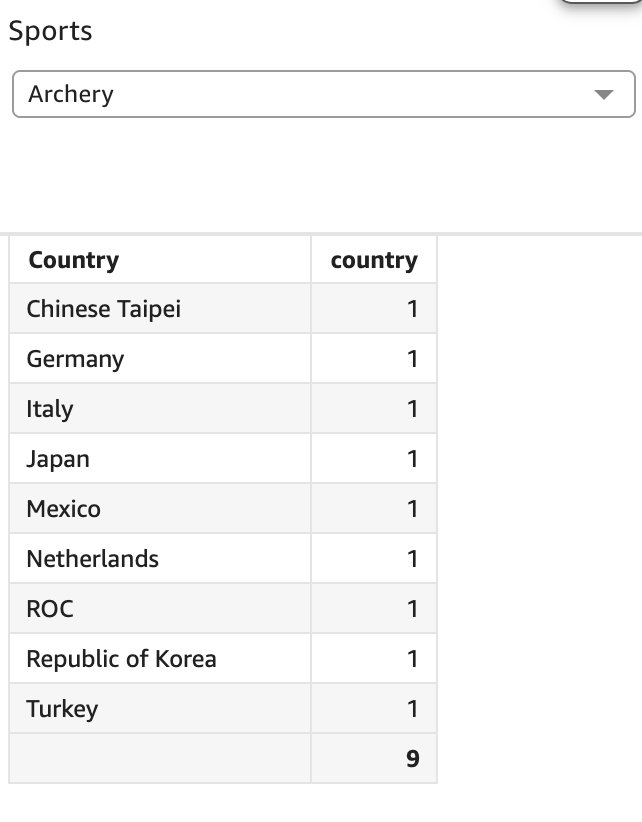
In Quick Sight, applying a multi-value filter typically operates as an OR condition, returning results where a field matches any of the selected values. For example, if you choose Archery and Basketball as the filter on Sports, Quick Sight will return all countries that play either sport. However, in some use cases, we need to identify records that meet all selected conditions simultaneously, such as finding countries or teams that participate in both archery and basketball. This A AND B filtering logic isn’t supported natively, but you can achieve it using calculated fields.
As shown in the following screenshot, nine countries participate in archery.
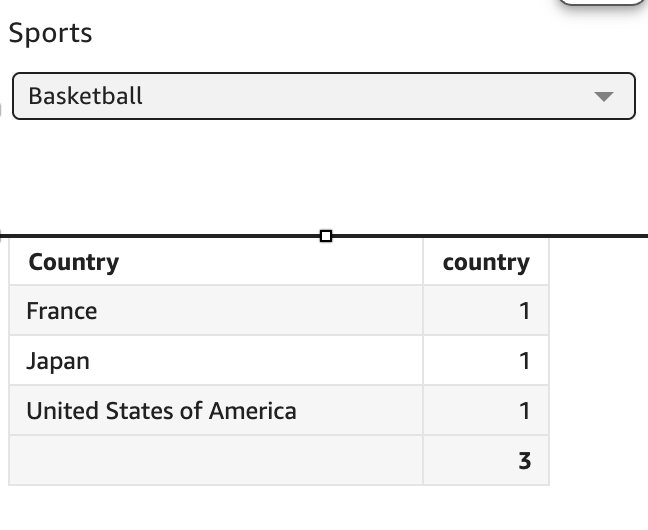
As shown in the following screenshot, three countries participate in basketball.
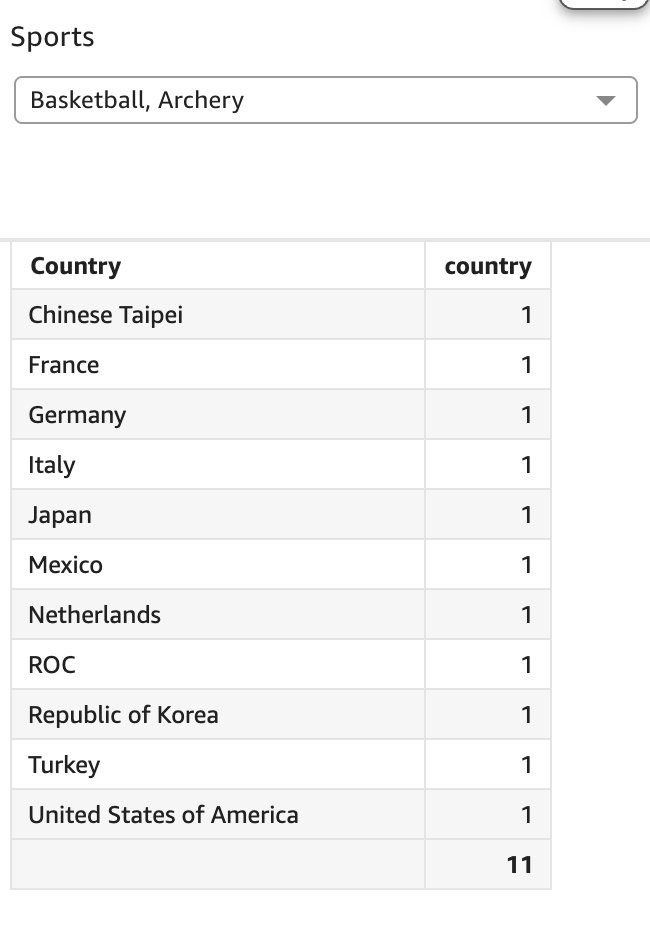
If you choose both Archery and Basketball in the Sports filter, Quick Sight will return 11 countries—because it applies an OR condition by default, showing all countries that play either sport.
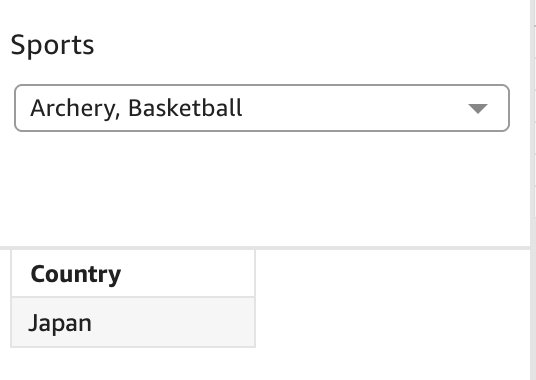
However, what we want is to return only the country (Japan) that participates in both sports: archery and basketball.
In the following steps, we walk through implementing AND-based filtering logic in Quick Sight, returning only the records that match all selected values:
- Create a calculated field called
Count Sportsthat calculates the total number of sports selected in the filter, using the expressionDistinctCountOver(Sports, [], PRE_AGG). - Create another calculated field called
Count Sports per Countrythat determines how many of the selected sports are associated with each country, with the expressionDistinctCountOver(Sports, [Country], PRE_AGG). - Define a third calculated field named
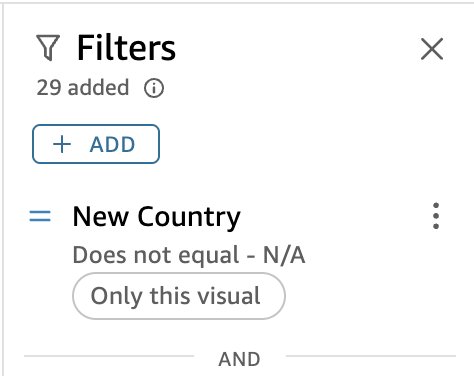
New Countrythat returns the country name only if it is associated with all the selected sports—otherwise, it outputsN/A—using the expressionifelse(Count Sports = Count Sports per Country, Country, 'N/A'). - In the visual, use
"Sports"as a filter and group by"New Country". Add an additional filter to exclude the'N/A'values from the"New Country"field.
As a result, when a user selects multiple sports, the visual will display only those countries that participate in all selected sports. This effectively transforms the default OR logic into an AND logic, enabling intersection-style analysis without requiring any changes to your data model.

In the visual formatting, rename the title “New Country” to be “Country.”

Open the sample dashboard and go to the “A AND B” sheet.
Build multiple sheets dashboards with context-aware navigation
The purpose of this section is to help BI authors link navigation actions to specific sheets based on the content of visuals, using predefined conditions. By default, an author can create only one “Select actions” configuration per visual.
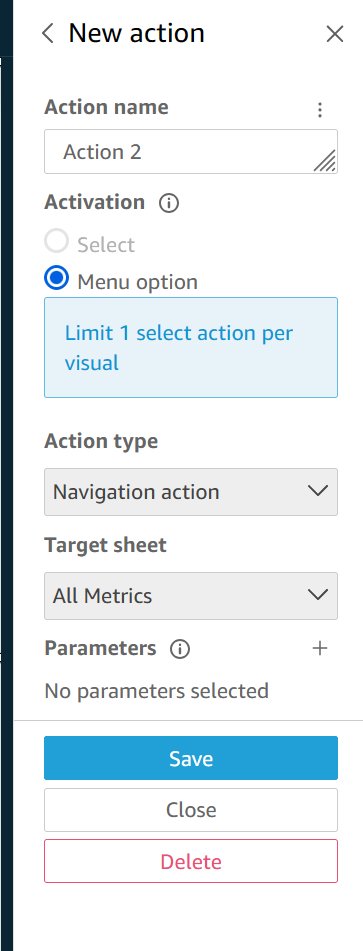
To address this constraint, we defined a solution that enables navigation to different sheets or external webpages based on categorical values, which is triggered by a single-click “Select action.” This is achieved by using a conditional navigation action navigate to different sheets of the same dashboard. This approach provides a scalable way to build dashboards with context-aware navigations. Complete the following steps:
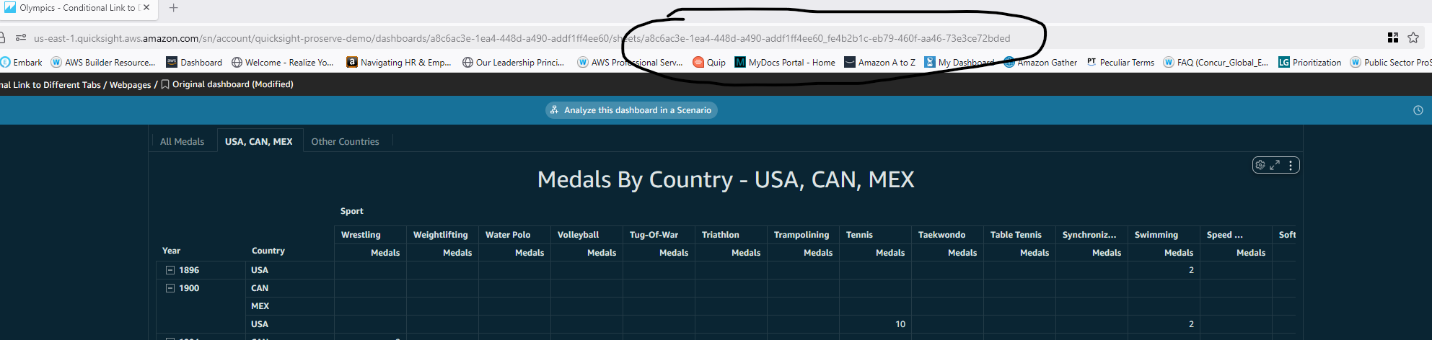
- Identify the sheet IDs:
- Publish the analysis to a dashboard to be able to get the ID of the dashboard.
- Navigate to the web address to identify the dashboard ID.
- Copy the address and note it down for later. The address should be
https://<<region name>>.quicksight.aws.amazon.com/sn/account/<<account name>>/dashboards/<<dashboard ID>>.
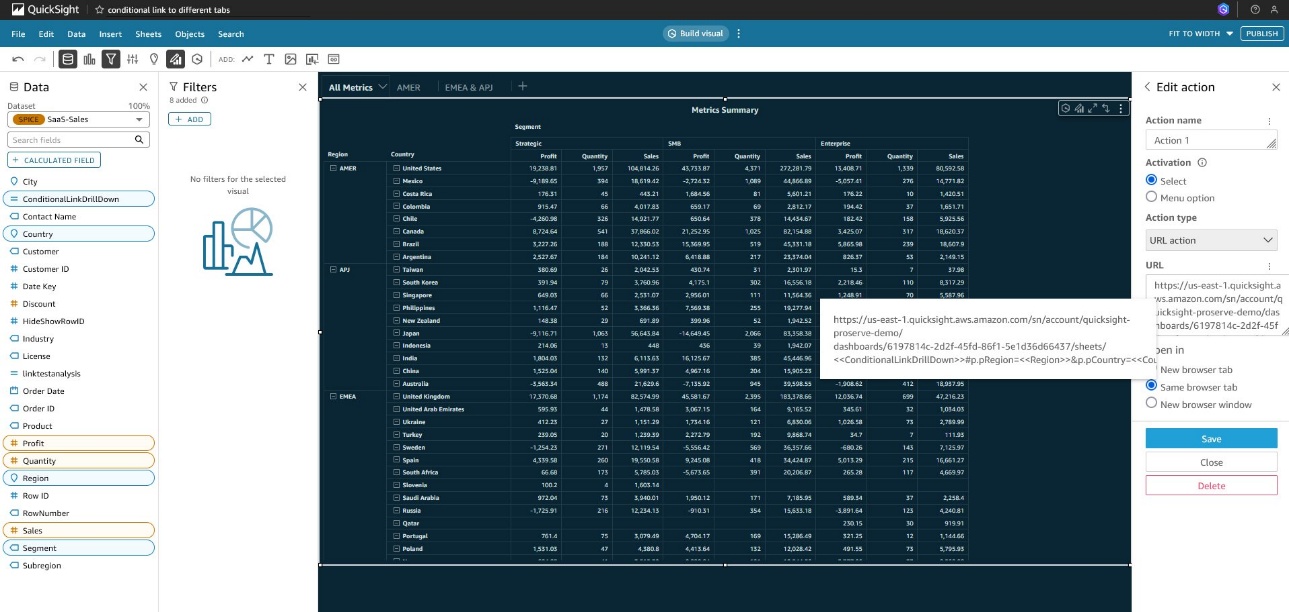
- To create the navigation action, create a “Select action” with the URL action type.
- Identify the sheet ID for the two different sheets in the dashboard.
- Now that you have the dashboard URL and the sheet ID for both sheets, you can create a calculated field for navigating to the two sheets. Here, use an
ifelsestatement to return the value of the sheet ID for the first sheet; otherwise, return the value of the sheet ID for the second sheet:
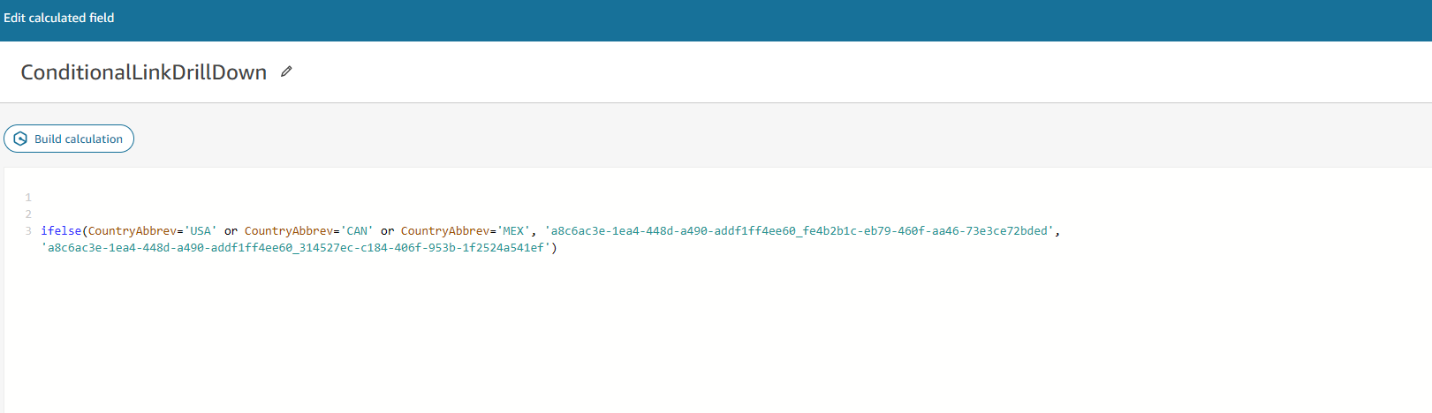
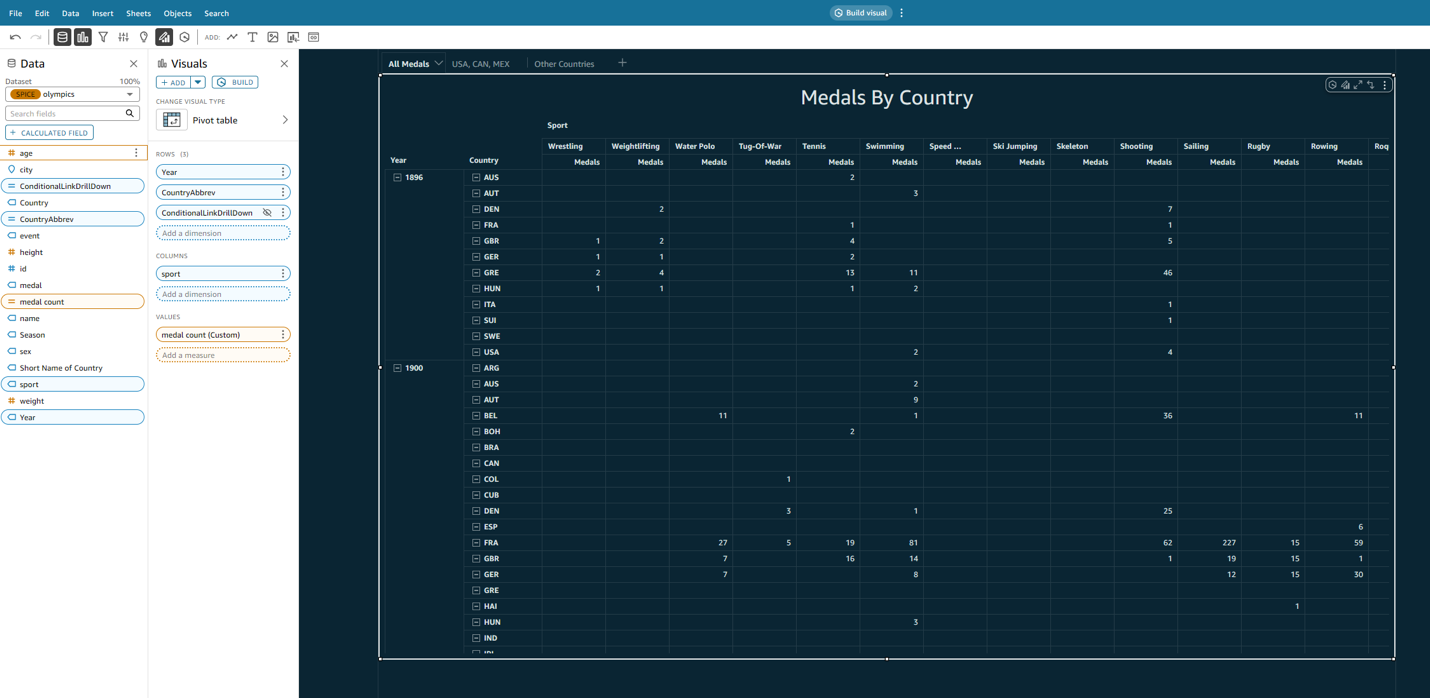
- In the pivot table visual, insert the calculated field you created called
ConditionalLinkDrillDownand then hide this field. - To ensure that when the user clicks on the data field in the “All Medals” sheet that the correct filters are applied to other sheets, you must pass in the parameters from the first sheet.
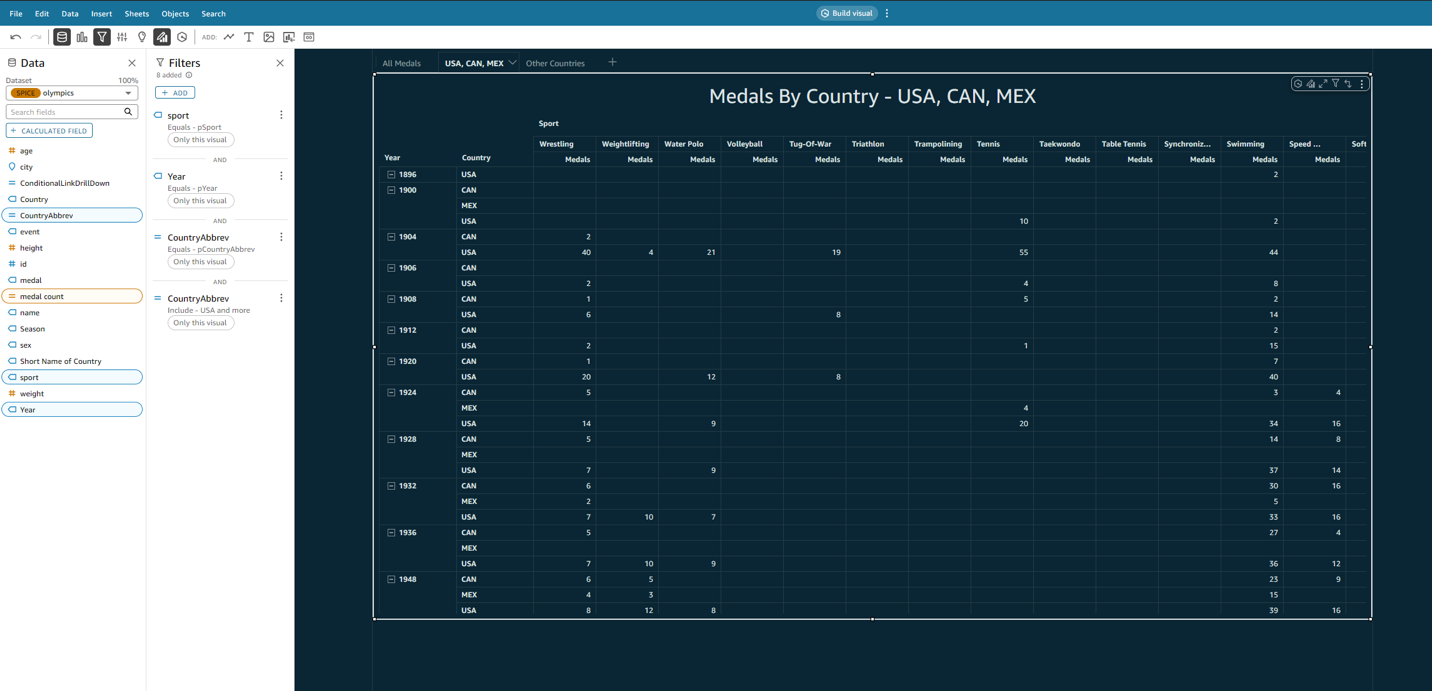
The following screenshots illustrate the filters for the various sheets:
- “USA, CAN, MEX” sheet
- Other countries sheet

- After identifying the necessary parameters, you need to pass in the parameters after the <<ConditionalLinkDrillDown>> part of the URL. Here, enter
#followed byp.parameter =<<field associated with the parameter>>. When adding multiple parameters and when using multiple values for the same parameter, use the delimiter &.
Now, when a user clicks on a record in the “All Medals” sheet, they will be directed to the “USA, CAN, MEX” sheet if the record is associated with those three countries, and will be directed to the other countries sheet if the record is associated with countries other than USA, Canada, or Mexico.
Use Quick Suite topics with custom instructions to include or exclude specific data
Quick Suite topics are collections of one or more datasets that define a specific subject area your business users can explore and ask questions about. However, ambiguity in business terminology can lead to inaccurate results if the model misinterprets user intent.
In sales scenarios, two examples of such ambiguity are:
- VIP – Refers specifically to top tier customers managed by the sales team
- Presidential election impact – Refers only to activity during January 2024 to December 2024
These aren’t always encoded directly in the data model, yet we still want the topic to understand them consistently. This is where custom instructions come in: authors can guide how Quick Sight interprets certain terms, even if the underlying dataset doesn’t contain explicit filters or tags for those concepts. Consider typical sales-oriented queries:
- “Show VIP sales?”
- “Sales during presidential election?”
Without additional logic, Quick Sight can’t interpret “VIP.” Similarly, the system might not know which election you’re referencing, or which date range is relevant. Even when the dataset doesn’t explicitly define these concepts, custom instructions help authors enforce business-specific interpretations. To add custom instructions, complete the following steps:
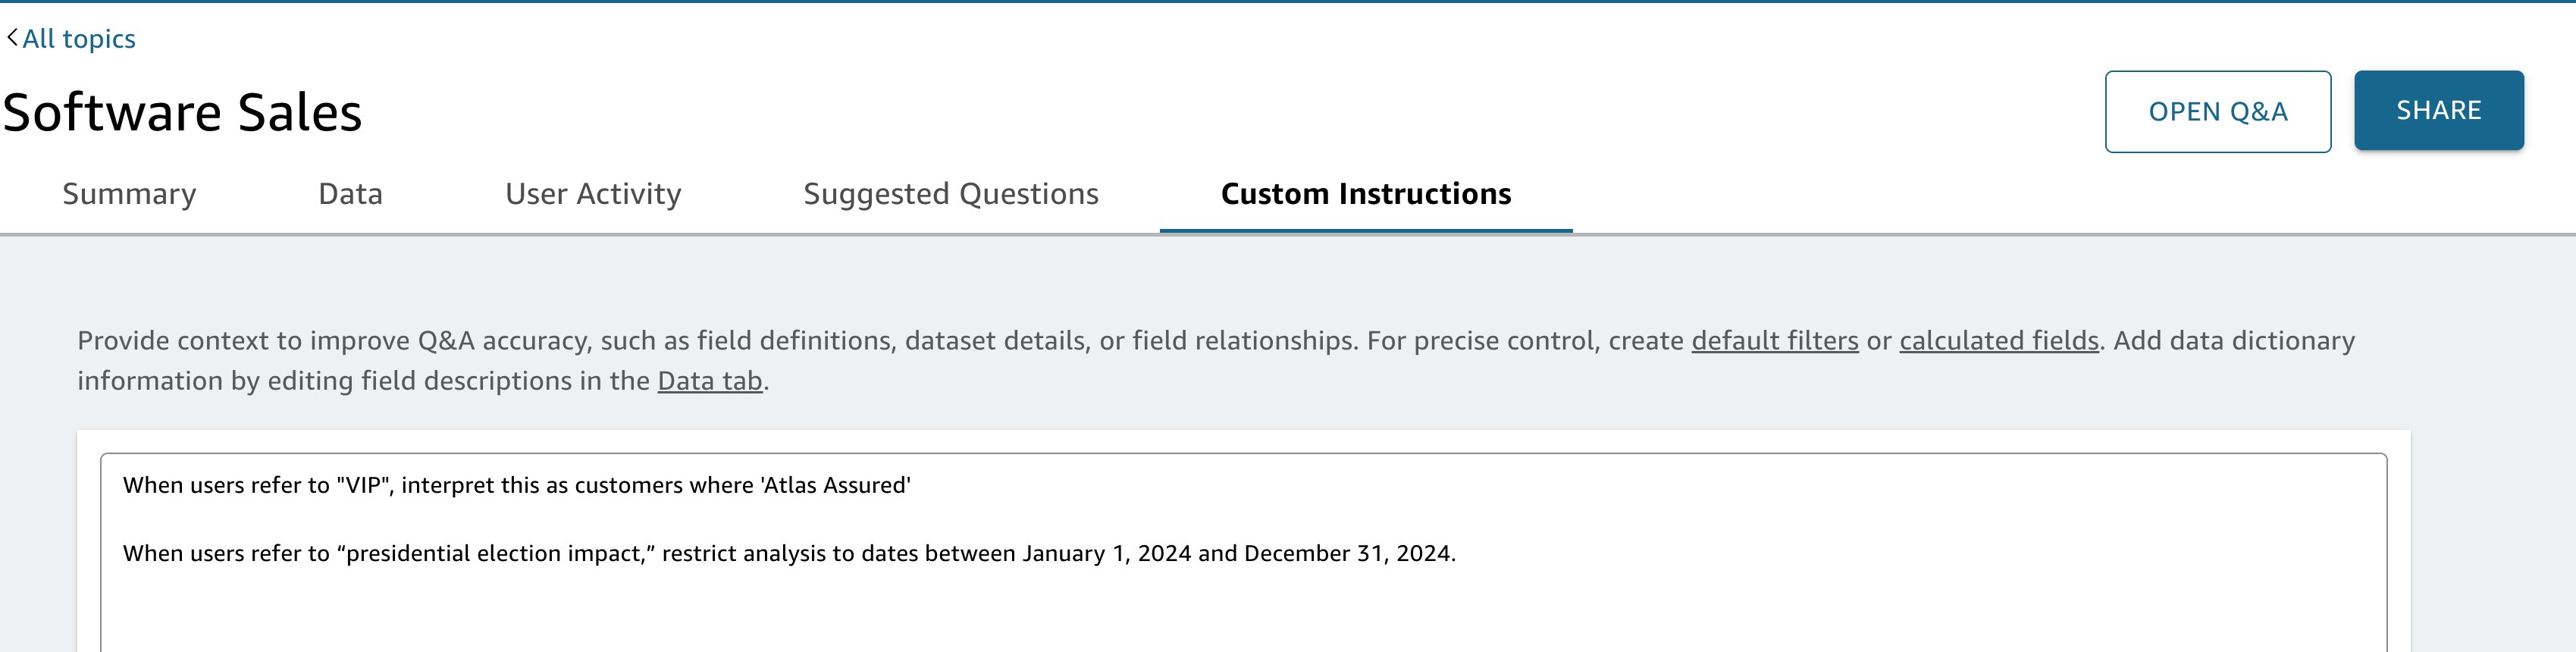
- On the Quick Sight console, go to the topic associated with your sales dataset.
- On the Custom Instructions tab, add the following:
This facilitates consistent filtering, even if “VIP” isn’t a literal field or category in the dataset.
- Next, add another instruction for the election impact time window:
This avoids incorrect assumptions about historical elections or post-2024 timeframes.
These instructions act like invisible filters or transformers applied at query time. Let’s explore how Quick Sight processes a few example questions after these rules are in place, as illustrated in the following table.
| User Question | Behind-the-Scenes Logic |
| “Show VIP sales” | Adds filter: Customer = Atlas Assured |
| “Sales during presidential election?” | Adds filter: CloseDate BETWEEN '2024-01-01' AND '2024-12-31' |
Chat agents integrate with topics to deliver business-aware analytics through large language models. When you connect custom instructions to topics like software sales, the chat agent automatically applies your predefined business rules during every query interaction.
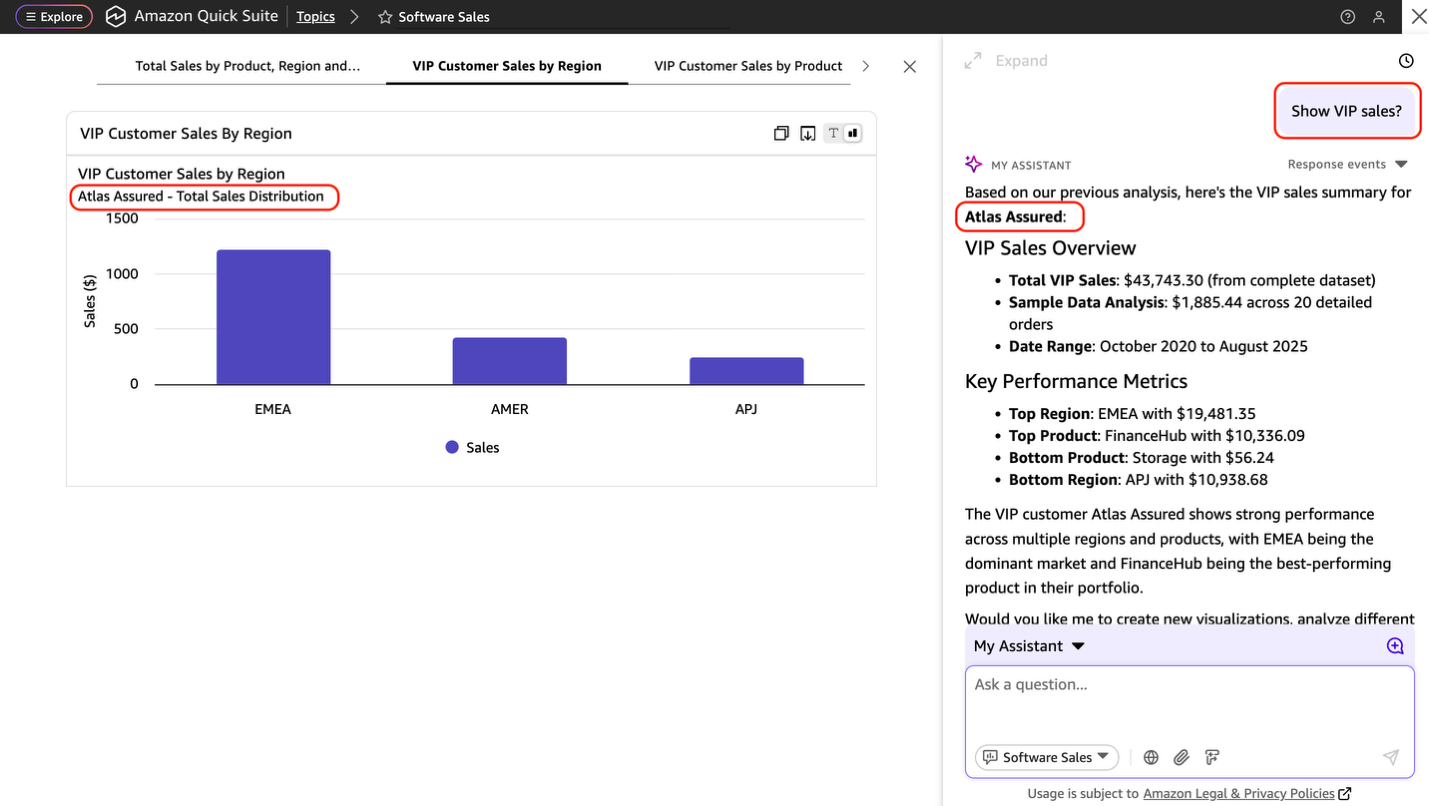
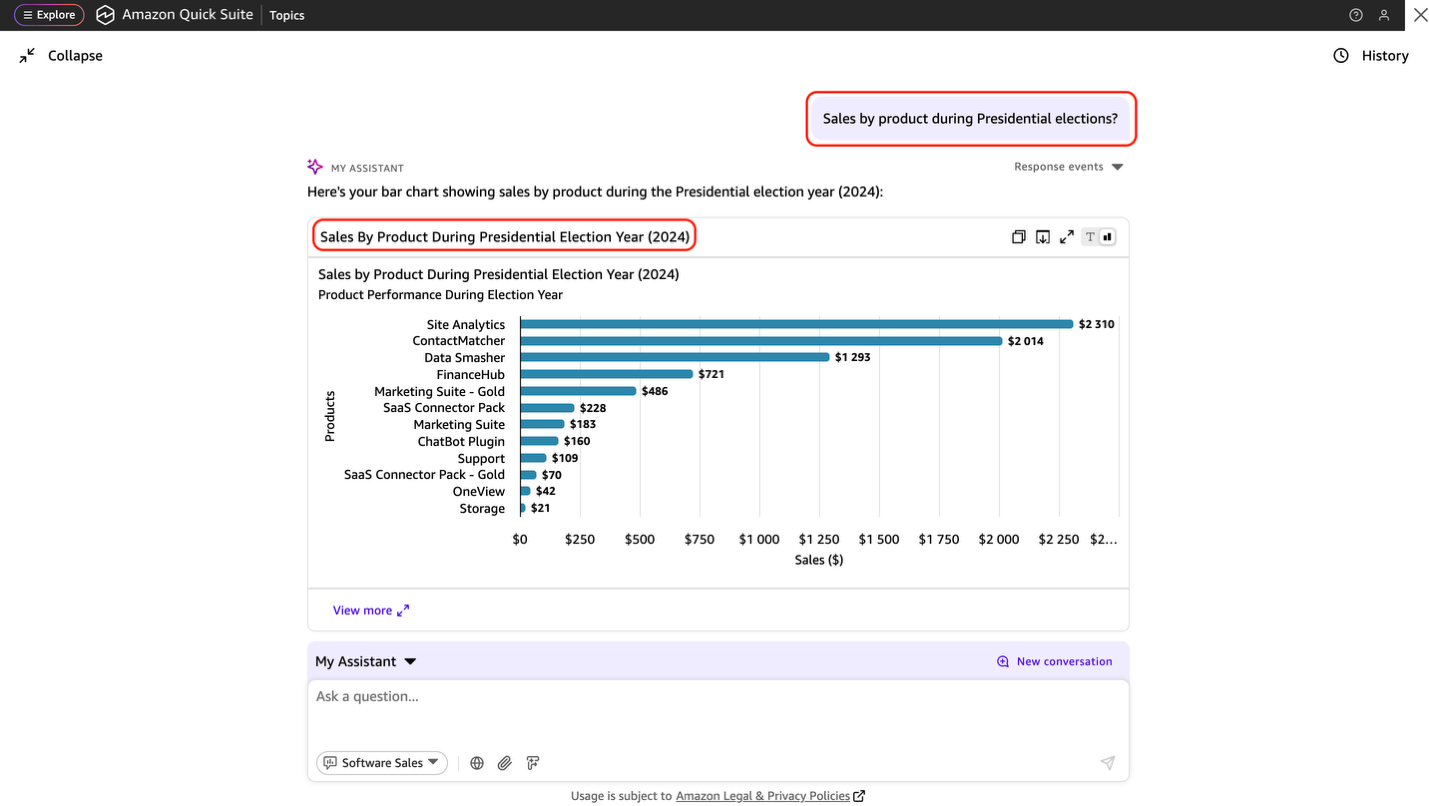
Even if your dataset doesn’t have a literal VIP column or a presidential election flag, these custom rules bring in business-aware logic without modifying the underlying data model.
Clean up
To avoid incurring ongoing charges after completing the tutorial, delete the resources you created during the walkthrough:
- Delete any sample datasets or custom data sources that are no longer needed.
- If your dataset was pulled from Amazon Simple Storage Service (Amazon S3) or connected to other AWS services, be sure to delete any temporary files, tables, or queries created for this walkthrough.
Conclusion
Quick Sight offers flexible ways to enrich data analysis by combining natural language, data modeling, and custom filtering logic. With custom instructions in Quick Sight, teams can enhance user experience by embedding domain-specific knowledge directly into natural language queries, providing accurate and business-aligned responses. At the data modeling layer, techniques like bitwise encoding enable efficient representation of many-to-many classifications without requiring any additional reference tables, simplifying filters, preserving data integrity, and supporting segmentation through parameters and calculated fields. Finally, by extending the default filtering behavior of Quick Sight, users can implement AND-based multi-select filters to isolate results that meet all selected conditions, delivering deeper insights without altering the dataset. Together, these approaches empower organizations to build scalable, precise, and context-aware dashboards that align closely with business needs.Try out these features for your own use case, and share your feedback in the comments.
About the authors
 Ying Wang is a Senior Specialist Solutions Architect in the Generative AI organization at AWS, specializing in Amazon Quick Suite to support large enterprise, ISV and public sector customers. She brings 16 years of experience in data analytics and data science, with a strong background as a data architect and software development engineering manager. As a data architect, Ying helped customers design and scale enterprise data architecture solutions in the cloud. In her role as an engineering manager, she enabled customers to unlock the power of their data through Quick Suite analytical engine by delivering new features and driving product innovation from both engineering and product perspectives.
 Michael Wong is an Associate Delivery Consultant in the AWS Professional Services organization, specializing in Data Analytics to support enterprise and public sector customers. He brings extensive experience in cloud data architecture and analytics, with a strong background in data visualization and business intelligence solutions. As a data analytics specialist, Michael has helped customers design and implement scalable data lake architectures and migrate legacy reporting systems to modern cloud-based solutions. In his consulting role, he has delivered complex Amazon Quick Sight dashboards, developed data transformation pipelines using AWS Glue and SQL, and provided technical leadership on multi-faceted data integration projects across federal and state government agencies.
 Priya Kakarla is a Specialist Solutions Architect for Amazon Quick Suite, with experience spanning healthcare, finance, and digital-native businesses. She helps customers design and implement end-to-end Analytics solutions that drive data-informed decision-making. Passionate about empowering organizations through intuitive and scalable analytics, Priya is known for her strong customer obsession and commitment to delivering innovative, personalized solutions that achieve real business outcomes. Outside of work, Priya loves exploring new places, trying different cuisines, and spending quality time with her family and friends.