AWS Business Intelligence Blog
Use Amazon Redshift data sharing to enable Amazon Q in QuickSight across Regions
| All your trusted BI capabilities of Amazon QuickSight now come with powerful new AI features that integrate chat agents, deep research, and automation in one seamless experience with Amazon Quick Suite! Learn more » |
In this post, we discuss how to find data insights effectively using Amazon QuickSight and Amazon Redshift data sharing. This can be an effective approach in the following scenarios:
- Your data is centrally processed and managed in an extract, transform, and load (ETL) cluster, and relevant data is getting shared to different business groups to achieve workload isolation across diverse analytics use cases
- Your data is in one AWS Region and the newly launched features are available in another Region
QuickSight is a cloud-scale business intelligence (BI) service that delivers insights to stakeholders and other users, with capabilities including interactive dashboards, natural language queries, and Amazon Q integration for insights.
Amazon Redshift is a fast, scalable, secure, and fully managed cloud data warehouse available in two options: provisioned (traditional node-based deployment) and serverless (automatically scaling capacity based on workload). Amazon Redshift data sharing offers a secure and straightforward way to share live data for reading across Redshift clusters. A Redshift producer cluster can share objects with one or more Redshift consumer clusters for read purposes without having to copy the data.
Introducing generative BI
Generative BI capabilities in QuickSight are provided through the availability of Amazon Bedrock with large language model (LLM) capabilities and Amazon Q in QuickSight. With Amazon Q in QuickSight, you can ask questions of your data using natural language, without having to write SQL queries or learn a BI tool. These capabilities make it straightforward for organizations to explore data, discover insights, and share them.
With the new generative BI capabilities in QuickSight, users of QuickSight can perform common tasks using natural language, including the following:
- Create an analysis to build visuals, calculations, and refine existing visuals in seconds with natural language
- Get an executive summary of key insights from a dashboard
- Ask questions about data to accelerate data-driven decisions with multi-visual answers
- Create and refine topics that use generative Q&A for dashboards
- Build, share, and view data stories that explain your data with visuals, insights, and ideas to help improve your business
For more information, refer to Using Generative BI with Amazon Q in QuickSight.
Solution overview
At the time of writing, Amazon Q in QuickSight is available only in specific Regions. With Amazon Redshift data sharing and a few additional configurations, you can use the generative BI features to find data insights just by asking questions in natural language across Regions. In this use case, we assume that the primary Region for the data is in ap-southeast-1, where our data gets processed and is accessible through a Redshift Serverless endpoint. We further enable these business users to find the data insights using natural language with Amazon Q in QuickSight in the us-east-1 Region.
The following diagram illustrates our solution architecture.
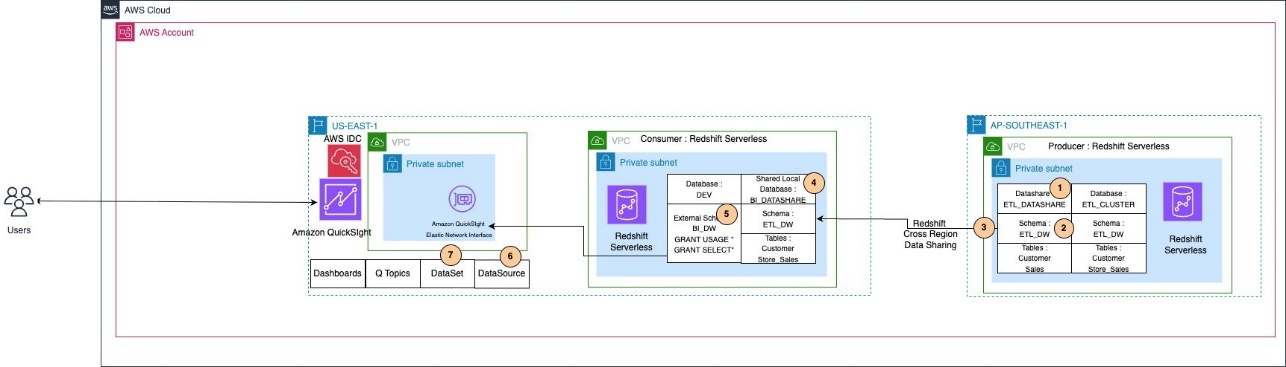
In our example, the Redshift Serverless endpoint (producer) is in the ap-southeast-1 Region with namespace ABCD-PRODUCEER-12345678, and the Redshift Serverless endpoint (consumer) is in the us-east-1 Region with namespace XYZ-CONSUMER-9876543.
Prerequisites
To implement this solution, you must have the following prerequisites:
- An AWS account
- A Redshift Serverless endpoint in the
ap-southeast-1Region as the producer - A Redshift Serverless endpoint in the
us-east-1Region as the consumer - Super user privilege or the
sys:secadminrole on the Redshift data warehouse - An Amazon QuickSight Enterprise Edition subscription in the
us-east-1Region - Virtual private cloud (VPC) connections between the Redshift Serverless instance and QuickSight
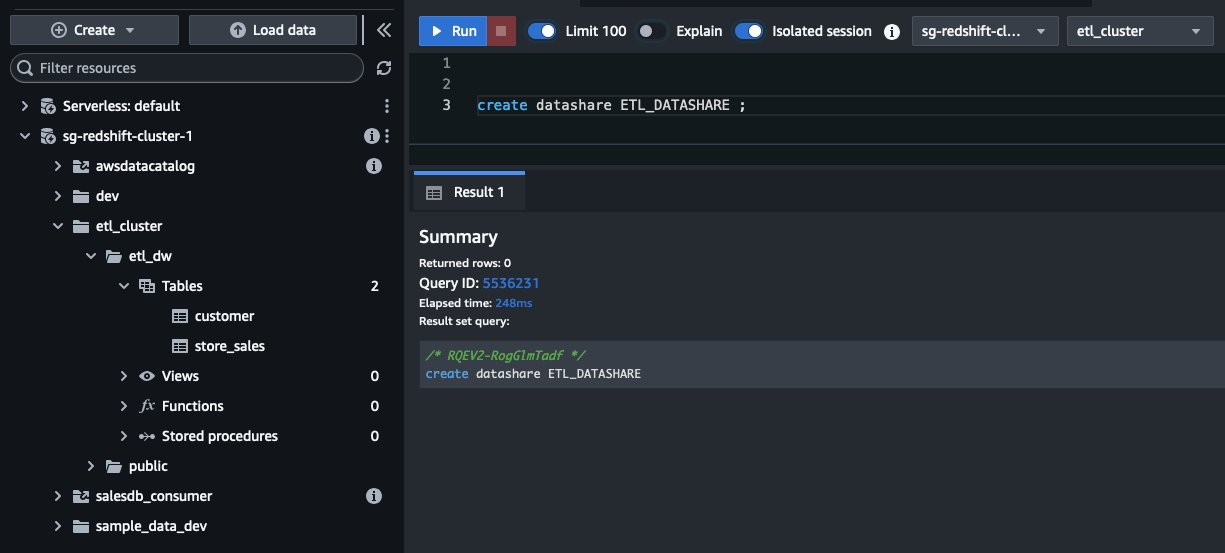
Create a datashare on the producer endpoint
The first step is to create the producer datashare in the Redshift Serverless endpoint in the ap-southeast-1 Region. After you connect to the endpoint, use the SQL editor and execute the following command:
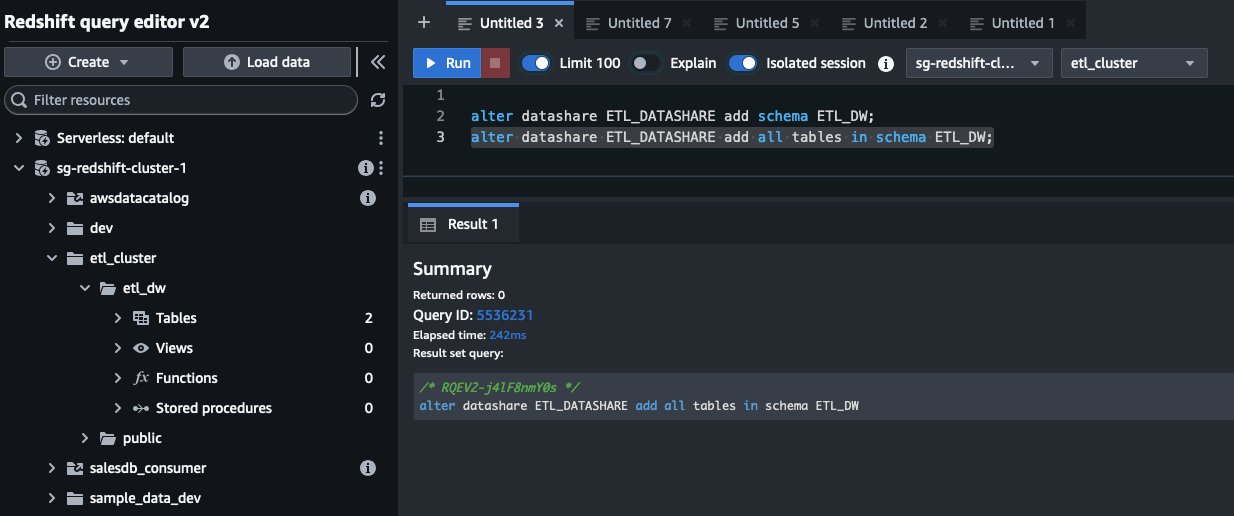
Identify your data in the producer endpoint
After you have identified the schema, table, and views that need to be analyzed and visualized using QuickSight, include them in your datashare. This step shares only the metadata, not the actual data. See the following code:
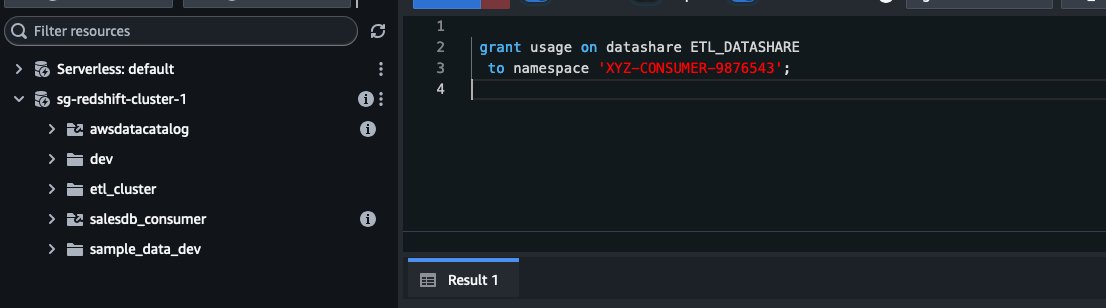
Grant datashare access on the producer endpoint
From your producer endpoint in the ap-southeast-1 Region, grant access to your consumer Redshift Serverless namespace in the us-east-1 Region:
Replace namespace-id with your Redshift Serverless namespace identifier from the us-east-1 Region. The namespace ID can be found on the Redshift Serverless console under Namespace configuration.
Verify datashare availability from the consumer endpoint
In your consumer Redshift Serverless endpoint in the us-east-1 Region, confirm the datashare is visible:
By running the SHOW DATASHARES command, we can see etl_datashare is visible in this Region and with share type as INBOUND. Always verify datashare availability before creating a database.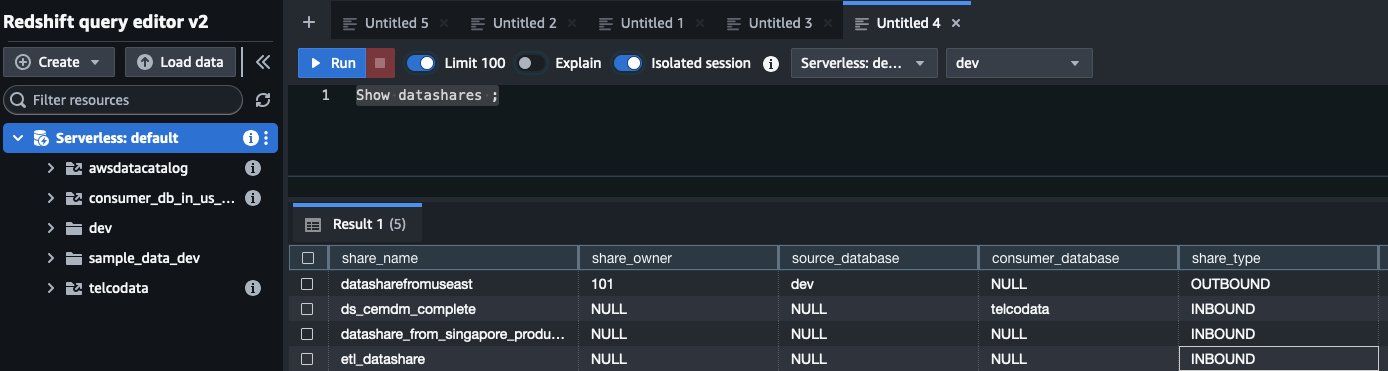
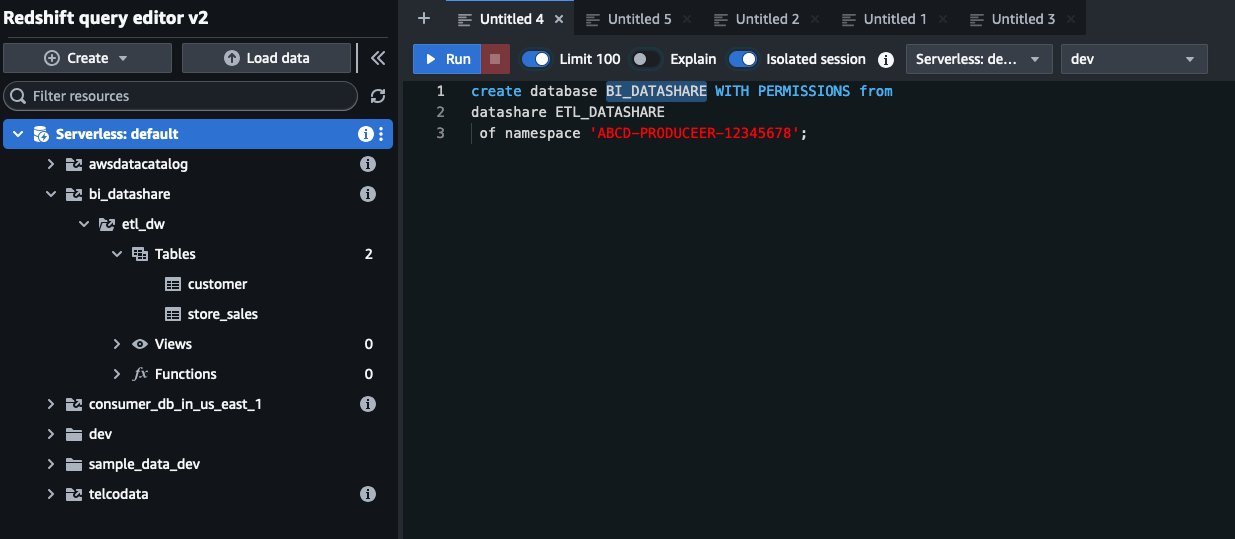
Create a consumer database
To start consuming the shared datashare, you must create a local database on the consumer Redshift Serverless endpoint in the us-east-1 Region. Similar to the previous datashare creation step, only metadata is shared in this step. Therefore, no data is copied nor transferred. When creating the local database, replace producer-namespace-id with the namespace of the Redshift Serverless endpoint in the ap-southeast-1 Region. Use WITH PERMISSIONS to enable fine-grained access control on the consumer endpoint. See the following code:
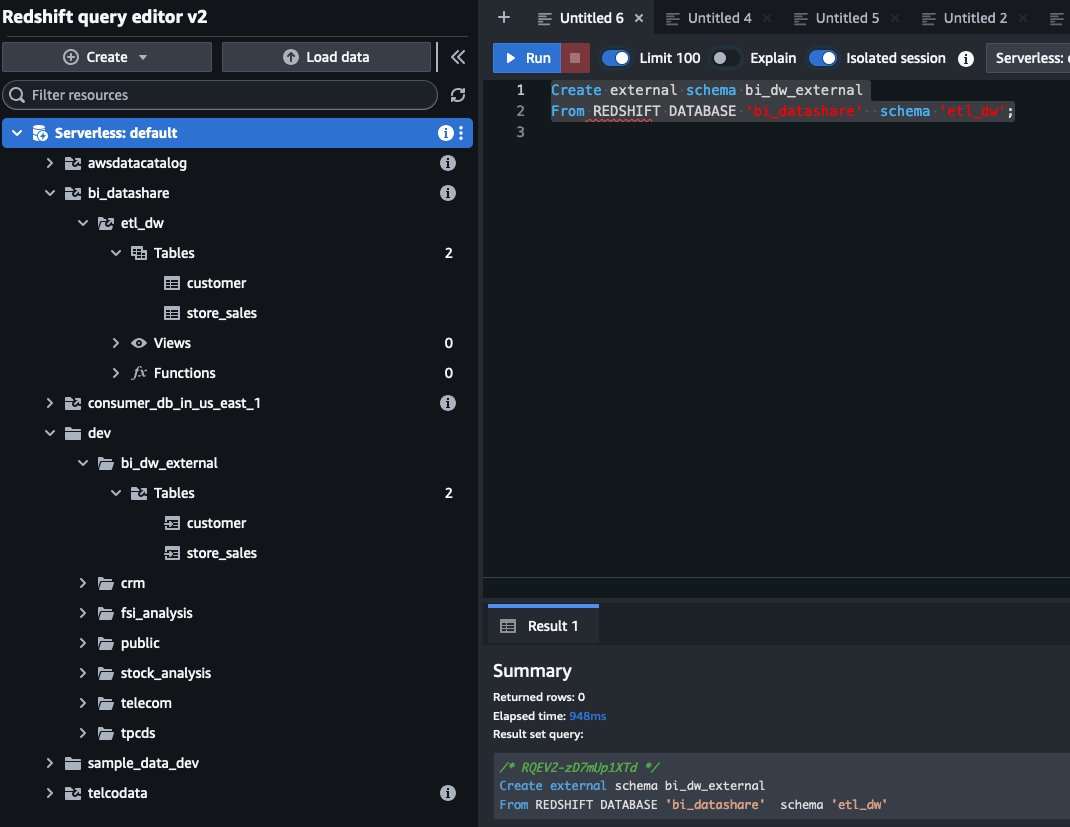
Configure access on the consumer endpoint
To implement a clean and maintainable architecture for accessing shared data in QuickSight, it’s recommended to create an external schema in the local database that references the remote datashare. This best practice approach provides several benefits:
- Simplified object naming and reference
- Consistent access patterns across different tools
- Enhanced governance and access control
First, create the external schema:
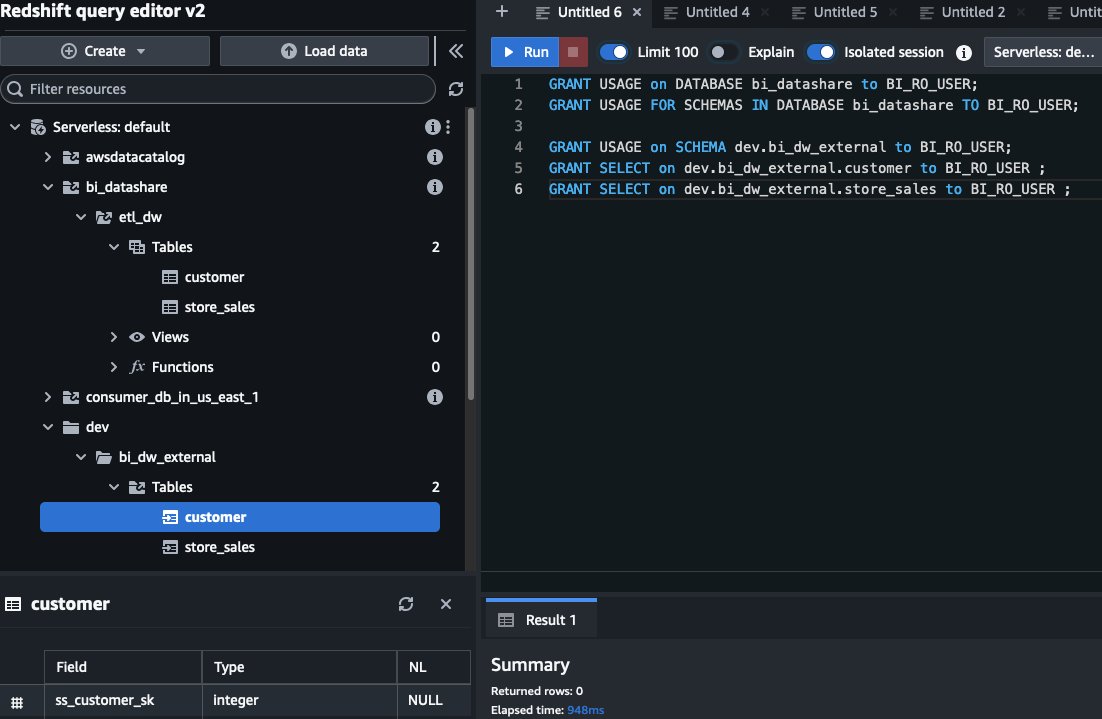
Because you created the database with the permissions option in an earlier step, you need to configure explicit permissions for consumer endpoint cluster users. For this demo, we grant necessary permissions to BI_RO_USER, which will be used in the QuickSight data source.
To do this, grant database- and schema-level access:
Next, grant access to specific tables through the external schema:
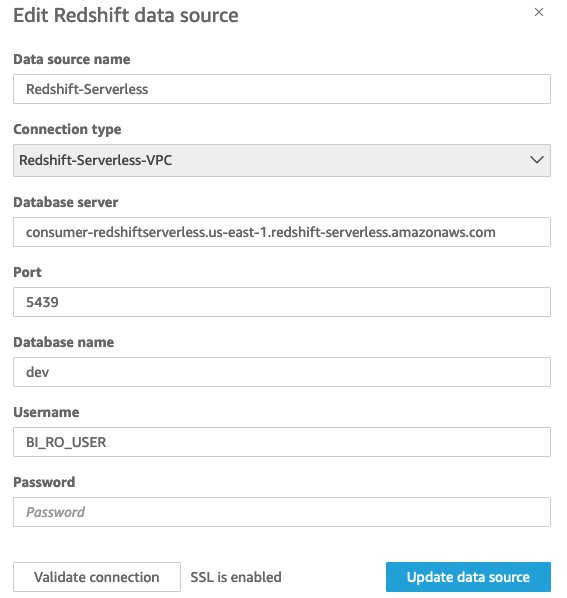
Create a data source in QuickSight
After you configure the necessary permissions and schemas, create a data source in QuickSight to connect to your Redshift Serverless endpoint:
- Open the QuickSight console in the
us-east-1Region. - Choose Datasets in the navigation pane.
- Choose NEW DATASET.
- Choose Redshift as the data source type.
- Configure the connection settings:
- Connection name
- Instance endpoint
- Port
- Database name
- User name (
BI_RO_USER) - Password
- Test and validate the connection before finalizing.
Create and optimize the dataset using QuickSight
Complete the following steps to create and optimize the dataset using QuickSight:
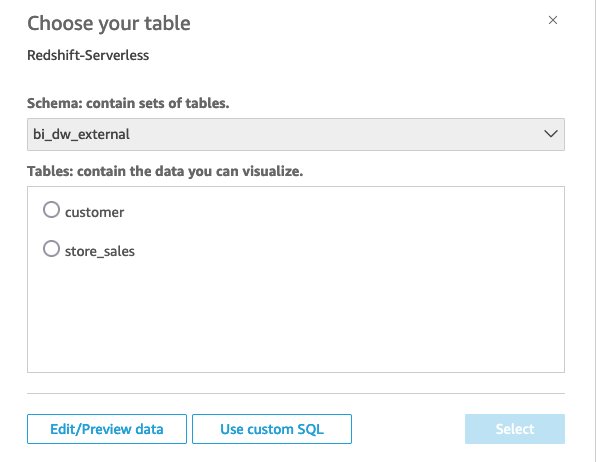
- On the QuickSight console, choose Datasets in the navigation pane.
- Choose the newly created data source.
- Select the required tables from the
bi_dw_externalschema:customerstore_sales
- Enable SPICE (Super-fast, Parallel, In-memory Calculation Engine) mode for optimal performance.
SPICE facilitates faster dashboard rendering, provides better response times for Q&A features, and reduces load on the source Redshift cluster while enabling seamless cross-Region analytics.
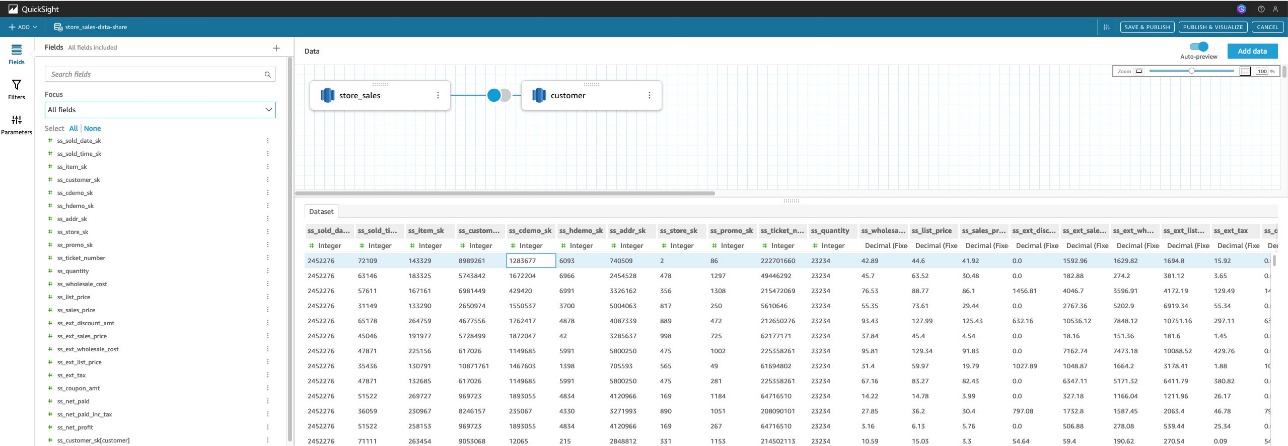
Data is transferred across Regions only during SPICE refresh operations. You can set up scheduled refreshes through the dataset’s settings to maintain data currency.
Use generative BI features in QuickSight
After setting up your dataset in SPICE, you can now use the powerful generative BI capabilities of Amazon Q. To carry out this step, make sure your user has an Author Pro license, which includes all Author capabilities plus generative BI capabilities with Amazon Q in QuickSight. For more information on the different licenses and their included capabilities, refer to Amazon QuickSight pricing.
Build and edit visuals with Amazon Q
To build a visual with Amazon Q, complete the following steps:
- On the QuickSight console, choose Analyses in the navigation pane.
- Choose New analysis with the dataset from the previous steps.
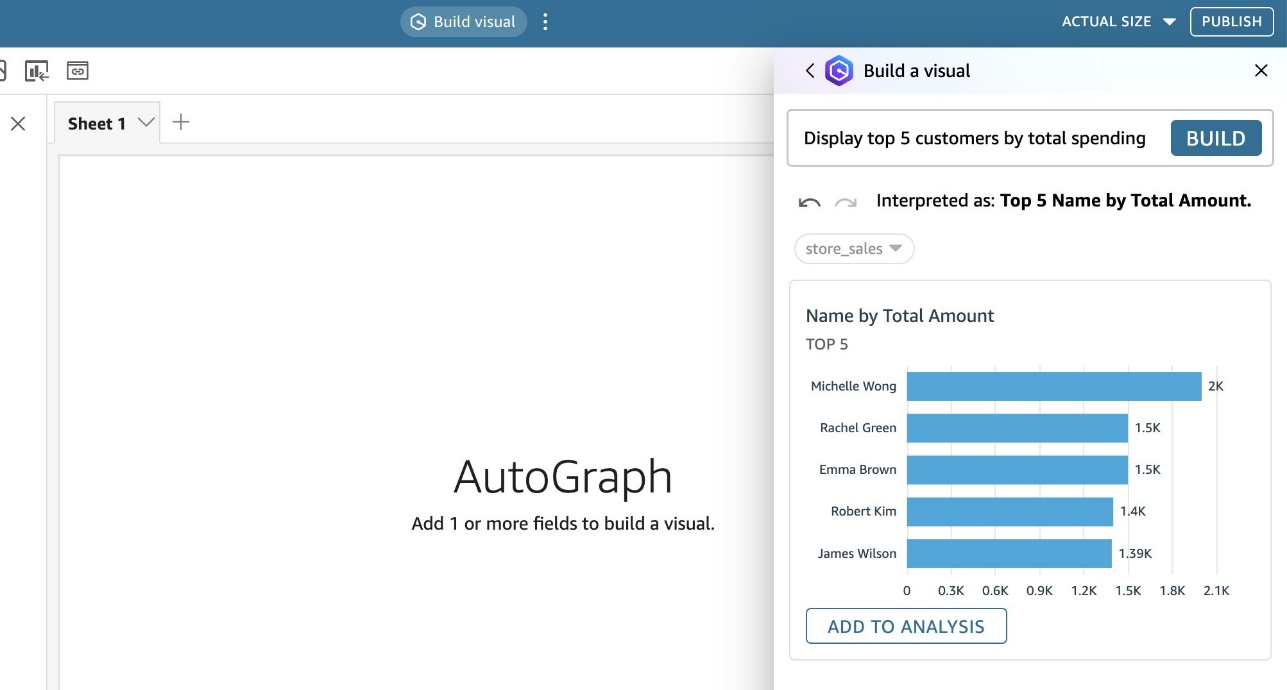
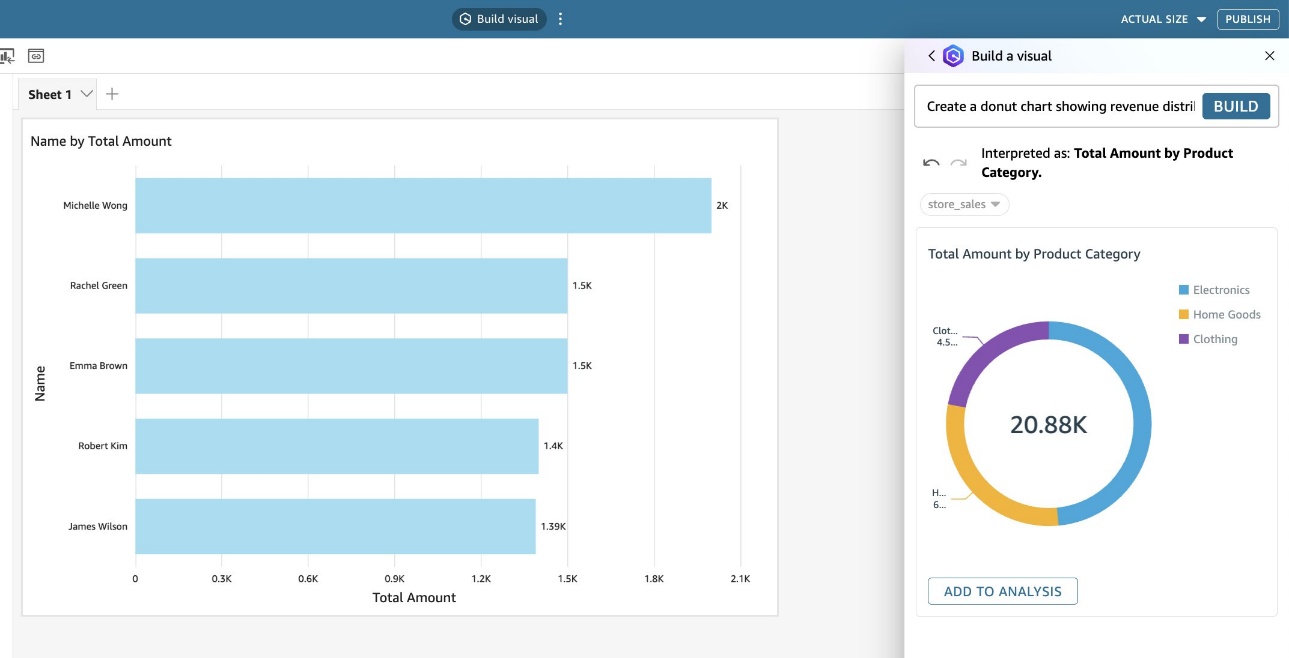
- In your analysis view, choose Build Visual in the menu bar.
- Enter prompts to create visuals, such as:
- “Display top 5 customers by total spending”
- “Create a donut chart showing revenue distribution by product category”
- Choose ADD TO ANALYSIS to add it to your analysis.
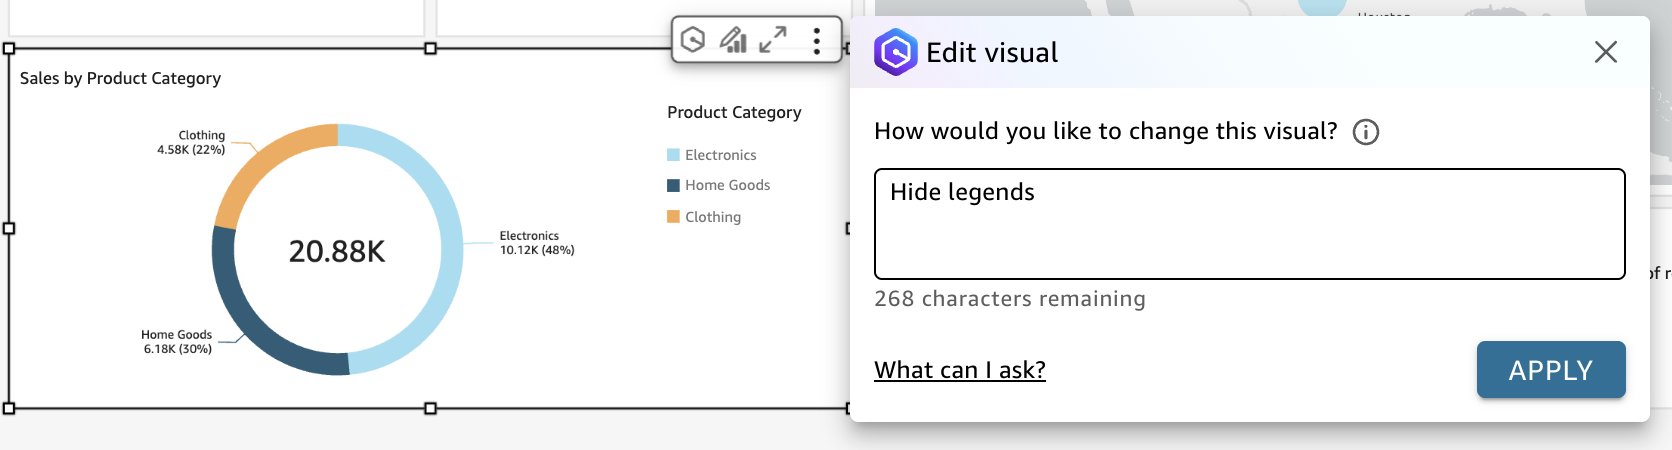
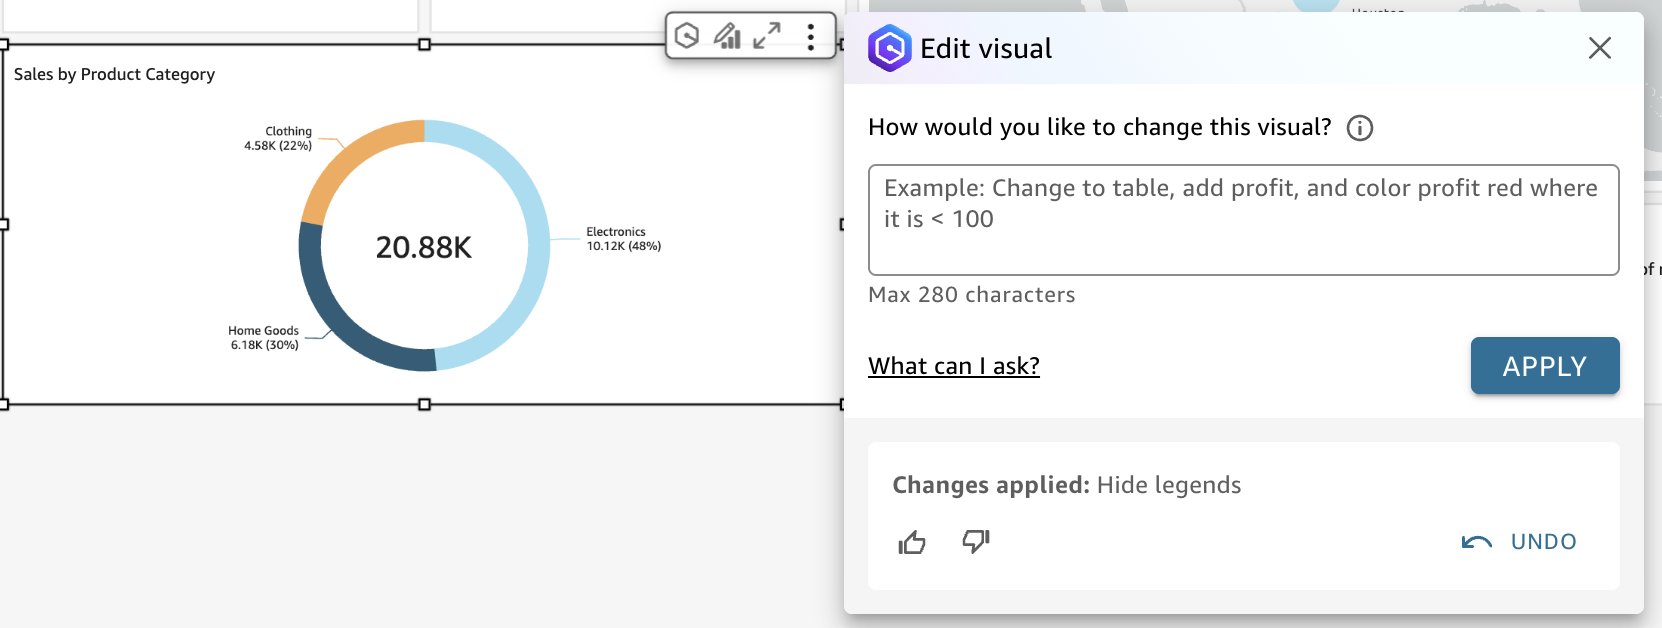
You can further edit the visual with Amazon Q as needed.
- Choose the visual you created.
- Choose the Edit with Q icon.
- Enter a prompt, such as “Hide legends,” and choose Apply.
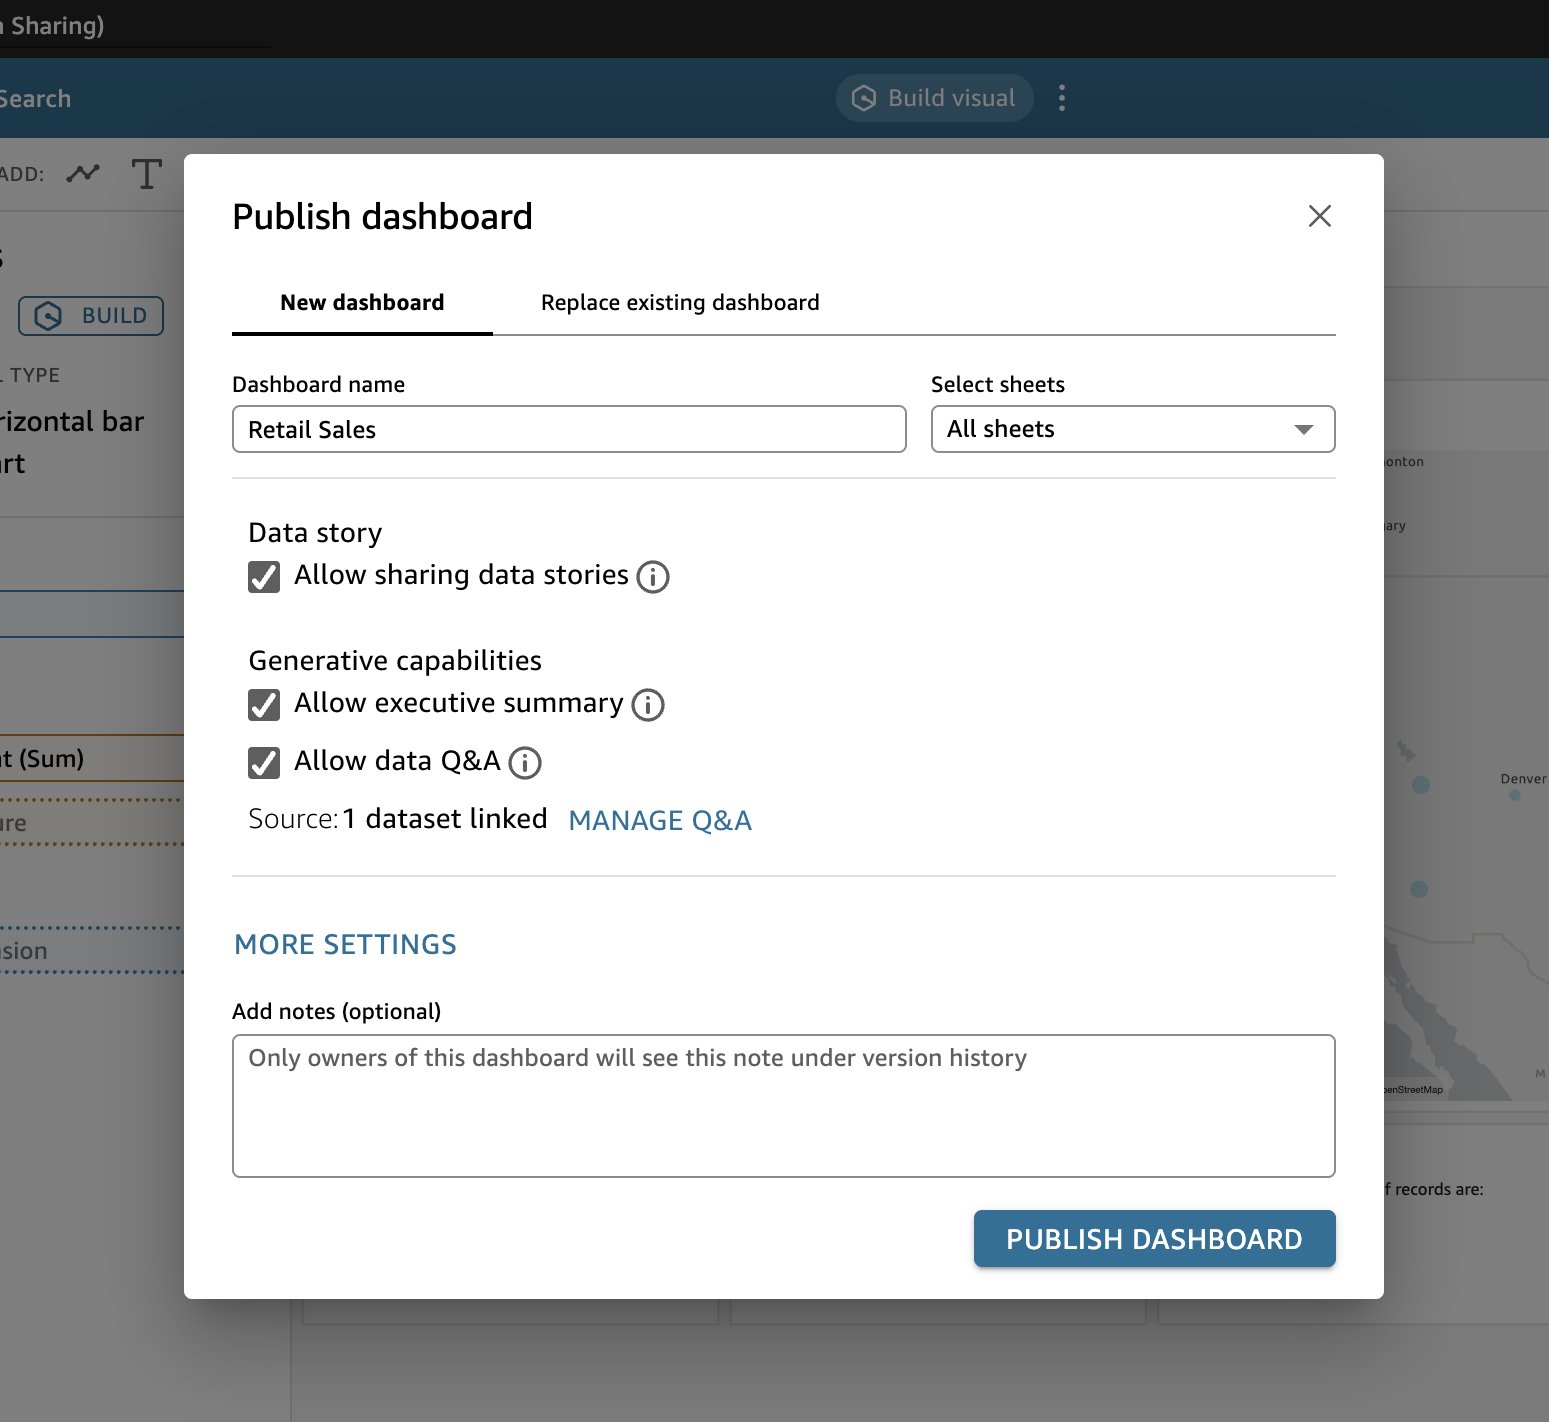
- When you are satisfied building your dashboard, select the check boxes of the other generative BI features you want to use after publishing the dashboard, then choose PUBLISH.
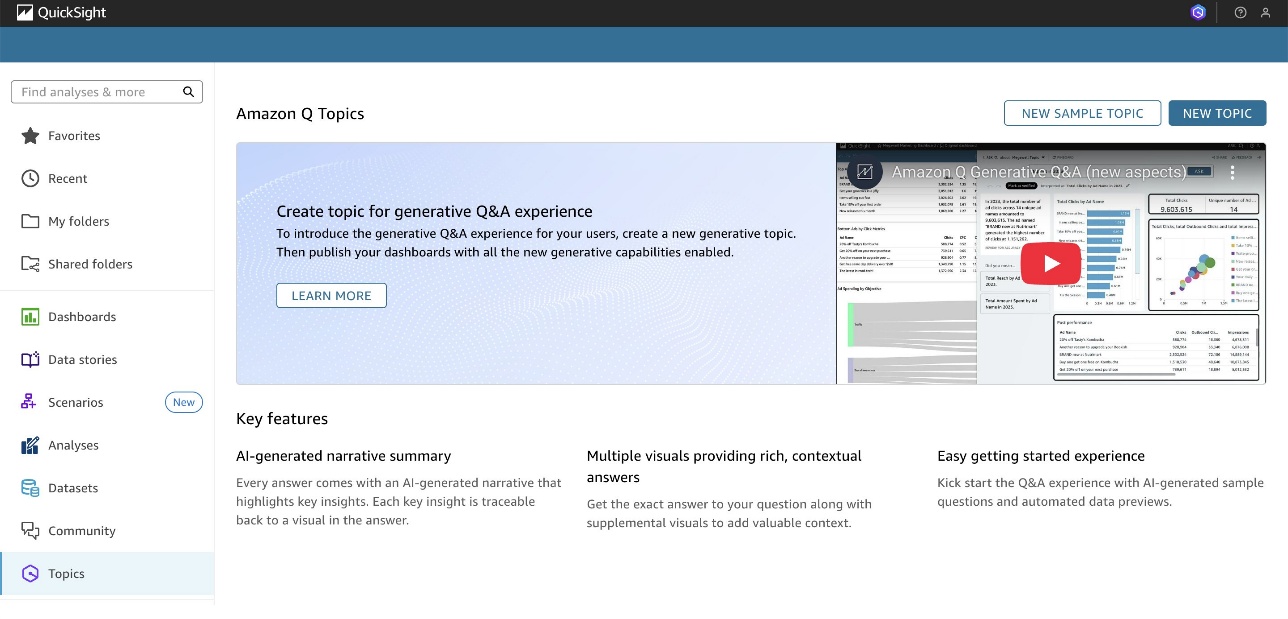
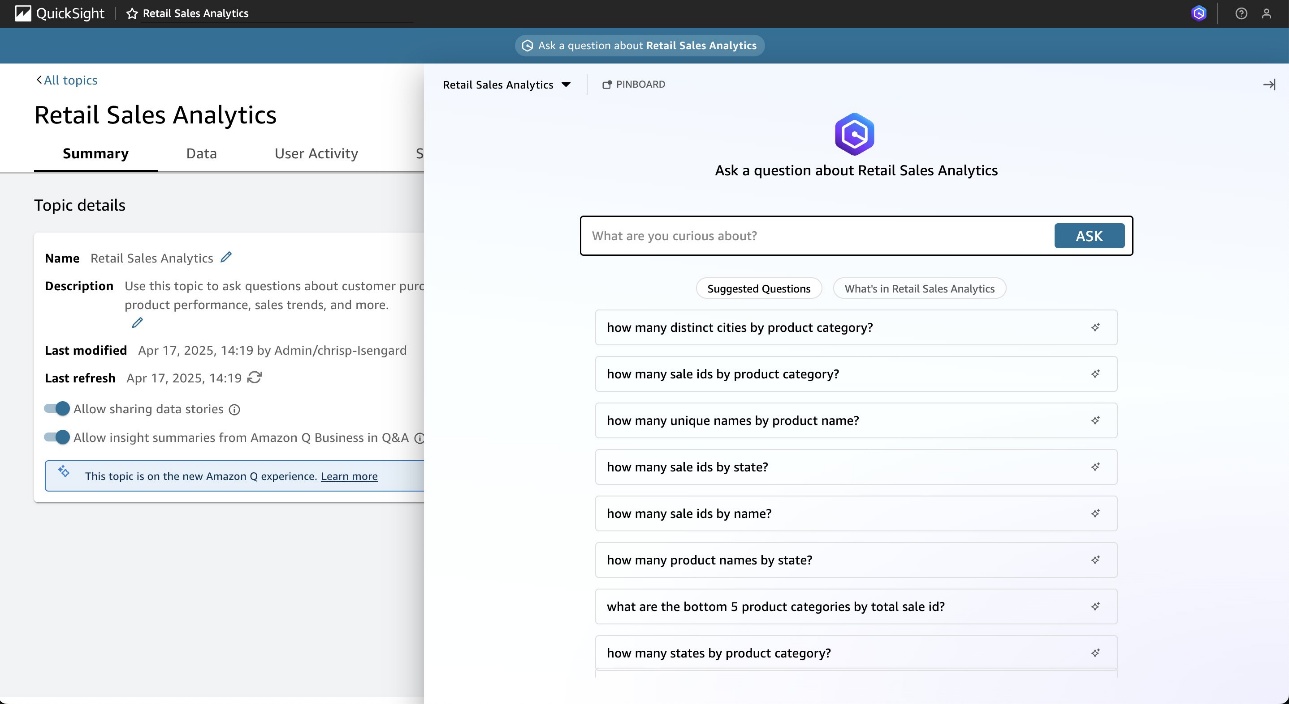
Create Amazon Q topics
Amazon Q topics are curated collections of business questions and relevant data that help users quickly find insights about specific business areas. Topics make it straightforward for users to discover relevant questions and get immediate answers through natural language interactions.
To create an Amazon Q topic, complete the following steps:
- On the QuickSight console, choose Topics in the navigation pane.
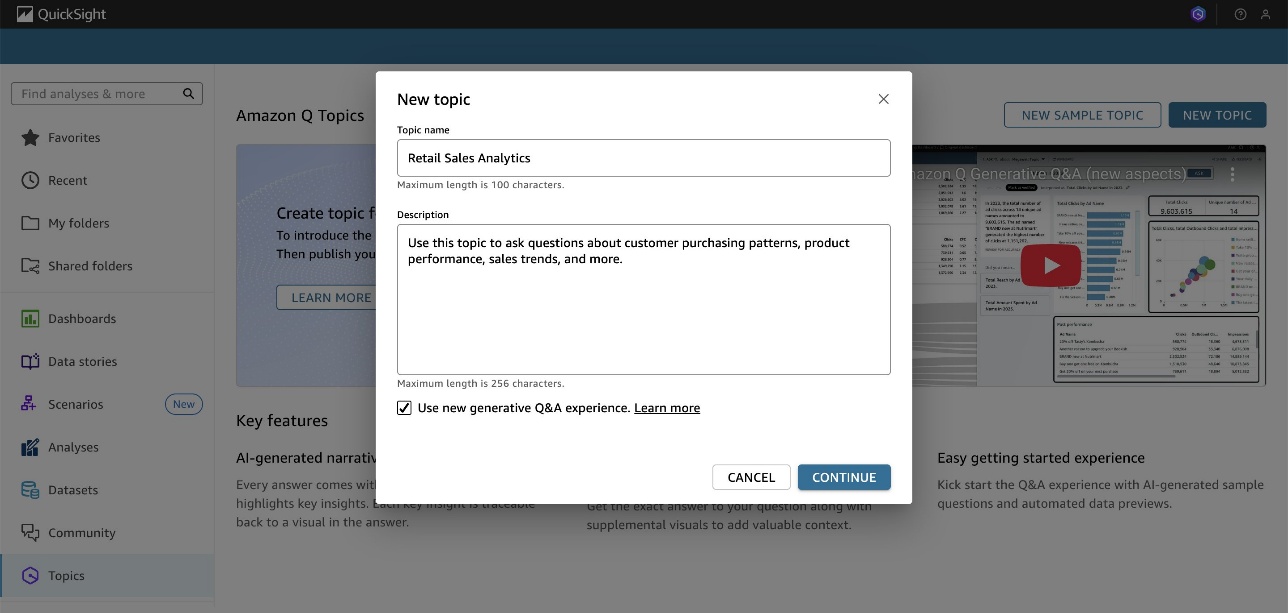
- Choose NEW TOPIC.
- Enter a topic name and description, then choose Continue.
- In the Select a dataset pop-up, choose your dataset and choose CREATE.
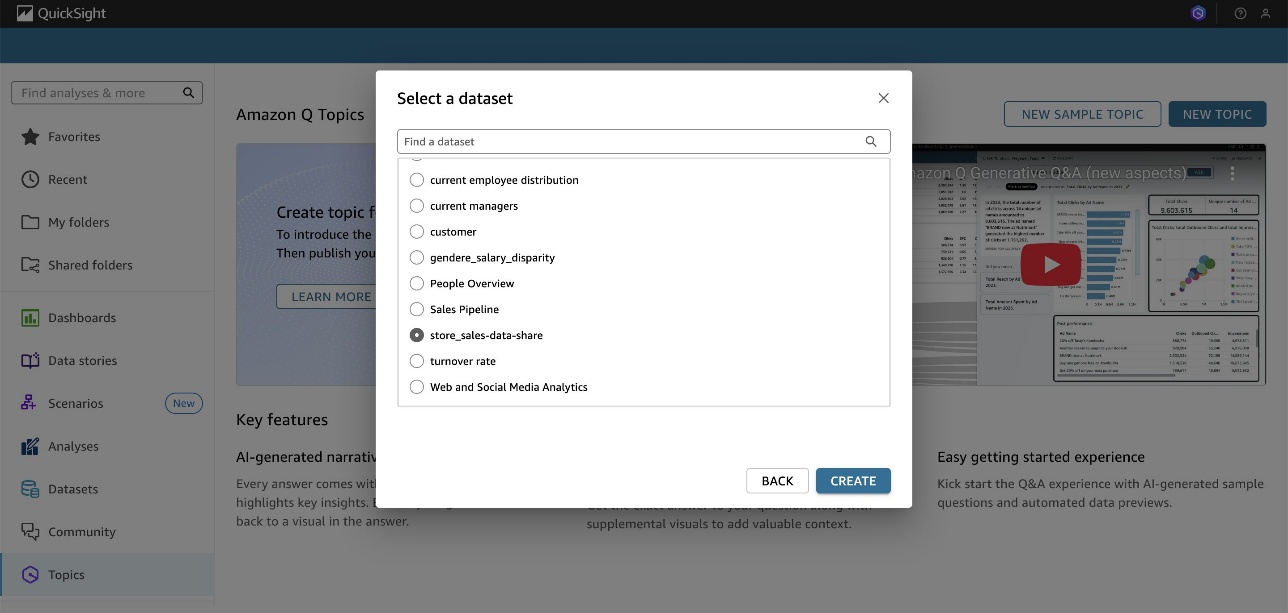
Amazon Q will need a few minutes to index the data and set up field configurations as part of topic creation.
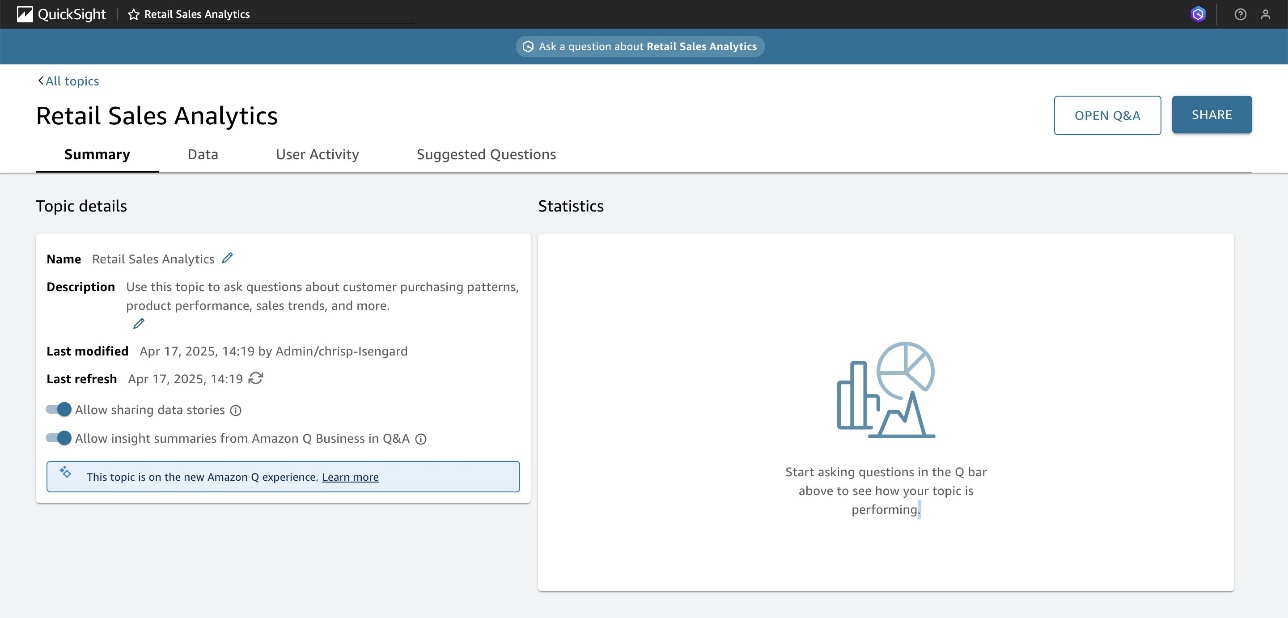
Now you can use your Amazon Q topic.
- In the top toolbar, choose Ask a question about <your topic name>.
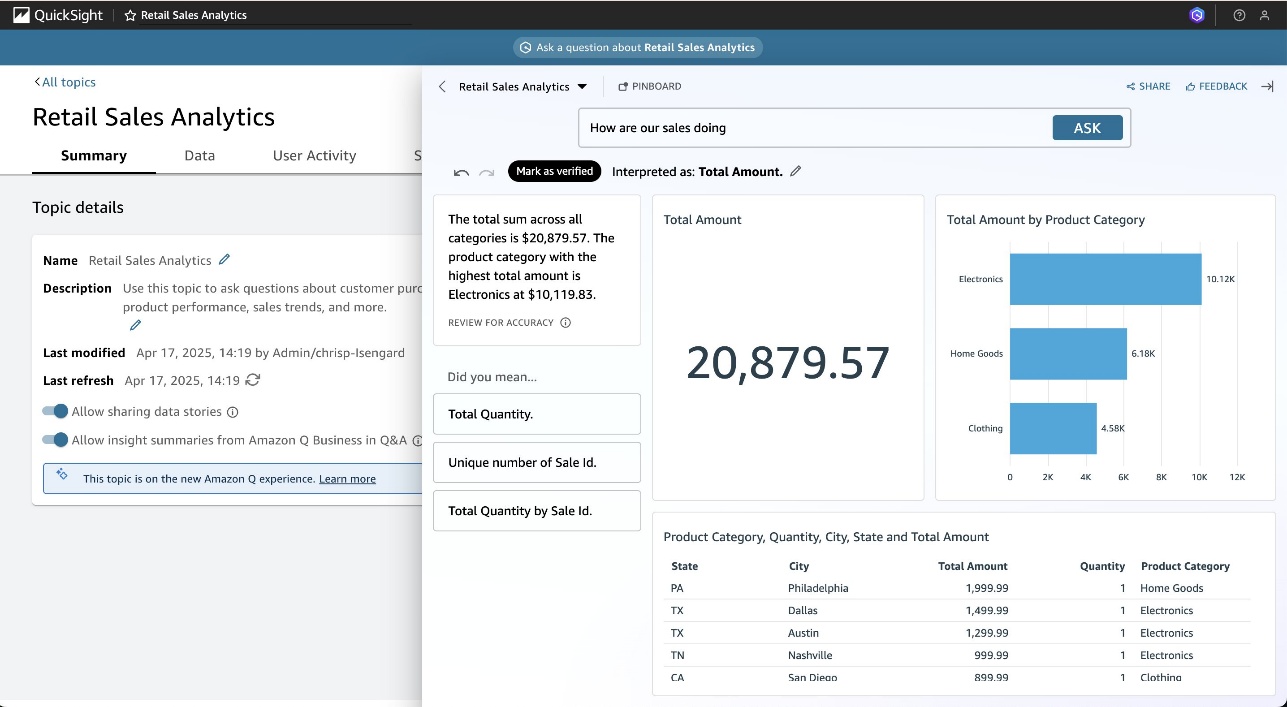
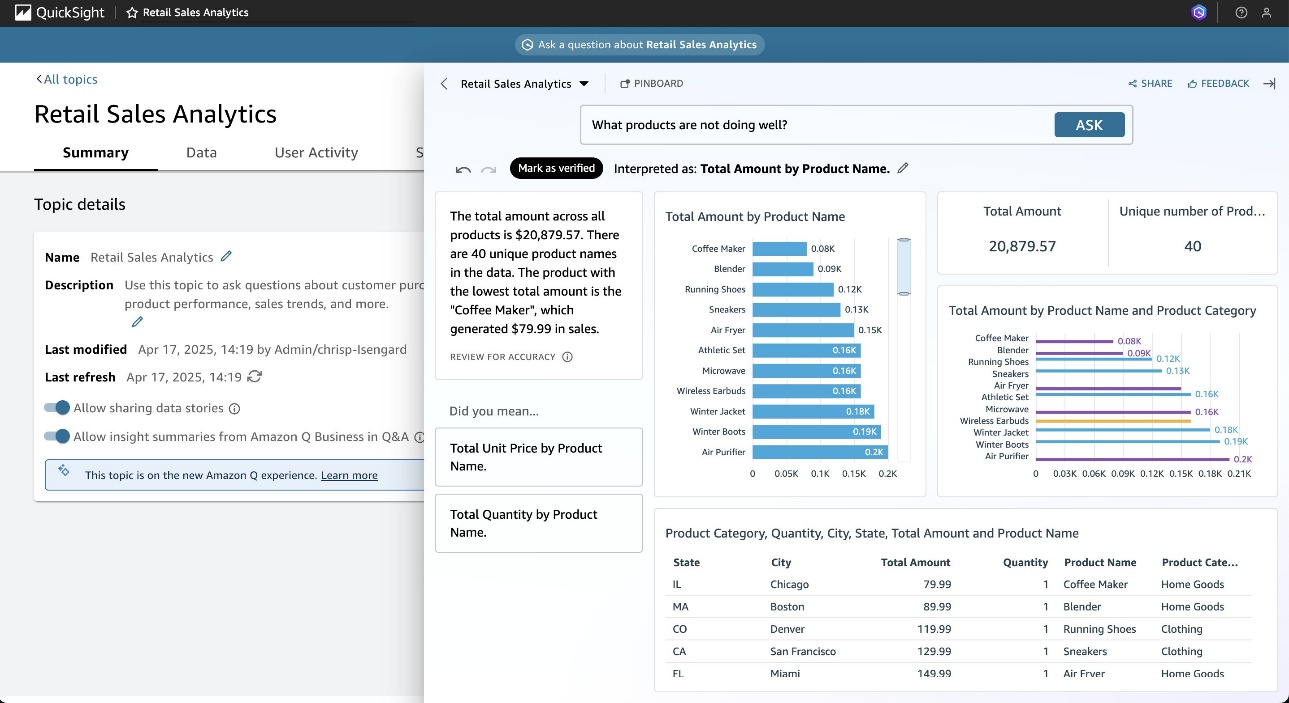
- Use the suggested questions or try asking your own questions, such as:
- “How are our sales doing in 2024?”
- “What 5 products are not performing well?”
Amazon Q will generate relevant visualizations and insights based on your questions.
Build a data story
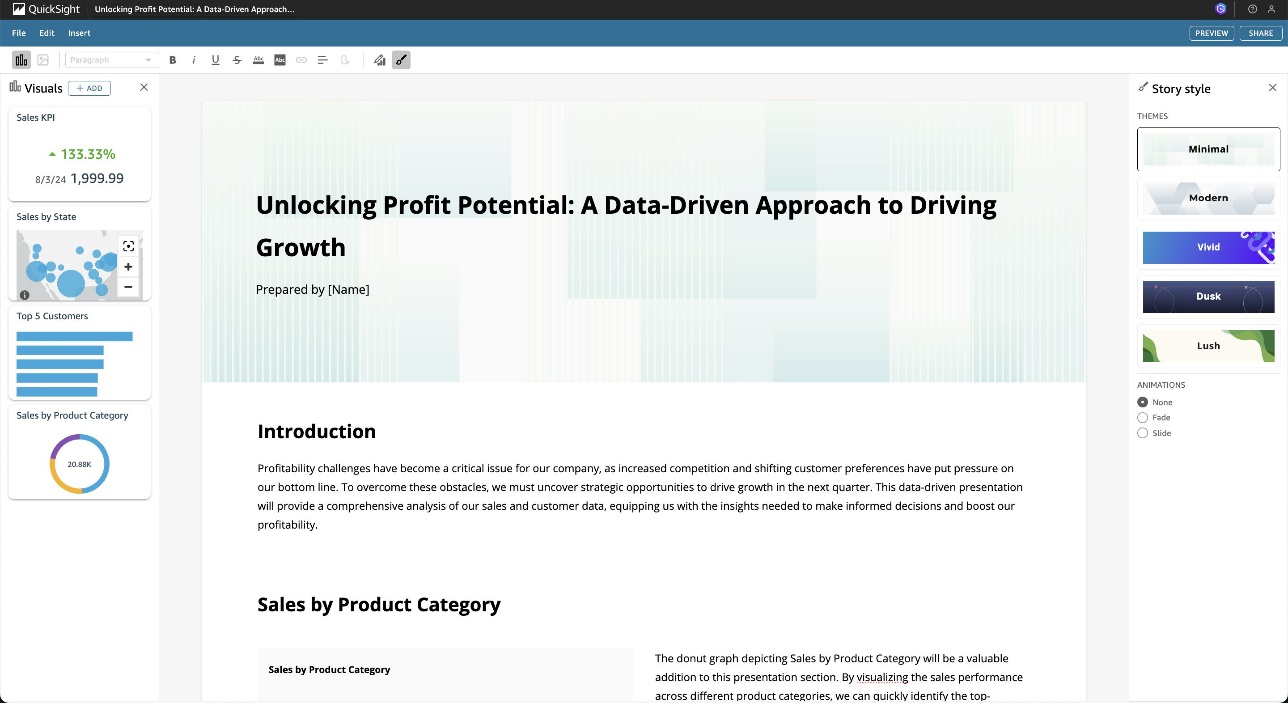
Data stories in QuickSight help you automatically generate narrative insights about your data using natural language generation. It transforms your data into compelling narratives that highlight key trends, patterns, and anomalies, making it straightforward to communicate insights to stakeholders.To create a data story, complete the following steps:
- On the QuickSight console, choose Data stories in the navigation pane.
- Choose NEW DATA STORY.
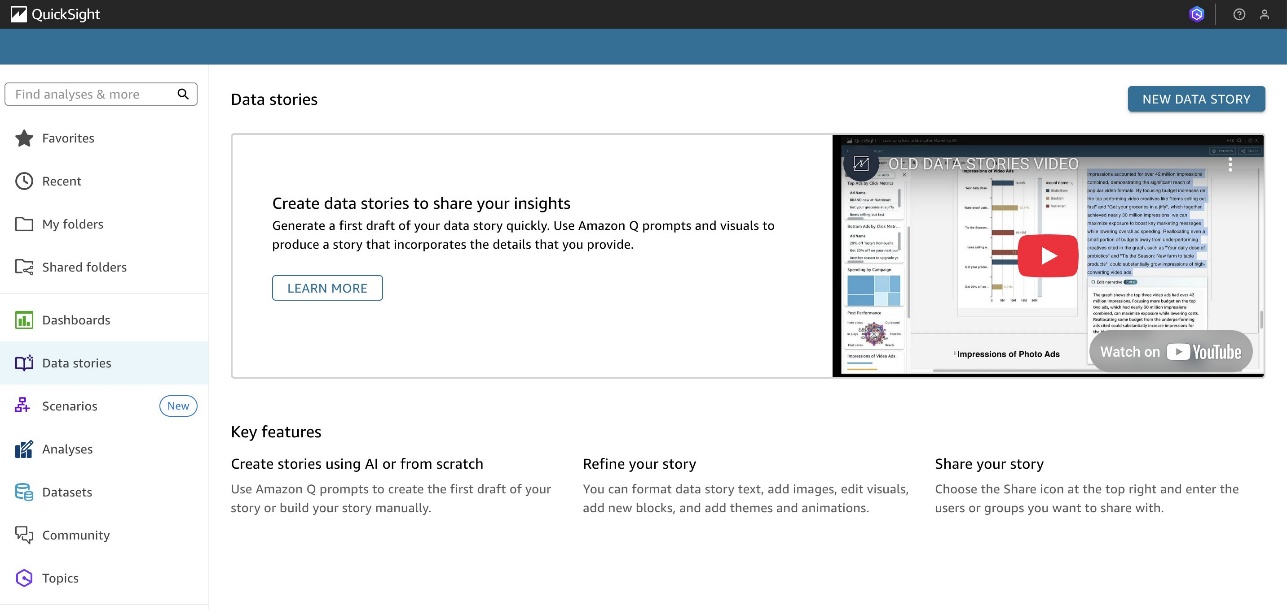
- For Describe your data story, enter a comprehensive prompt about the type of narrative you want Amazon Q to create, and choose the previously published visuals that you want to include.
- Choose BUILD.
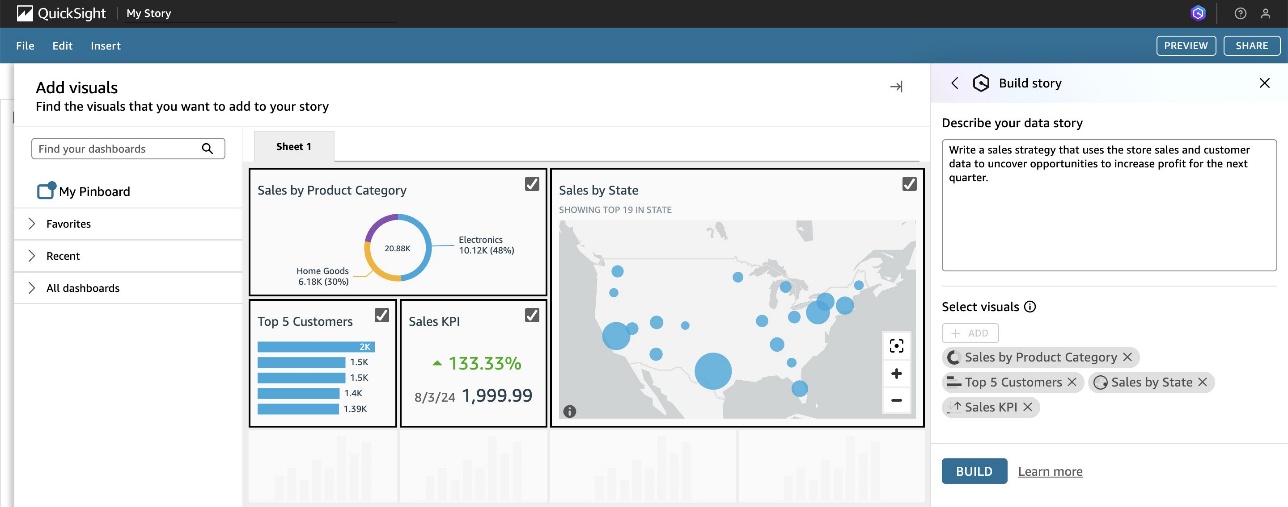
- Review, edit, and share the data story created for you.
Cost considerations
The resources created in this tutorial will continue to incur costs in your account until they are removed. These costs include:
- Cross-Region data transfer:
- Network transfer costs for data movement from (
ap-southeast-1) to (us-east-1); pricing varies based on the amount of data transferred between Regions
- Network transfer costs for data movement from (
- Amazon Redshift costs:
- Producer endpoint (serverless) in the
ap-southeast-1Region - Consumer endpoint (serverless) in the
us-east-1Region - Data sharing between endpoints
- Producer endpoint (serverless) in the
- QuickSight costs:
- Author Pro license fees
- SPICE capacity costs
- Direct query costs
Clean up
Save any important data or visualizations before proceeding, then complete the following steps to clean up your resources:
- Delete your datasets and data sources created in QuickSight.
- Delete your QuickSight account:
- Choose your profile on the application bar, then choose Manage QuickSight.
- Choose Account settings, then choose Manage.
- Verify the correct account name.
- Turn off Account termination protection.
- Enter the confirmation word as shown.
- Choose Delete account.
- Remove the Redshift data sharing configuration:
- In the consumer endpoint (
us-east-1), run the following commands: - In the producer endpoint (
ap-southeast-1), run the following commands:
- In the consumer endpoint (
- Delete the Redshift Serverless workgroup:
- On the Redshift Serverless console, choose Workgroup configuration in the navigation pane.
- Choose Delete Amazon Redshift Serverless instance.
- Enter
deleteto confirm.
- Delete the Redshift Serverless namespace:
- In the navigation pane, choose Namespace configuration.
- Select the namespace, and on the Actions menu, choose Delete namespace.
- Enter
deleteto confirm.
Summary
Through QuickSight and Amazon Redshift, data sharing provides workload isolation by allowing multiple consumers to analyze data seamlessly across Regions without the need to unload and load data. By using features like data sharing, Redshift Serverless endpoints, and SPICE for optimized performance, businesses can enable powerful, Region-agnostic analytics and unlock actionable insights using natural language queries in Amazon Q. This approach simplifies cross-Region data access, reduces operational overhead, and empowers stakeholders with faster, more efficient BI, providing scalability and flexibility for modern analytics needs.
Try out this solution for your own use case, and share your thoughts in the comments.
About the authors
 Vinod Jaganathan is a Specialised Senior Solution Architect for Amazon QuickSight, with over 20 years of experience in the data and analytics domain. He has a proven track record of helping Fortune 500 companies derive business value from their data by driving scalable adoption of Enterprise Data Management, Business Intelligence, Embedded Analytics, and Data Monetization solutions.
 Christal Poon is a Specialist Solutions Architect in the APJ Go-To-Market team. She specialises in Data Analytics and Generative AI services, helping organisations across ASEAN cities leverage cloud technologies for their business needs. As a woman in tech, she aspires to contribute to greater diversity in the industry while enabling customers to build innovative data-driven solutions.