AWS Compute Blog
Improving throughput of serverless streaming workloads for Kafka
Event-driven applications often need to process data in real-time. When you use AWS Lambda to process records from Apache Kafka topics, you frequently encounter two typical requirements: you need to process very high volumes of records in close to real-time, and you want your consumers to have the ability to scale rapidly to handle traffic spikes. Achieving both necessitates understanding how Lambda consumes Kafka streams, where the potential bottlenecks are, and how to optimize configurations for high throughput and best performance.
In this post, we discuss how to optimize Kafka processing with Lambda for both high throughput and predictable scaling. We explore the Lambda’s Kafka Event Source Mappings (ESMs) scaling, optimization techniques available during record consumption, how to use ESM Provisioned Mode for bursty workloads, and which observability metrics you need to use for performance optimization.
Overview
To start processing records from a Kafka topic with a Lambda function, whether using Amazon Managed Streaming for Apache Kafka (Amazon MSK) or a self-managed Kafka cluster, you create an ESM: a lightweight serverless resource that consumes records from Kafka topics and invokes your function.
The scaling behavior of Kafka ESMs is based on the offset lag. This is a metric indicating the number of records in the topic that have not yet been consumed by the Lambda function. This metric typically grows when producers publish new records faster than consumers process them. As the lag grows, the Lambda service gradually adds more Kafka consumers (also known as pollers) to your ESM. To preserve ordering guarantees, the maximum number of pollers is capped by the number of partitions in the topic. Lambda also scales pollers down automatically when lag decreases.
Each ESM follows a consistent polling workflow: poll -> filter -> batch -> invoke, as shown in the following diagram. Every stage has configurable options that directly affect performance, latency, and cost.
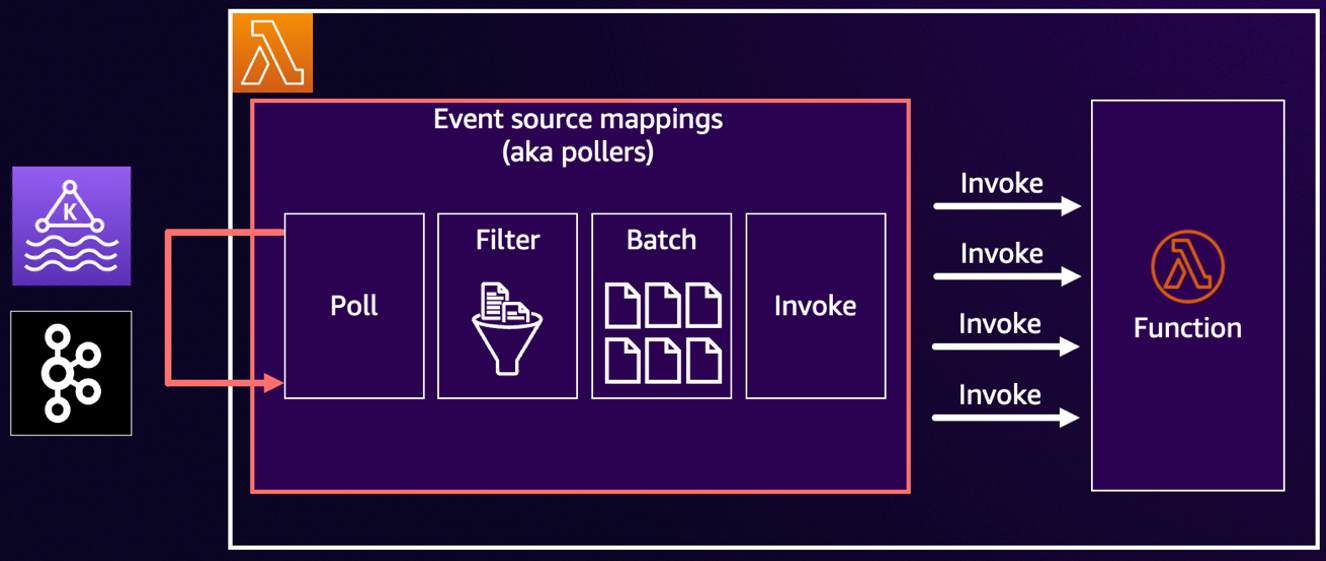
Figure 1. ESM processing workflow.
Polling: Increasing predictability with Provisioned Mode
By default, Kafka ESM uses the on-demand polling mode. In this mode, ESM starts with one poller, automatically adds more pollers when the offset lag grows, and scales the number of pollers down as lag decreases. On-demand mode does not need upfront scaling configuration and is the lowest-cost option for steady workloads. For many applications, this behavior is sufficient: scaling up can take several minutes, but the throughput eventually catches up, and you only pay for the resources you use, such as number of invocations.
However, if your workloads are bursty and latency-sensitive, then on-demand scaling may not be fast enough and can result in a rapidly growing lag. This can be addressed by switching to Provisioned Mode, which gives you more fine-grained control to configure a minimum and maximum number of always-on pollers for your Kafka ESM. These pollers remain connected even when traffic is low, so consumption begins immediately when a spike occurs, and scaling within the configured range is faster and more predictable.
The following diagram shows the performance improvements of using the ESM in Provisioned Mode for bursty workloads. You can see that in on-demand mode it took ESM over 15 minutes to eventually catch up to the new traffic volume, while in Provisioned Mode the ESM handled the traffic increase instantly.
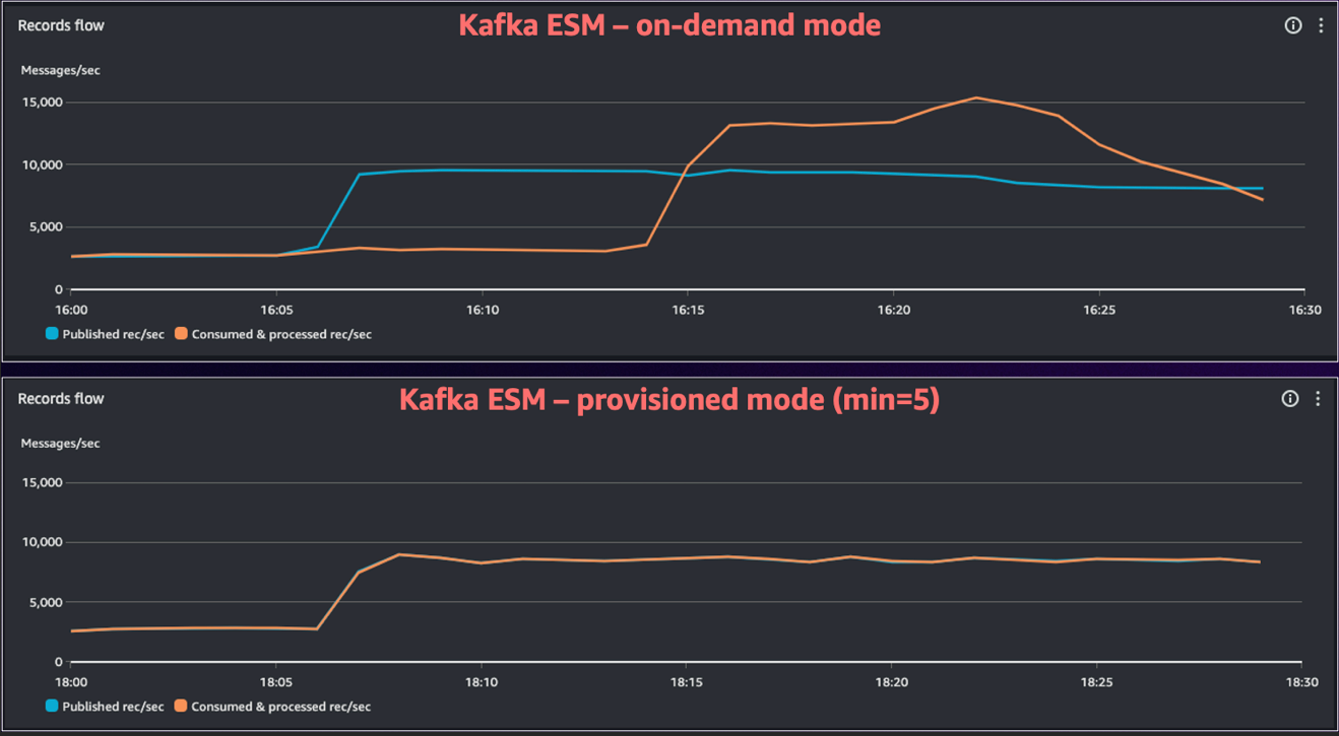
Figure 2. Comparing Kafka ESM on-demand and Provisioned Mode.
Best practices for using Provisioned Mode:
- Start small: Provisioned Mode is a paid capability. AWS recommends that for smaller topics (less than 10 partitions) you start with a single provisioned poller to evaluate throughput and observe workload behavior. For larger topics, you can start with a higher number of provisioned pollers to accommodate the baseline consumption. You can adjust this configuration at any time as you learn traffic patterns and refine your performance targets.
- Estimate throughput: A single provisioned poller can process up to 5 MB/s of Kafka data. Monitor your average record size and per-record processing time to establish a baseline for minimum and maximum pollers, then validate with real workload metrics.
- Set a low floor and flexible ceiling: Choose a minimum number of pollers that makes sure that latency targets are met when a traffic burst occurs, then allow the ESM to scale toward a higher maximum as needed.
See Low latency processing for Kafka event sources for more information.
To summarize:
- Use Provisioned Mode for bursty traffic, strict SLOs, or when backlogs pose downstream risk.
- Use on-demand polling mode for steady traffic, flexible latency requirements, or when minimizing cost is the primary objective.
Filtering: Drop irrelevant records early
By default, all records from Kafka are delivered to your Lambda function. This approach is direct and flexible. Your handler code decides which records to process and which to ignore. This default behavior is highly efficient for workloads where nearly all records are valuable.
When you find yourself discarding a large portion of records in your handler code, you can use native ESM filtering capabilities to drop irrelevant records before they reach your function. You can filter early to reduce cost, free up concurrency, increase throughput, and make sure that your Lambda function spends cycles on valuable work only.
The following diagram shows the application of an ESM filter to only process telemetry that meets a specified condition.
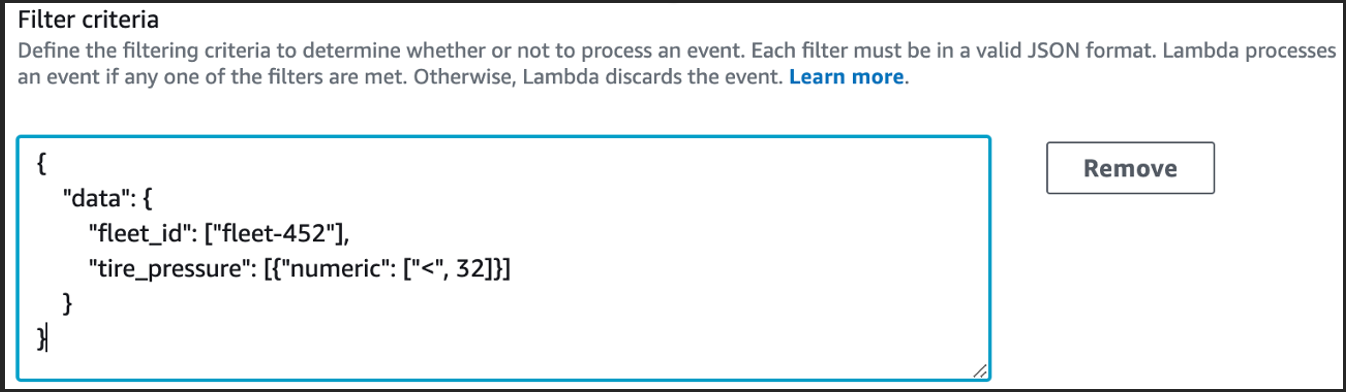
Figure 3. ESM filtering configuration.
Batching: Processing more records per invocation
You can batch multiple Kafka records together to process more data per invocation and increase the efficiency of your Lambda functions. Larger batches help you achieve higher throughput and reduce costs by making better use of each invocation run. To get the best results, you should balance batch size and latency targets and adjust the configuration based on your workload’s specific traffic patterns and SLOs.
Lambda gives you two primary controls for configuring ESM batching behavior:
- Batch window: This is how long the ESM waits to accumulate records before invoking your function. A shorter window produces smaller batches and more frequent invocations. A longer window (up to 5 minutes) produces larger batches and less frequent invocations.
- Batch size: This is the maximum number of records that the ESM can accumulate before invoking your function, up to 10,000.
There’s no single setting that universally works for all workloads. Your optimal configuration depends on workload characteristics such as latency tolerance and record size. AWS recommends starting with the default values and then gradually adjusting the configuration based on your requirements. For example, you can increase the batch size while monitoring function duration, error rates, and end-to-end latency.
The following diagram shows how to configure batch window and size using Terraform:
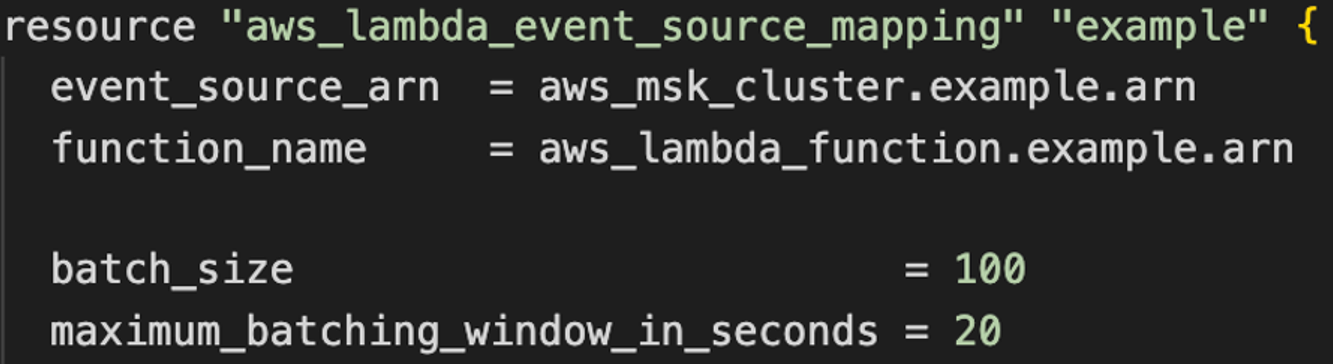
Figure 4. ESM batch window and batch size configuration with Terraform.
The ESM invokes your function when one of the following three conditions is met:
- The batch window elapses.
- The accumulated batch reaches the configured maximum batch size.
- The accumulated payload approaches the 6 MB maximum invocation payload limit of Lambda.
When using higher batch window values during traffic spikes, you typically see more records-per-batch and longer function invocation durations. This is normal: larger batches can take longer to process. Always interpret the Duration metric in the context of the batch size being processed.
Invoke: Process each batch faster and more efficiently
You control how quickly each batch completes through two main factors: the efficiency of your function code and the compute resources you allocate to your functions. You can improve both to process more records per second, reduce the necessary concurrency, and lower cost.
Optimize your code: Review your function handler code to identify where you can reduce work per record. For example, eliminate redundant serialization, initialize dependencies once during function startup, and consider parallel processing within the handler (where applicable). For performance-critical workloads, you can also choose languages that compile to binary, such as Go or Rust, which typically deliver high performance with lower resource usage.
Tune compute resources: Increasing the memory function allocation proportionally increases vCPU. Use the Lambda PowerTuning tool to find the memory configuration that best balances performance and cost for your workload.
Correlate metrics: As you optimize, monitor Duration and Concurrency. You should see the concurrency drop as duration improves. That correlation confirms that your changes are improving the system throughput and efficiency.
When you combine handler optimizations with early filtering and efficient batching, even small improvements can make your pipeline noticeably faster to operate under load.
Observability drives good decisions
You can’t optimize what you can’t see. To tune your data processing pipeline, use a combination of OffsetLag, function invocation metrics, and Kafka broker metrics to understand your data processing performance. OffsetLag tells you whether your function is keeping up with incoming records, as shown in the following figure. Function metrics such as Duration, Concurrency, Errors, and Throttles show how efficiently your code is processing record batches. If you use Provisioned Mode, then you can use the Provisioned Pollers metric to track the poller capacity.
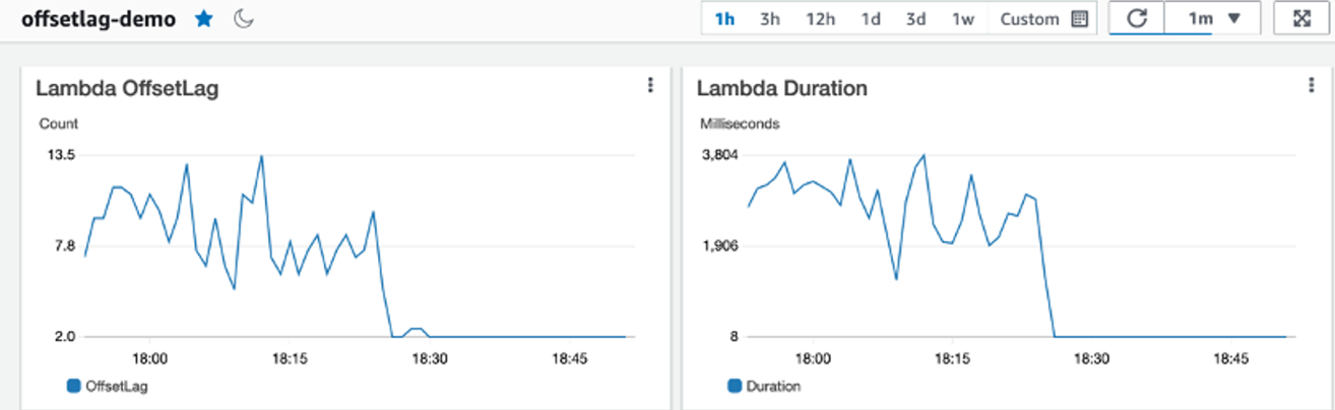
Figure 5. Kafka consumption observability with Amazon CloudWatch.
Always interpret function duration in the context of batch size. During traffic spikes, you can typically observe both duration and actual batch size increase, which is expected amortization, not a regression. For alerting, monitor lag growth, unexpected drops in invocation rate, and error spikes. With these signals in place, you can detect issues early and tune your configuration with confidence.
A sample step-by-step optimization loop
- Establish a clean baseline: Make your handler idempotent and batch-aware, start with a short batch window and moderate batch size. Monitor your ESM and confirm offset lag stays near zero at steady state.
- Filter early: Move static checks (record type, version, other custom properties) into ESM filtering and verify invoked counts drop relative to polled counts, proving the filter saves cost and concurrency.
- Increase batch size gradually while monitoring the duration, error rates, and latency metrics. Extend the batch window slightly if spikes cause too many invocations.
- Speed up the handler: Increase memory for more CPU, reduce per-record I/O, remove redundant serialization, and parallelize safely inside the batch while tracking duration and concurrency metrics together.
- Prove spike readiness: Replay realistic surges, monitor offset lag and drain time, and enable Provisioned Mode with a small minimum if recovery takes too long, adjusting with MB/s-per-poller estimates.
- Implement alerting: Watch for sustained lag growth, unexpected gaps between polled and invoked, and error spikes tied to partitions or large batches. Always read metrics in context with batch size.
- Re-evaluate periodically: Re-measure system throughput, confirm filter effectiveness, and retune batch and memory settings regularly as workloads evolve.
Conclusion
Optimizing Kafka streams processing with AWS Lambda necessitates understanding how ESMs work and tuning consumption components: polling, filtering, batching, and invoking. Filtering redundant records early removes unnecessary work, batching helps you process more records per invocation, and handler optimizations make sure that you make the most of the compute that you allocate. Together, these adjustments let you scale efficiently and keep offset lag under control.
When your workload is bursty, use Provisioned Mode to absorb spikes without long recovery times. With the right alerts on lag, errors, and unexpected polled versus invoked behavior, you can spot problems early and adjust before they impact users. Following this optimization guide gives you a practical way to measure, tune, and revisit your setup as traffic patterns change.
To learn more about optimizing Kafka consumption, see the AWS re:Invent 2024 session about Improving throughput and monitoring of serverless streaming workloads.
To learn more about building Serverless architectures see Serverless Land.