Containers
Centralize cross-account Amazon ECS telemetry with an ADOT gateway
Running an OpenTelemetry collector as a sidecar in each Amazon Elastic Container Service (Amazon ECS) task works at small scale. It doesn’t hold up across a multi-account estate, and on Windows it doesn’t run at all. The AWS Distro for OpenTelemetry (ADOT) collector ships as a Linux container. It can’t run as a sidecar alongside a Windows .NET Framework task. Those services then go uninstrumented, or they carry a sidecar that can’t start on Windows and consumes resources without collecting anything.
The sidecar model also adds cost on Linux at scale. A collector in each task carries a per-task CPU and memory overhead. Configuration drifts as each copy changes independently, and there is no central point for ingestion policy.
In this post, you replace per-task sidecars with a single centralized ADOT collector, a “gateway,” deployed in a dedicated observability account. You push OpenTelemetry Protocol (OTLP) data from workloads across many accounts to the gateway over private connectivity through AWS Transit Gateway. The gateway exports traces to AWS X-Ray and metrics and logs to Amazon CloudWatch.
This pattern extends the 2021 post Using AWS Distro for OpenTelemetry Collector for cross-account metrics collection on Amazon ECS, which centralized metrics only through a Prometheus scrape with remote write to Amazon Managed Service for Prometheus. Here you centralize the full signal set of traces, metrics, and logs with an OTLP push gateway, and cover Windows .NET Framework tasks that a Linux sidecar can’t. It’s the Amazon ECS counterpart to Implement centralized observability for multi-account Amazon EKS for Amazon Elastic Kubernetes Service (Amazon EKS).
You will learn how to deploy the gateway behind an internal Network Load Balancer, connect workload accounts, instrument Linux and Windows .NET workloads, and validate end to end. Because AWS also offers native cross-account features in Amazon CloudWatch, the next section helps you choose the right tool first. The post closes with the operational lessons that most often trip up a first deployment.
When to use this pattern
AWS offers native cross-account features in Amazon CloudWatch, and they solve a different part of the problem than this gateway. Knowing the split helps you pick a managed feature when it fits, and the gateway when you need to own collection.
- Amazon CloudWatch cross-account observability, through Amazon CloudWatch Observability Access Manager (CloudWatch OAM), links source accounts to a monitoring account. From that monitoring account, you search and visualize metrics, logs, and traces that already exist in each source account, without moving the data.
- Amazon CloudWatch cross-account cross-Region metrics centralization replicates metrics into a destination account through AWS Organizations rules, which gives a central team ownership of the data for alarms, governance, and long-term queries.
Both features operate on telemetry already in Amazon CloudWatch or AWS X-Ray in each source account. They centralize the view of, or a copy of, data you already collect. This gateway operates one tier earlier. It’s the collection and ingestion path that gets telemetry out of the workloads in the first place. That includes workloads that don’t yet report to CloudWatch, that run Windows .NET Framework, or that you want to instrument with OpenTelemetry under central configuration control.
Use the following table to choose between the three approaches:
| Consideration | Centralized ADOT gateway (this post) | CloudWatch cross-account observability (OAM) | CloudWatch metrics centralization |
| Primary job | Collect and ingest OTLP telemetry from workloads | View source-account telemetry from a monitoring account | Replicate metrics into a destination account |
| Operates on | Uninstrumented or OTLP-emitting workloads | Data already in CloudWatch and X-Ray | Metrics already in CloudWatch |
| Signals | Traces, metrics, logs | Metrics, logs, traces, Application Signals | Metrics |
| Instrumentation control | Central collector config: enrichment, cardinality | None (consumes existing data) | None (replicates existing metrics) |
| Windows .NET Framework without a sidecar | Yes | Not a collection tier | Not a collection tier |
| Cross-account transport | Private, over Transit Gateway | AWS-managed account links | AWS-managed Organizations rules |
| You operate a fleet | Yes (ECS on EC2) | No | No |
| Best when | You need to collect telemetry, standardize instrumentation, or serve non-sidecar platforms | Your data is already in CloudWatch and you need one pane of glass | You need a governed central copy of metrics for alarms and retention |
Choose the gateway when the gap is collection. Choose the native features when the gap is viewing or consolidating data you already collect. Many estates use both.
Solution overview
The gateway runs in a dedicated observability account and exposes a stable OTLP endpoint. Workloads in other accounts send OTLP over the private network. The collector batches the data, converts metrics to the CloudWatch embedded metric format (EMF), and exports traces to AWS X-Ray and logs to Amazon CloudWatch Logs.
The solution has these components:
- A dedicated Amazon ECS cluster on Amazon Elastic Compute Cloud (Amazon EC2) for the collector fleet, chosen for cost efficiency on an always-on fleet. See “Design considerations and best practices” for the AWS Fargate trade-off.
- An internal Network Load Balancer (NLB) as the stable OTLP ingestion point, with TCP listeners on port 4317 (gRPC) and port 4318 (HTTP).
- The ADOT collector running as an Amazon ECS service behind the NLB.
- AWS Transit Gateway, shared across accounts through AWS Resource Access Manager (AWS RAM), for cross-account connectivity.
- Amazon CloudWatch (metrics through EMF, plus logs) and AWS X-Ray (traces) as destinations.
An internal NLB is the right front door for three reasons. It keeps the endpoint private and reachable only from connected networks, and gives workloads a single stable DNS name as collector tasks scale or recycle. As a Layer 4 load balancer, it also passes through TCP for both OTLP protocols. A single fleet removes the per-account operational tax and serves Windows .NET Framework workloads that can’t host a Linux sidecar.
The gateway is source-agnostic at the ingestion layer: any workload that produces OTLP and can route to the endpoint is a valid client, not only Amazon ECS. See Extending beyond Amazon ECS.
Architecture
The following diagram shows the end-to-end architecture, left to right.
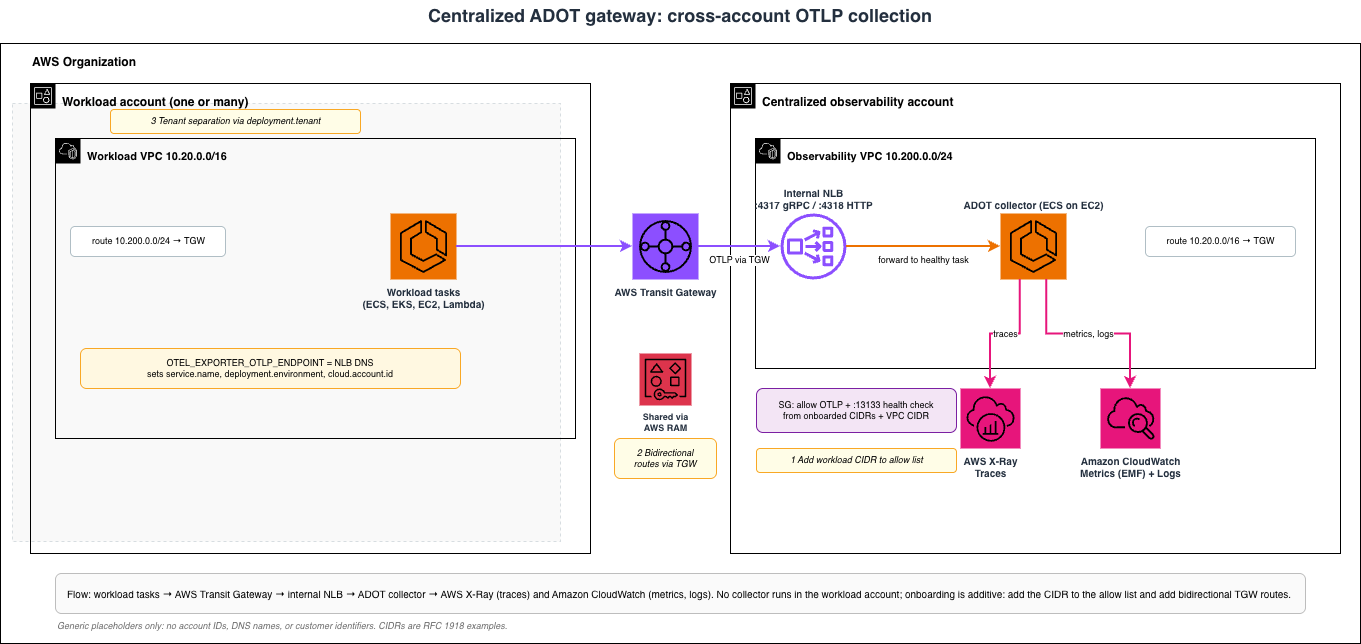
Figure 1: A single ADOT collector fleet in the observability account ingests OTLP from workload accounts over private Transit Gateway connectivity, then exports traces to AWS X-Ray and metrics and logs to Amazon CloudWatch
How telemetry flows
Telemetry moves through the gateway as follows:
- An instrumented application in a workload account generates OTLP telemetry.
- The application sends that telemetry to the gateway NLB DNS name: gRPC on port 4317 (typical for Linux SDK exporters) or HTTP on port 4318 (used by the Windows .NET auto-instrumentation).
- Traffic routes from the workload virtual private cloud (VPC) through the Transit Gateway to the observability VPC.
- The NLB forwards the traffic to a healthy ADOT collector task.
- The collector batches and enriches the telemetry, then exports traces to AWS X-Ray, metrics to Amazon CloudWatch through EMF, and logs to Amazon CloudWatch Logs.
- For infrastructure services that expose Prometheus metrics but have no OpenTelemetry SDK (such as RabbitMQ), the collector discovers instances by Amazon EC2 tag and scrapes their metrics endpoints.
Prerequisites
Before you begin, confirm you have the following:
- An AWS Organizations setup with a dedicated observability account and one or more workload accounts.
- An AWS Transit Gateway shared across accounts through AWS Resource Access Manager (AWS RAM), with workload VPCs already attached.
- Nonoverlapping CIDR ranges for the observability VPC and all workload VPCs.
- Terraform version 1.5.0 or later, and the AWS provider for Terraform 5.x.
- A deployment IAM role in the observability account that your pipeline assumes.
- Workloads instrumented with an OpenTelemetry SDK (for push) or exposing a Prometheus endpoint (for pull). For Windows .NET Framework applications, the OpenTelemetry .NET Automatic Instrumentation package must be present in the container image.
Replace these placeholders with values for your environment:
- Observability VPC CIDR:
10.200.0.0/24. - Workload VPC CIDR:
10.20.0.0/16. - CloudWatch namespace:
Central/Observability/Metrics. - Collector log group:
/aws/ecs/observability-gateway/adot-collector.
Walkthrough
The walkthrough has four parts: deploy the gateway, connect a workload account, instrument workloads, and validate. You deploy from an account-agnostic Terraform module, so a new account is a new variables file, not a fork.
Step 1: Deploy the gateway
Clone the companion sample repository and change into it. Then stage the ADOT collector image in a private Amazon Elastic Container Registry (Amazon ECR) repository in the observability account, because the dedicated VPC has no internet egress:
The Terraform module provisions the dedicated Amazon ECS cluster and Auto Scaling group, the internal NLB with listeners on 4317 and 4318, and target groups with a health check on port 13133. It also creates the collector task definition and service, the collector AWS Identity and Access Management (IAM) role, the security group, and the CloudWatch log group.
Supply per-account values through a variables file:
aws_region         = "us-east-1"
stack_name         = "adot-gateway"
environment        = "prd"
vpc_cidr           = "10.200.0.0/24"
transit_gateway_id = "tgw-xxxxxxxxxxxxxxxxx"

# Add one entry per workload account you onboard
customer_vpc_cidrs = [
  "10.20.0.0/16",   # Workload account A
  # "10.30.0.0/16", # Workload account B (future)
]

# ADOT collector image, staged in a private Amazon ECR repository
adot_image = "<observability-account-id>.dkr.ecr.us-east-1.amazonaws.com/adot-collector:latest"

instance_type           = "t3.medium"
min_capacity            = 1
max_capacity            = 3
desired_capacity        = 2
collector_cpu           = 512
collector_memory        = 1024
collector_desired_count = 2
cloudwatch_namespace    = "Central/Observability/Metrics"
log_retention_days      = 90
Deploy through your pipeline or from a workstation with credentials for the observability account:
After the apply completes, retrieve the endpoint that workloads target — the internal NLB DNS name you use in Step 3:
The collector configuration defines the OTLP receivers, the batch and resource processors, and the X-Ray, CloudWatch EMF, and CloudWatch Logs exporters. The EMF exporter uses metric_declarations to limit dimensions and control cardinality and cost:
Step 2: Connect a workload account
Connecting a workload account is additive: you change only the network reachability and the allowlist, not the collector:
- Confirm the workload VPC is attached to the shared Transit Gateway.
- Add a route in the workload VPC route table for the observability VPC CIDR (
10.200.0.0/24) through the Transit Gateway, and a return route in the observability VPC for the workload CIDR (10.20.0.0/16). - Add the workload VPC CIDR to
customer_vpc_cidrsand apply to update the collector security group.
Workloads in that account can then reach the gateway. No collector is deployed there.
Step 3: Instrument workloads
Linux services with an OpenTelemetry SDK. Set three environment variables on the application container, then deploy a new task revision. The SDK reads them at startup, with no Dockerfile or code changes:
Windows .NET Framework services on IIS. These require Machine-level environment variables and an HTTP module, because IIS worker processes (w3wp.exe) read Machine-level variables only:
- Set Machine-level
COR_*andOTEL_*variables in the Dockerfile withsetx /M. Use theCOR_*prefix for .NET Framework (theCORECLR_*prefix is for .NET Core). - Register the
OpenTelemetry.Instrumentation.AspNet.TelemetryHttpModuleinweb.config. - Point
OTEL_EXPORTER_OTLP_ENDPOINTat the NLB HTTP listener on port 4318, rebuild the image, and deploy. - Remove the legacy sidecar container after you validate telemetry.
Infrastructure services with a Prometheus endpoint. Add an EC2 service discovery scrape configuration filtered by Auto Scaling group tag to the collector, and apply. Instance replacement doesn’t break scraping because targets are discovered by tag.
For accurate attribution, each workload should set service.name, deployment.environment, and ideally cloud.account.id (the AWS resource detector can populate account and Region).
Step 4: Validate end to end
Validate in layers so a failure points to the right place. First, confirm the ECS cluster is active, its instances are registered, and the collector service runs at its desired count. Then check NLB target health on both target groups:
Healthy targets return healthy for every entry.
Next, confirm telemetry flows. The collector logs should show the OTLP receivers listening with no exporter errors. Send a test request from a host that can route to the NLB. Any response, even an HTTP 400 from a malformed payload, verifies reachability:
Finally, confirm the data lands: the metric appears in the expected namespace and the trace appears in the AWS X-Ray service map:
A hanging connection usually means the source IP is not allowed or there is no route to the NLB, not an application fault.
Operational lessons
These findings reflect real deployment experience and are not documented elsewhere.
Preserve source identity. Don’t overwrite it. In the collector’s resource processor, use action: insert, not upsert. On a central gateway, upsert overwrites every account’s ClusterName with the gateway’s own and erases the true origin; insert keeps source-provided values and uses the gateway value only as a fallback.
Add the source account as a metric dimension, with a fallback. Add cloud.account.id to the EMF exporter’s dimensions to split metrics by account. Because EMF drops a metric if any declared dimension is missing, declare two dimension sets, one with cloud.account.id and one without, so sources that don’t yet emit it still publish.
Don’t use a container health check that depends on curl. The aws-otel-collector image has no curl or wget, so such a check always fails and recycles healthy tasks. Rely on the NLB target group health check on port 13133 and alarm on UnHealthyHostCount.
Plan for ENI limits on small instance types. Each awsvpc task consumes an elastic network interface (ENI), and a t3.medium supports only about three. Set deployment_maximum_percent = 100 and deployment_minimum_healthy_percent = 50 so a task drains before its replacement starts, or use larger instances.
Let the capacity provider own the instance count. With managed scaling, add lifecycle { ignore_changes = [desired_capacity] } to the Auto Scaling group so terraform apply doesn’t reset capacity and terminate instances the capacity provider launched.
Troubleshooting the internal NLB health-check loop
The most common first-deployment failure is a collector that registers, fails its health check, drains, and is replaced in a loop. Its own logs, meanwhile, show the OTLP receivers starting cleanly. The security group almost always causes this, because of how an internal NLB sends traffic.
Symptom. In the Amazon ECS console, the collector service never reaches a steady running count. Tasks cycle through PROVISIONING, RUNNING, and DEPROVISIONING, and the target group shows targets moving between initial, unhealthy, and draining. The collector’s own logs contain no errors, which is what makes this misleading.
Why it happens. NLB health checks don’t come from your telemetry clients. They originate from the NLB nodes, whose private IPs live in the load balancer’s subnets. With IP targets and client IP preservation off, forwarded data traffic can arrive from those same addresses. If the collector security group allows only your workload client CIDRs, the probe from the NLB subnet is dropped, the target never turns healthy, and Amazon ECS recycles it.
Diagnose. Work from the load balancer inward. Check the target state; unhealthy points to the health check, while unused means no target is registered (a service or task-placement problem):
Confirm the health check uses TCP on port 13133 and the collector’s health_check extension listens on 0.0.0.0:13133. Then inspect the collector security group inbound rules. If the only sources are workload client CIDRs, you have found the cause:
Finally, from a host in the observability VPC, open a TCP connection to the task IP on port 13133. A refused connection indicates the collector. A timeout indicates the security group:
Resolve. Allow the OTLP and health-check ports from the VPC CIDR in addition to your client CIDRs, so probes from the NLB subnets reach the targets. Derive the VPC CIDR from a data source rather than maintaining it by hand:
data "aws_vpc" "selected" { id = var.vpc_id }

locals {
  ingress_cidr_blocks = distinct(concat(
    var.allowed_cidr_blocks,
    [data.aws_vpc.selected.cidr_block],
  ))
}
Verify. Targets move to healthy within a health-check interval or two, and the service settles at its desired count. Add a CloudWatch alarm on UnHealthyHostCount so a regression pages you instead of silently recycling tasks. If targets stay unhealthy after the fix, suspect a health-check port mismatch or the container not listening on 13133, not the NLB behavior.
Extending beyond Amazon ECS
The gateway doesn’t inspect what kind of compute sends its telemetry. Any source that produces OTLP and can route to the internal NLB over the private network is a valid client, so the same fleet also serves Amazon EKS pods, AWS Lambda functions, Amazon EC2 applications, and on-premises services. The onboarding pattern is identical to an ECS account: attach the source VPC to the Transit Gateway, add its CIDR to the allow list, and set service.name, deployment.environment, and ideally cloud.account.id on the workload. Services that emit neither OTLP nor a Prometheus endpoint (such as Amazon ElastiCache) need a sidecar exporter or are read from Amazon CloudWatch. Extending to a new source type is a collector configuration change, not a new fleet. The companion repository covers each source type in detail.
Design considerations and best practices
Treat the gateway as shared production infrastructure. These are the design choices that keep it reliable and affordable as you onboard more accounts. The companion repository covers additional practices: planning for backpressure, monitoring the collector’s own health, choosing push versus pull per source, and rolling out collector configuration safely.
Keep the module account-agnostic. Drive every account-specific value (AWS Region, CIDRs, allowlist, capacity) from a variables file and keep the module identical across deployments. Onboarding an account becomes a variables change and a route, not a fork. This is the single most important choice for long-term maintenance.
Choose the launch type deliberately (this solution uses Amazon ECS on Amazon EC2). An always-on fleet with a predictable baseline is where Amazon EC2 is most cost-effective: right-size instances, bin-pack stateless tasks per host, and apply AWS Savings Plans or AWS Graviton. The trade-off is that you own AMI patching, capacity-provider tuning, and the ENI-per-instance limit. AWS Fargate removes both at a higher per-task cost and suits a smaller gateway. The collector is stateless either way.
Scale across Regions with regional gateways, not one global gateway. Because the module takes aws_region as an input, a new Region is a new variables file. Prefer one gateway per Region: workloads send OTLP to the in-Region endpoint, which keeps telemetry local and limits scope, and matters because AWS X-Ray and Amazon CloudWatch are regional. Use Amazon CloudWatch cross-account observability for a single view across Regions. If you must centralize into one Region, use AWS Transit Gateway inter-Region peering and accept the cross-Region transfer cost and latency.
Size for availability, not just load. Run at least two collector tasks across two Availability Zones behind the NLB so a task or host replacement doesn’t drop telemetry. The collector is stateless, so scale it horizontally and let the capacity provider manage host count.
Govern metric cardinality centrally. The gateway is the one place to control which resource attributes become CloudWatch dimensions. Declare only the dimensions you query on, and keep high-cardinality attributes as log fields. Doing this at the gateway controls cost across all source accounts at once.
Security considerations
- Private transport. The NLB is internal. Network routing and the security group source ranges govern access. There is no application-layer authentication on the OTLP endpoint, so restrict source ranges to onboarded CIDRs and rely on private connectivity through the Transit Gateway.
- Encryption in transit. The NLB uses Layer 4 TCP listeners and doesn’t terminate TLS. Traffic stays on the AWS private network across the Transit Gateway. If your compliance framework requires end-to-end encryption, add TLS at the NLB with an AWS Certificate Manager certificate or on the collector’s OTLP receiver, and consult your legal or compliance team on which requirements apply.
- Least-privilege IAM. Give the gateway hosts their own role with standard ECS-on-EC2 permissions plus AWS Systems Manager for management and patching. Do not reuse an application instance role that carries workload-specific permissions.
- No internet egress. Run the dedicated VPC without a NAT gateway. Pull the collector image from a private Amazon ECR repository and reach AWS services through interface and gateway VPC endpoints.
- Encryption at rest. Consider a customer-managed AWS Key Management Service (AWS KMS) key for the CloudWatch log groups if your policy requires customer-managed encryption.
Cost considerations
A single fleet replaces one collector per account, which reduces the number of EC2 hosts, log groups, and IAM roles you operate. A representative gateway of two t3.medium instances, one internal NLB, and the collector log group runs in the low tens of dollars per month, plus CloudWatch metric and log ingestion that scales with telemetry volume.
Watch metric dimension cardinality. EMF converts OTLP metrics to CloudWatch metrics through log ingestion, and converting every resource attribute inflates both EMF records and the number of custom metrics. Declare only the dimensions you query on.
Cleanup
To avoid ongoing charges, remove the resources when you are done:
- Remove workload onboarding: delete the workload CIDR from
customer_vpc_cidrsand remove the Transit Gateway routes you added. - Run
terraform destroyfor the gateway deployment in the observability account. - Confirm the NLB, ECS cluster, Auto Scaling group, and CloudWatch log groups are deleted, and delete any CloudWatch metrics or dashboards you created for validation.
Conclusion
A centralized ADOT gateway replaces the collector-per-account model with one ingestion endpoint and one fleet, and serves both Linux and Windows ECS workloads that can’t host a sidecar. The value is in the details. Keep the module account-agnostic, preserve source identity instead of overwriting it, and attribute metrics by source account. Give the gateway its own least-privilege role, and remember that an internal NLB health-checks from the VPC subnet range, not from your clients.
To learn more, see the AWS Distro for OpenTelemetry documentation, the Amazon CloudWatch embedded metric format, Using AWS X-Ray with Amazon ECS, and AWS Transit Gateway. This post builds on and complements related cross-account approaches. See Using AWS Distro for OpenTelemetry Collector for cross-account metrics collection on Amazon ECS and Implement centralized observability for multi-account Amazon EKS, plus CloudWatch cross-account observability and cross-account cross-Region metrics centralization.
Deploy the pattern in your own environment with the companion sample repository, adapt the collector configuration to your source accounts, and tell us in the comments how it worked for your estate.