Containers
Implement centralized observability for multi-account Amazon EKS
When a critical issue occurs in your Amazon Elastic Kubernetes Service (Amazon EKS) infrastructure, you race against time. With clusters spread across dozens of AWS accounts and multiple AWS Regions, you’re forced to switch between consoles, hunt through separate log groups, and manually correlate metrics while your customers experience degraded service. Multi-account monitoring fragments your visibility when you need it most.
If you’re already running Container Insights and Amazon CloudWatch monitoring on your EKS clusters, you have observability coverage, but your data remains siloed across accounts. You and your team waste critical minutes during incidents switching between consoles, correlating metrics manually, and searching for the right log groups. This time directly impacts Mean Time to Resolution (MTTR) and customer experience.
This post shows you how to unify your existing Container Insights and CloudWatch data into a centralized monitoring hub using a hub-and-spoke architecture. You will unify fragmented observability data into a single pane of glass that maintains security boundaries while removing the need for account switching. The solution requires no changes to your existing monitoring infrastructure. It connects what you already have. You will reduce incident response time by removing context switching between accounts and Regions. From one console, you will identify clusters experiencing elevated error rates, spot pod CPU and memory spikes, and track which clusters require version upgrades organization wide. This visibility helps you add capacity before issues occur.
What you will learn
In this post, we walk you through three key steps to unify your multi-account Amazon EKS monitoring. First, you will enable the Amazon EKS Dashboard to gain organization-wide visibility into cluster health and upgrade requirements. Next, you will configure CloudWatch cross-account observability to share telemetry data across account boundaries without role switching. Finally, you will create cross-account cross-Region dashboards that display metrics from multiple accounts and Regions in a single console. At the end of this process, you will have a centralized monitoring hub with complete visibility across your entire Amazon EKS infrastructure.
Prerequisites
This post assumes that you already have:
- AWS Organizations with multiple accounts containing Amazon EKS clusters
- Container Insights enabled on your Amazon EKS clusters
- Amazon CloudWatch agent or AWS Distro for OpenTelemetry (ADOT) deployed
- Existing metrics, logs, or traces
- A designated central monitoring AWS account
- AWS Identity and Access Management (IAM) permissions to configure cross-account access
Enabling Amazon CloudWatch cross-account observability requires IAM permissions for the CloudWatch Observability Access Manager (OAM) service to create sinks (receiving ends) in the monitoring account and links in source accounts. Key permissions include oam:CreateSink and oam:PutSinkPolicy in the monitoring account (scoped to arn:aws:oam:*:MONITORING-ACCOUNT-ID:sink/*), and oam:CreateLink in source accounts (scoped to arn:aws:oam:*:SOURCE-ACCOUNT-ID:link/*). Following least-privilege principles, grant these permissions only to administrators or automation roles responsible for configuring observability. For more information, see the Amazon CloudWatch Observability Access Manager API Reference.
Architecture overview
This solution implements a hub-and-spoke monitoring architecture:
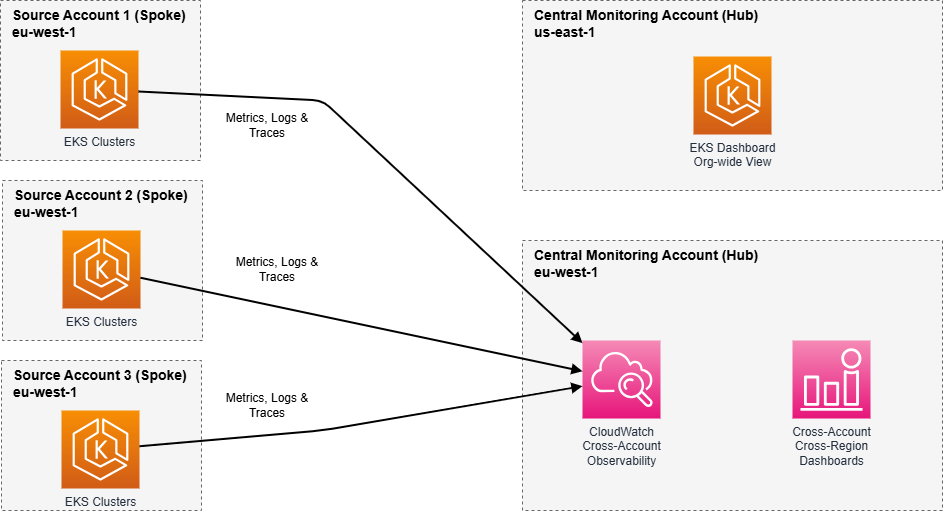
This architecture provides centralized visibility while maintaining account isolation, supports growth from tens to thousands of accounts, and maintains audit trails that record which accounts share telemetry data, supporting compliance and security auditing requirements.
Why hub-and-spoke for multi-account monitoring?
The hub-and-spoke pattern is recommended for multi-account EKS monitoring because it centralizes data in a single monitoring account (the hub) while allowing individual workload accounts (the spokes) to maintain operational independence. This approach provides several advantages. You configure monitoring once in the hub rather than managing separate infrastructure in each account. Security boundaries remain intact because data flows one direction from spoke to hub. New accounts connect seamlessly by creating a single link to the existing hub. You maintain audit trails showing exactly which accounts contribute telemetry data. Unlike federated approaches that query each account in real-time, the hub-and-spoke model pre-aggregates data for faster dashboard performance and reduced cross-account API calls.
Note: This post demonstrates a two-account setup: one monitoring account and one source account. The same pattern applies when adding additional source accounts.
Key concepts: Two approaches to cross-account monitoring
Before implementing the solution, it’s important to understand the two complementary approaches that this architecture uses to achieve unified monitoring. Each serves a distinct purpose and works together to provide complete observability.
CloudWatch cross-account observability
Cross-account observability automatically replicates telemetry data from your source accounts into your monitoring account within the same AWS Region. Think of this as creating a unified data lake where metrics, logs, and traces from multiple accounts are accessible as if they were generated locally. Once configured, you query this shared data without assuming roles or switching accounts. The monitoring account has direct access to the telemetry. This approach is recommended for within-Region monitoring, log analysis using Amazon CloudWatch Logs Insights across multiple accounts, and building dashboards that combine metrics from different accounts in the same Region.
Cross-account cross-Region dashboards
Cross-account cross-Region dashboards use IAM role assumption to query CloudWatch data across both account and Region boundaries on-demand. Rather than replicating data, these dashboards retrieve metrics in real-time by assuming roles in source accounts. This approach extends your visibility beyond Regional boundaries, so you can monitor us-east-1 and eu-west-1 resources from a single dashboard. Use this when you must visualize metrics across multiple AWS Regions, create executive dashboards showing global infrastructure health, or compare performance across geographically distributed clusters.
How they work together
Step 2 (cross-account observability) creates your Regional data foundation, making it fast and efficient to query telemetry within a Region. Step 3 (cross-account cross-Region dashboards) extends this visibility across Regions using role assumption. Together, they provide both depth (within-Region analysis) and breadth (cross-Region overview) in a single monitoring solution.
Implementation
This solution involves three complementary approaches: strategic visibility through the Amazon EKS Dashboard, operational monitoring through CloudWatch cross-account observability, and cross-Region visualization through cross-account cross-Region dashboards. Each step is independent, but you can implement all three for comprehensive monitoring.
Step 1: Enable Amazon EKS dashboard for organization-wide visibility
The first component of your hub-and-spoke monitoring architecture is the Amazon EKS Dashboard. The dashboard provides strategic visibility into cluster health, upgrade requirements, and cost projections across your entire Amazon EKS estate. This dashboard serves as your executive view, answering questions like “Which clusters need upgrades?” and “What are my extended support costs?” while the subsequent steps provide the operational depth for troubleshooting and real-time monitoring.
Amazon EKS updates the dashboard every 12 hours, so it doesn’t provide real-time data. For setup instructions, see Configure Amazon EKS Dashboard integration with AWS Organizations.
After enabled, switch to your monitoring account and open the Amazon EKS console in us-east-1. Choose Dashboard from the left navigation.
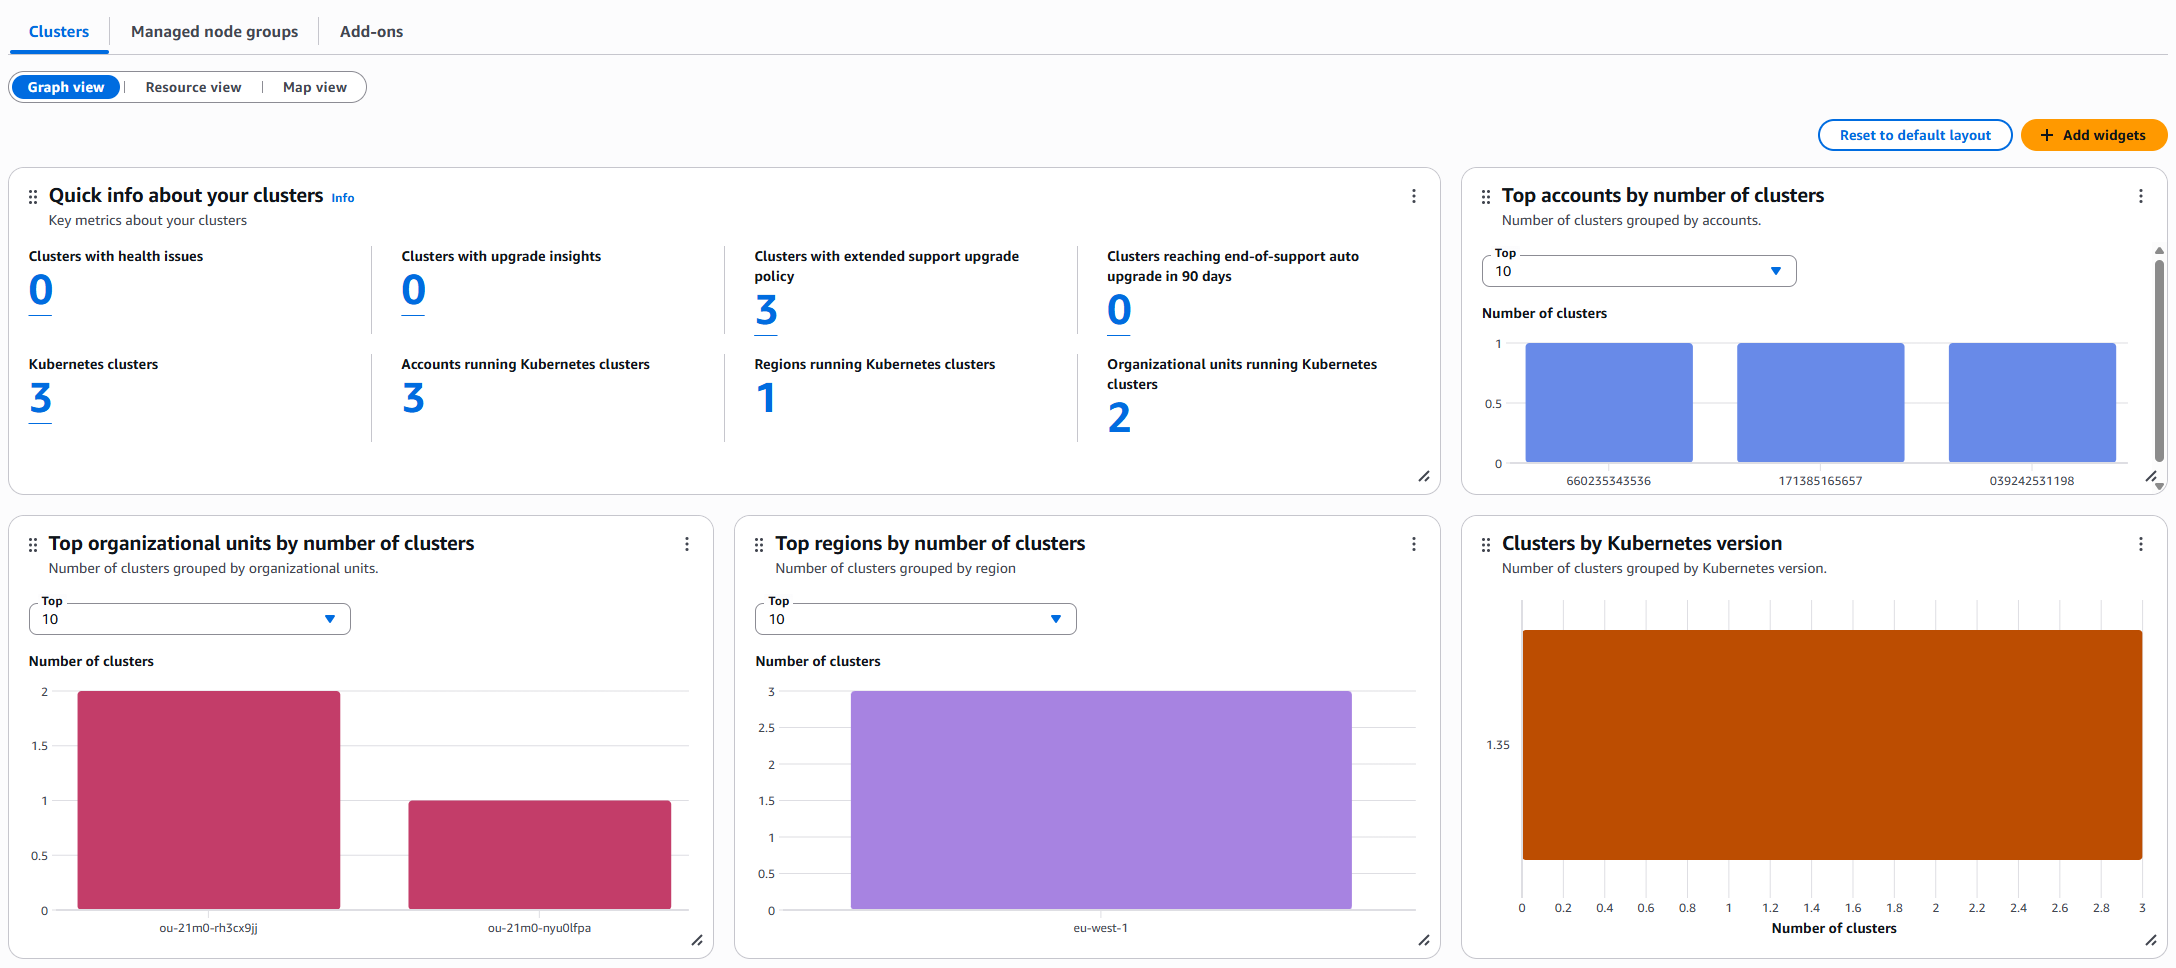
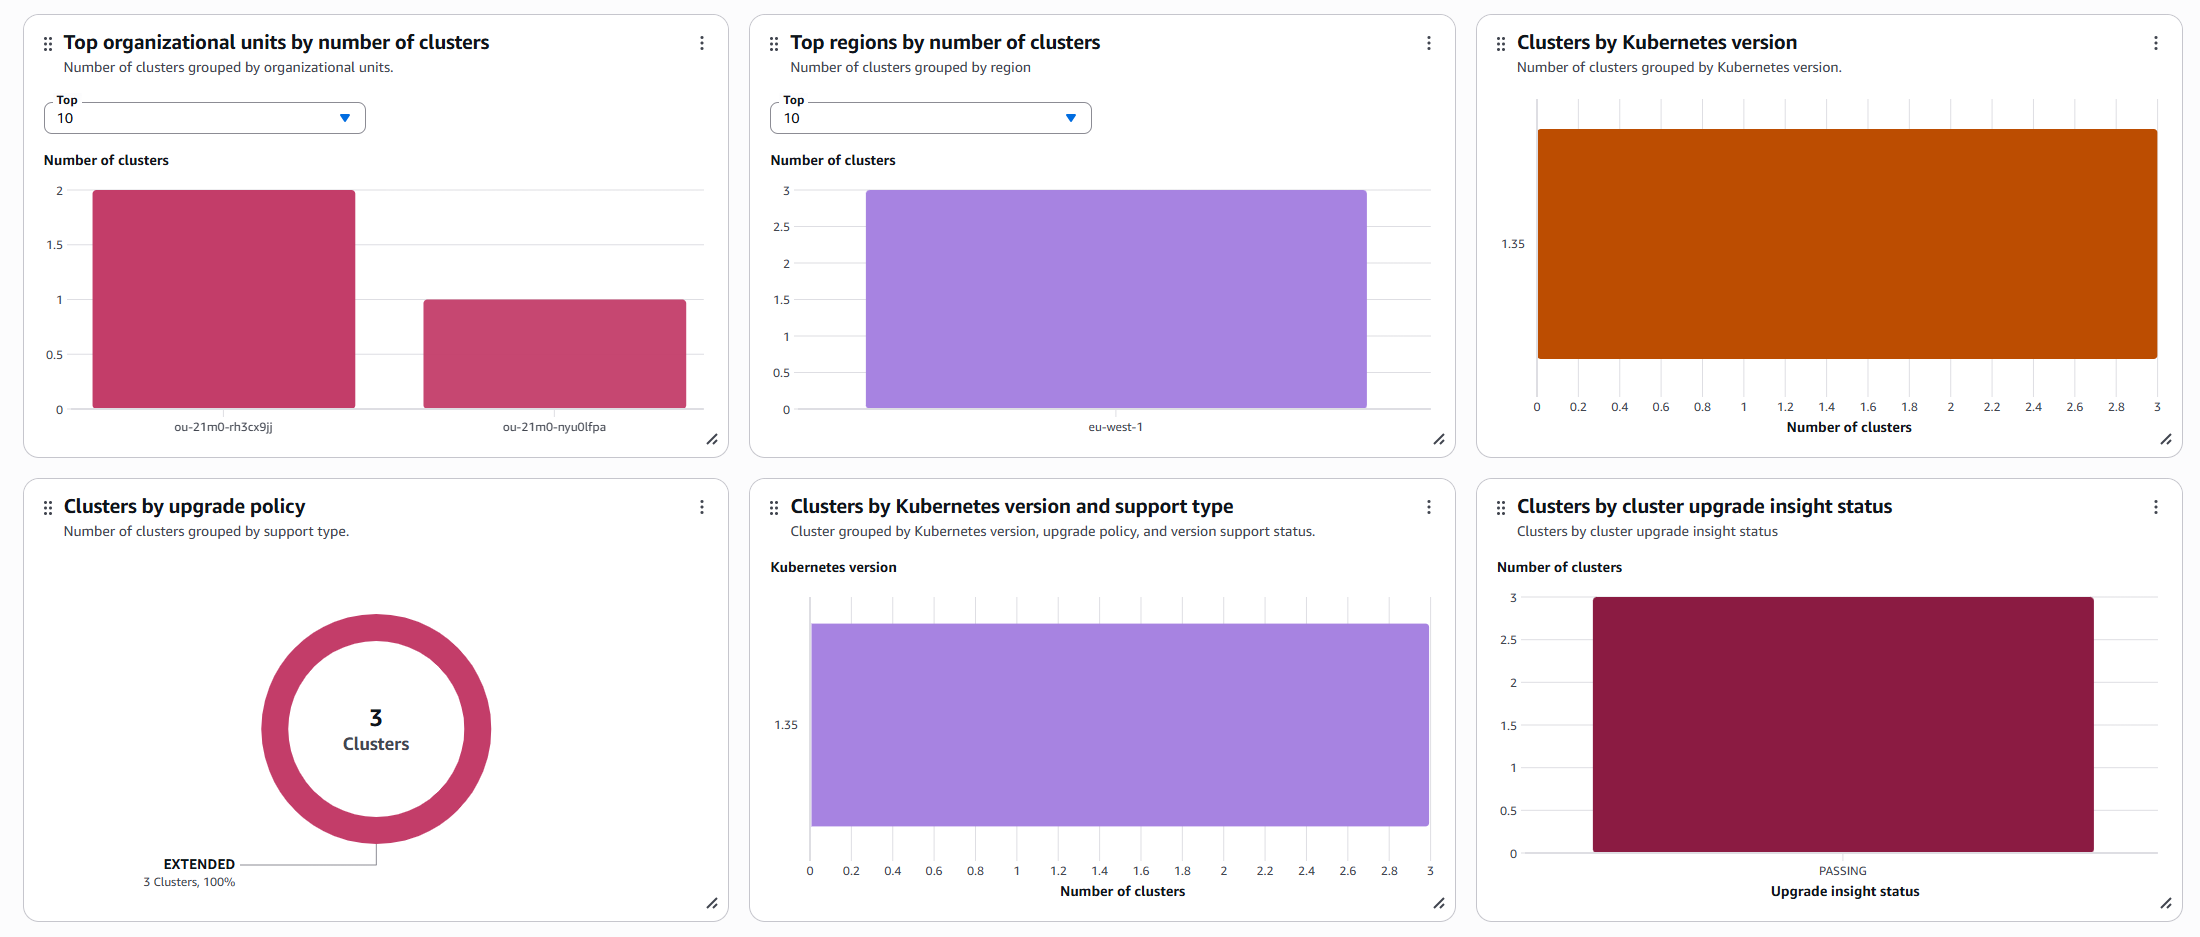
You now have organization-wide visibility into your Amazon EKS clusters. The dashboard displays cluster health status, Amazon EKS control plane cost projections, and which managed node groups are running specific Amazon Machine Image (AMI) versions. You can also see your cluster support type distribution and use integration with Amazon EKS Cluster Insights to identify discontinued API usage across your fleet.
The Amazon EKS Dashboard provides strategic visibility into which clusters need attention. CloudWatch cross-account observability provides the operational depth with detailed metrics, logs, and traces for troubleshooting.
Step 2: Configure CloudWatch cross-account observability
While Step 1 gave you strategic visibility, Step 2 establishes the operational data layer for deep observability across account boundaries without role switching. This is where you gain access to the detailed metrics, logs, and traces needed to troubleshoot the issues identified in the Amazon EKS Dashboard. CloudWatch cross-account observability is a Region-based feature, so you must create sinks and links in each Region where you want to view data.
For this post, we configure everything in eu-west-1 where our Amazon EKS clusters are deployed.
2.1: Create a sink in your central monitoring account
You will create a sink that serves as a secure attachment point. This allows your source accounts to share telemetry data with your monitoring account while maintaining IAM-based access controls that enforce least-privilege permissions. Think of it as a receiving endpoint that authorizes which accounts can send data and what types of telemetry they can share. Create a sink in the same Region as the source account.
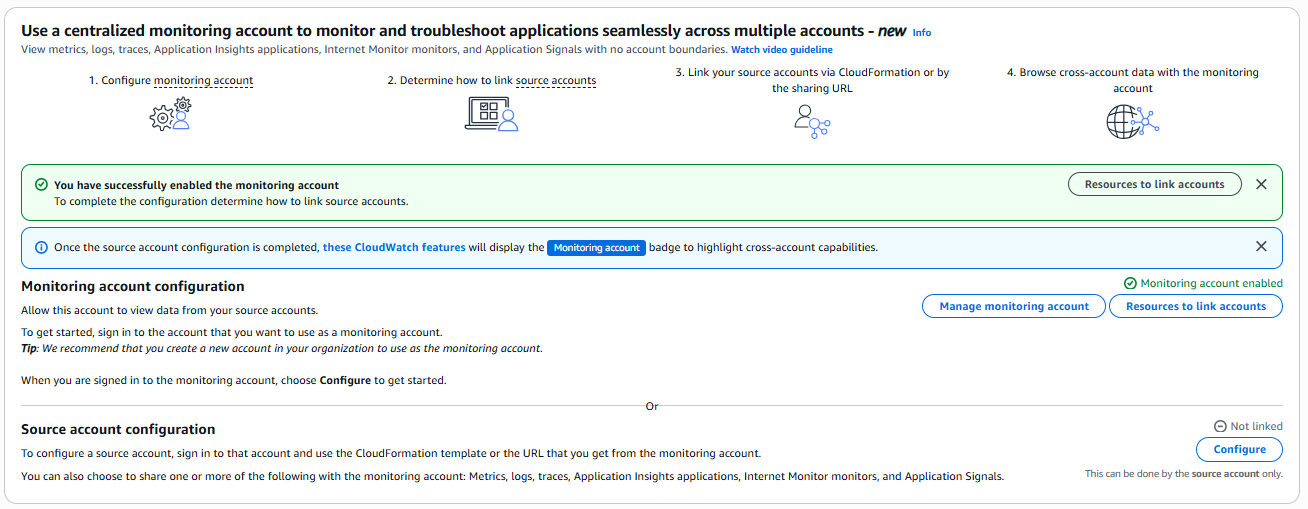
From your monitoring account, open the CloudWatch console in the eu-west-1 Region. Go to the Settings page, then under Monitoring account configuration, choose Configure.
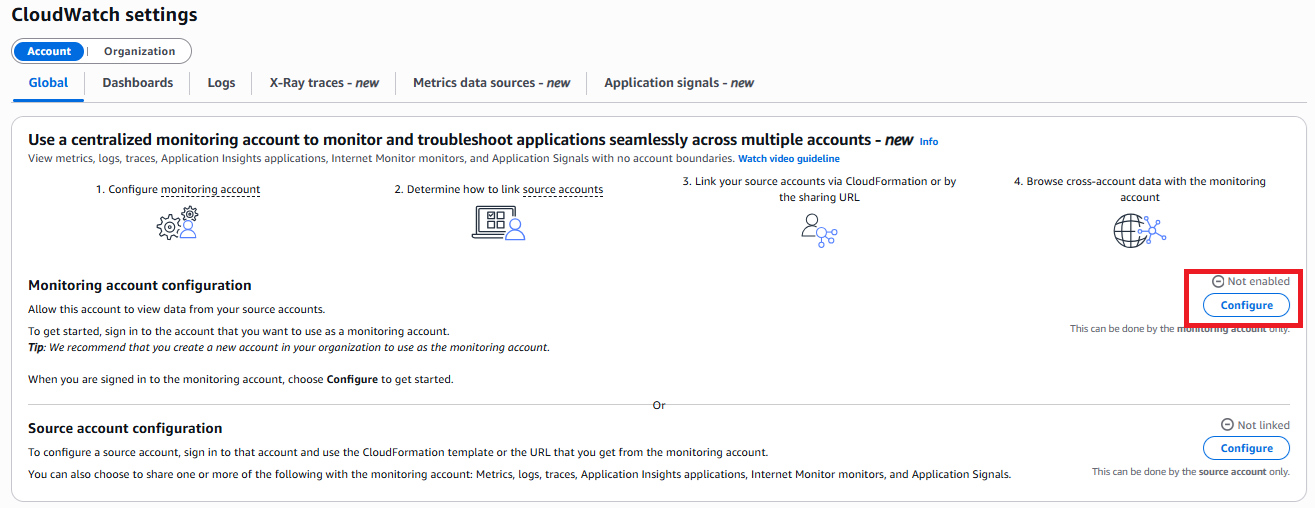
Under Monitoring account configuration, select the telemetry data types that you want to receive from source accounts (metrics, logs, traces, or application insights). Specify source accounts either by individual Account IDs or by using organization IDs to include accounts in your AWS Organization. Define a label for the source accounts. This label differentiates the telemetry data coming from each source account in your monitoring views.
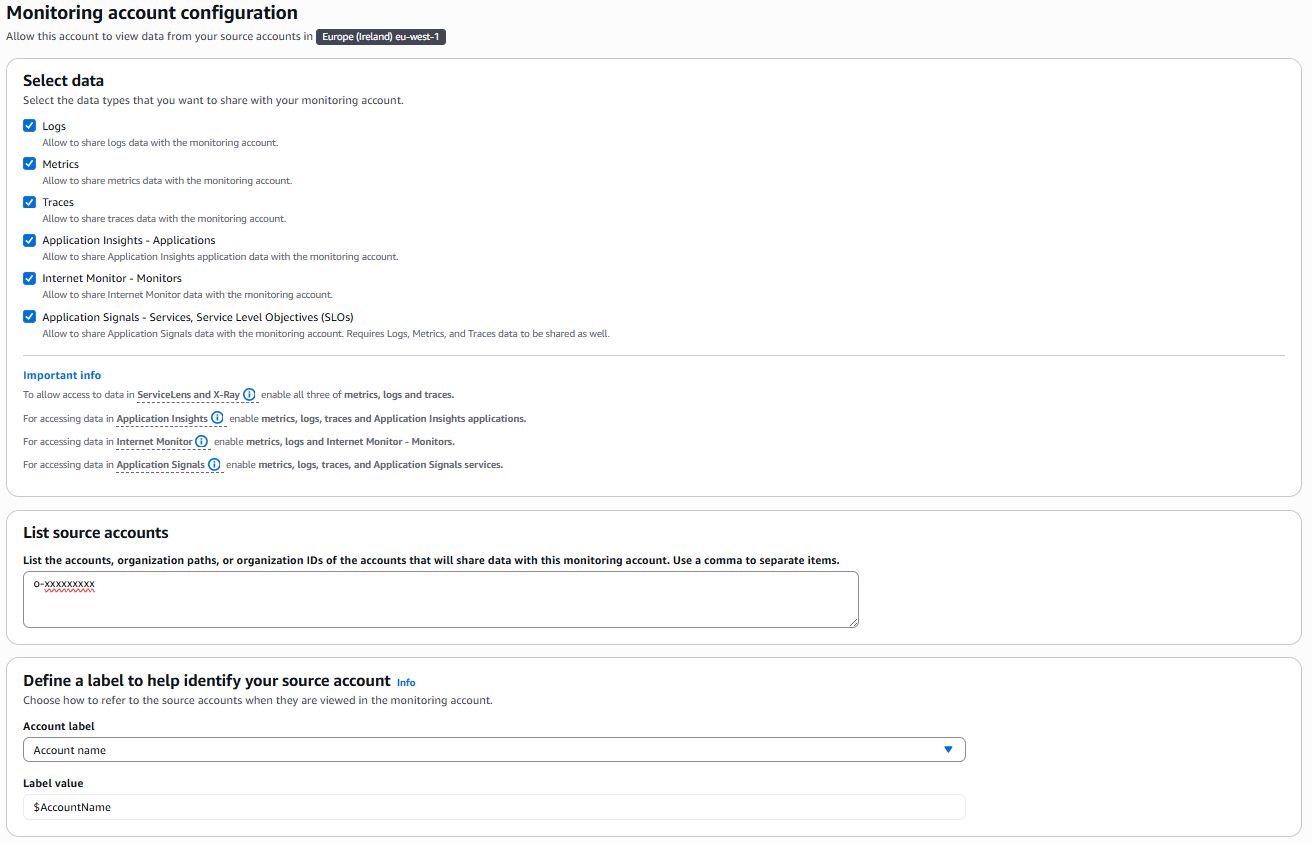
After you’re done, choose Configure on the bottom right corner.
2.2: Create Links in source accounts
You will now establish links that connect your source accounts to the monitoring account sink. While the sink defines what data can be received, links control what data is actually sent. This two-way authorization model requires that both accounts explicitly agree to the data sharing relationship, enforcing explicit consent and maintaining account isolation for security and compliance auditing. Create a link in each source account containing Amazon EKS clusters or other AWS workloads to connect to the monitoring account sink. We demonstrate this with one source account, but you can repeat these steps for each additional source account that you want to connect.
You can enable the link from each source account manually on a per-account, per-Region basis. However, the monitoring account console also provides AWS CloudFormation templates to manage these relationships through infrastructure as code (IaC).
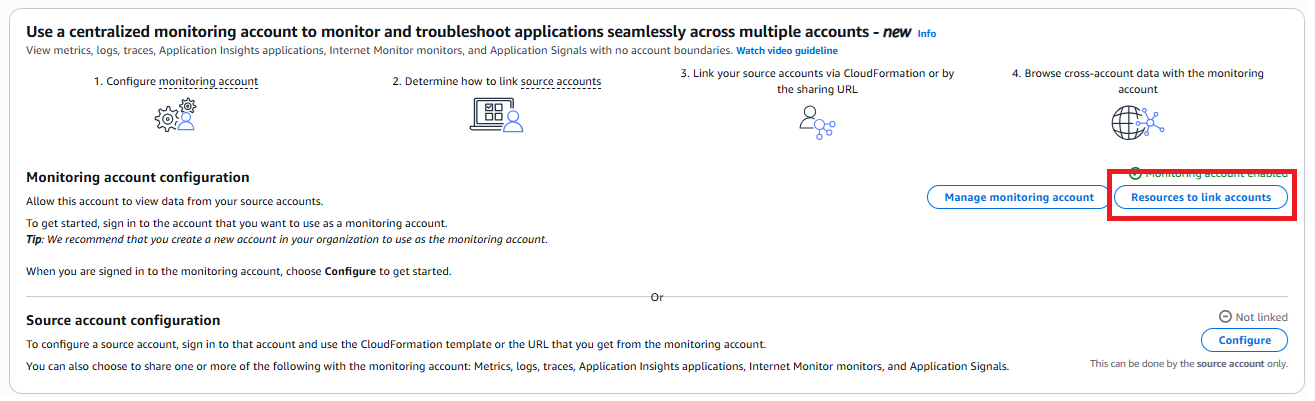
Back in the monitoring account, open CloudWatch and go to Settings. Select Resources to link accounts.
Choose Download CloudFormation template:
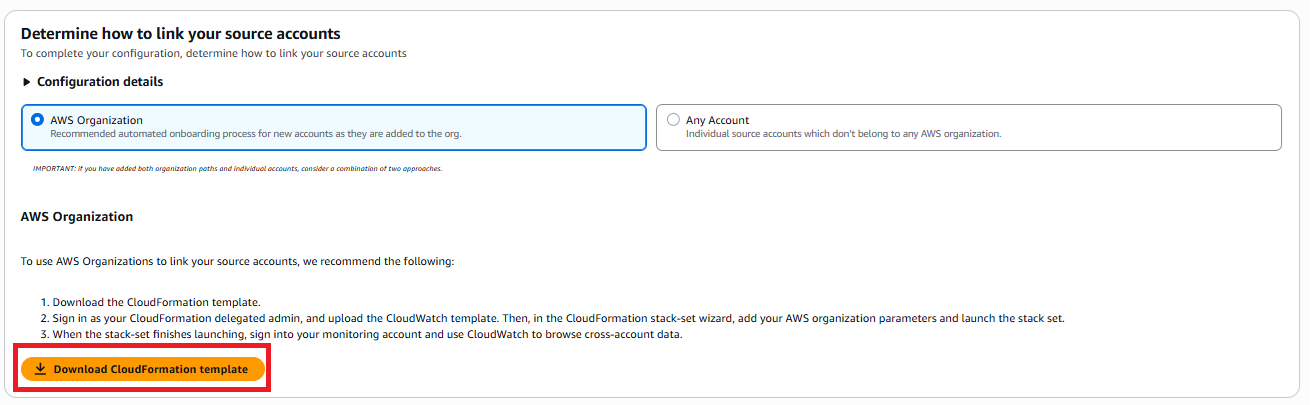
Switch to your source account and open the CloudFormation console in the same Region. Select Create stack, then upload the template that you downloaded from the monitoring account.
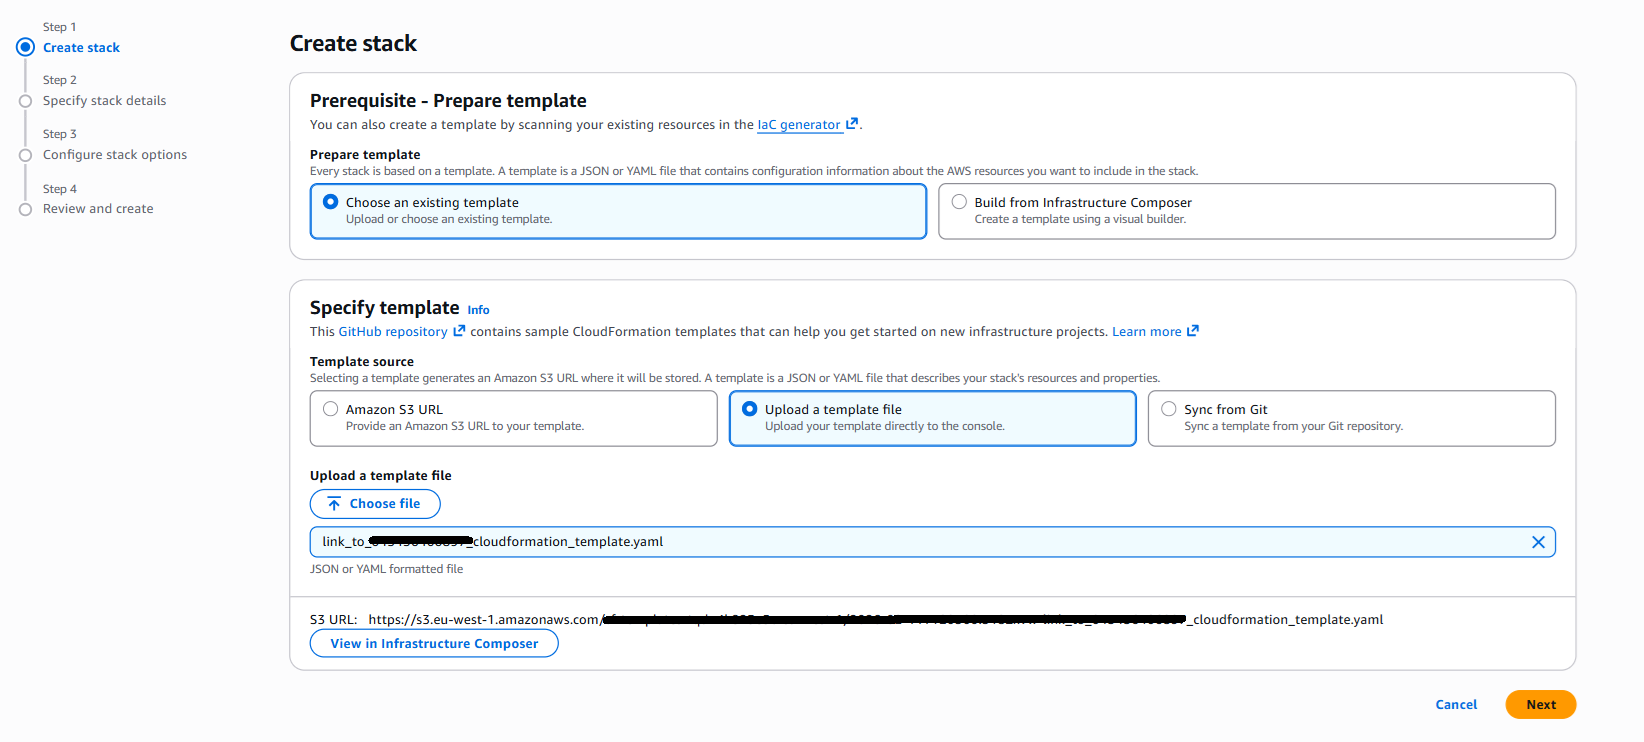
Continue through the wizard, enter your stack name and other required CloudFormation parameters, then select Submit on the final page. Repeat the same process for the other source accounts in your AWS Organization.
Scaling to multiple accounts:
For organizations managing dozens or hundreds of accounts, manually creating links in each account becomes impractical. CloudFormation StackSets provide automation by deploying the same link configuration across multiple accounts simultaneously, either targeting specific accounts or entire organizational units.
For organizations with many accounts, use CloudFormation StackSets to deploy links across accounts in an organizational unit:
For more information, see CloudWatch cross-account observability.
2.3: Verify cross-account access
Verify that your monitoring account can access telemetry data from source accounts. Check both metrics and logs to confirm that the configuration works correctly.
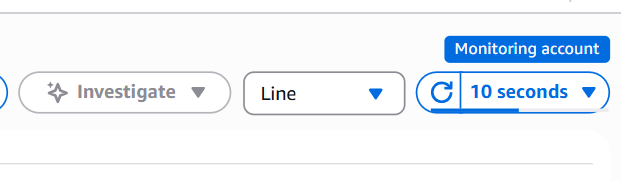
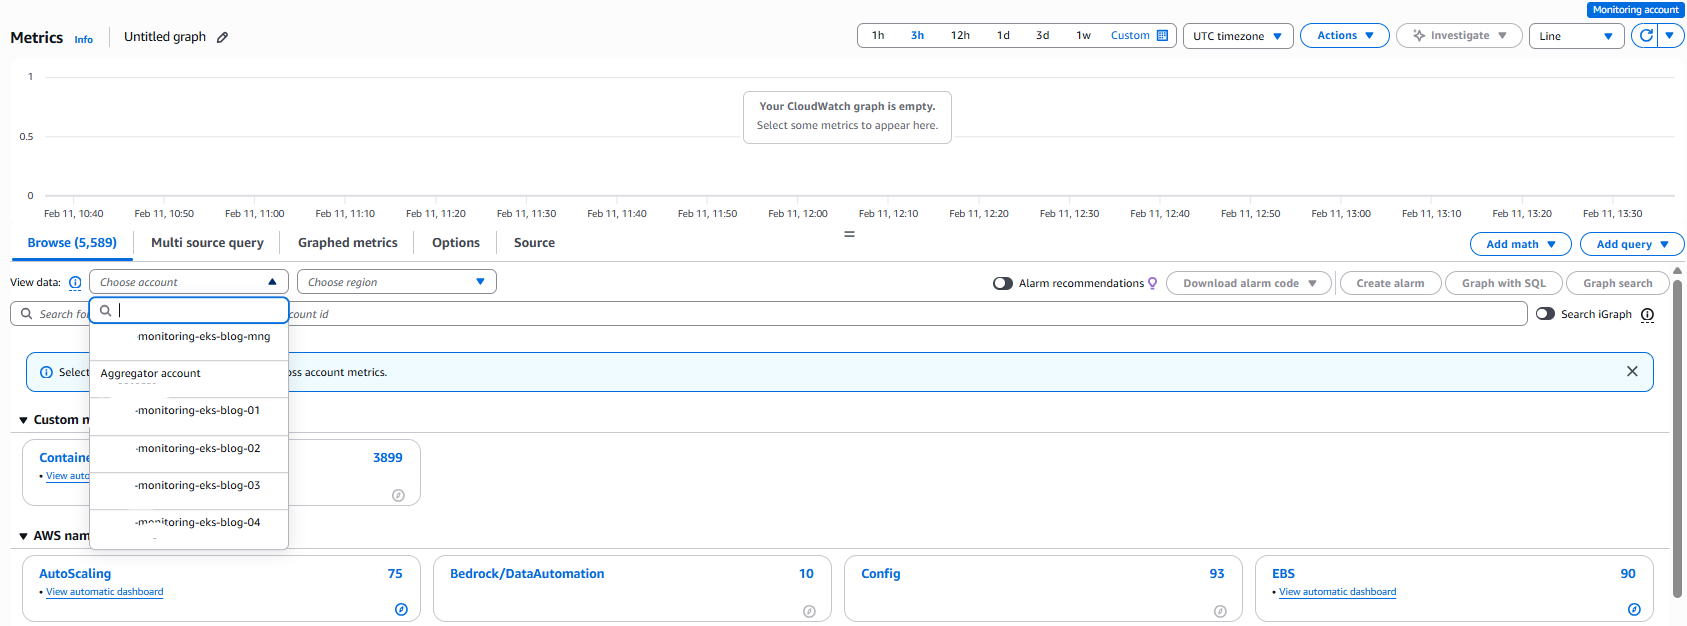
From your monitoring account, open the CloudWatch console and select Metrics, then All Metrics. You will see a blue ribbon labelled “Monitoring account”
After 1–2 minutes, the metrics console now displays the available metrics from each source account and Region in a single view.
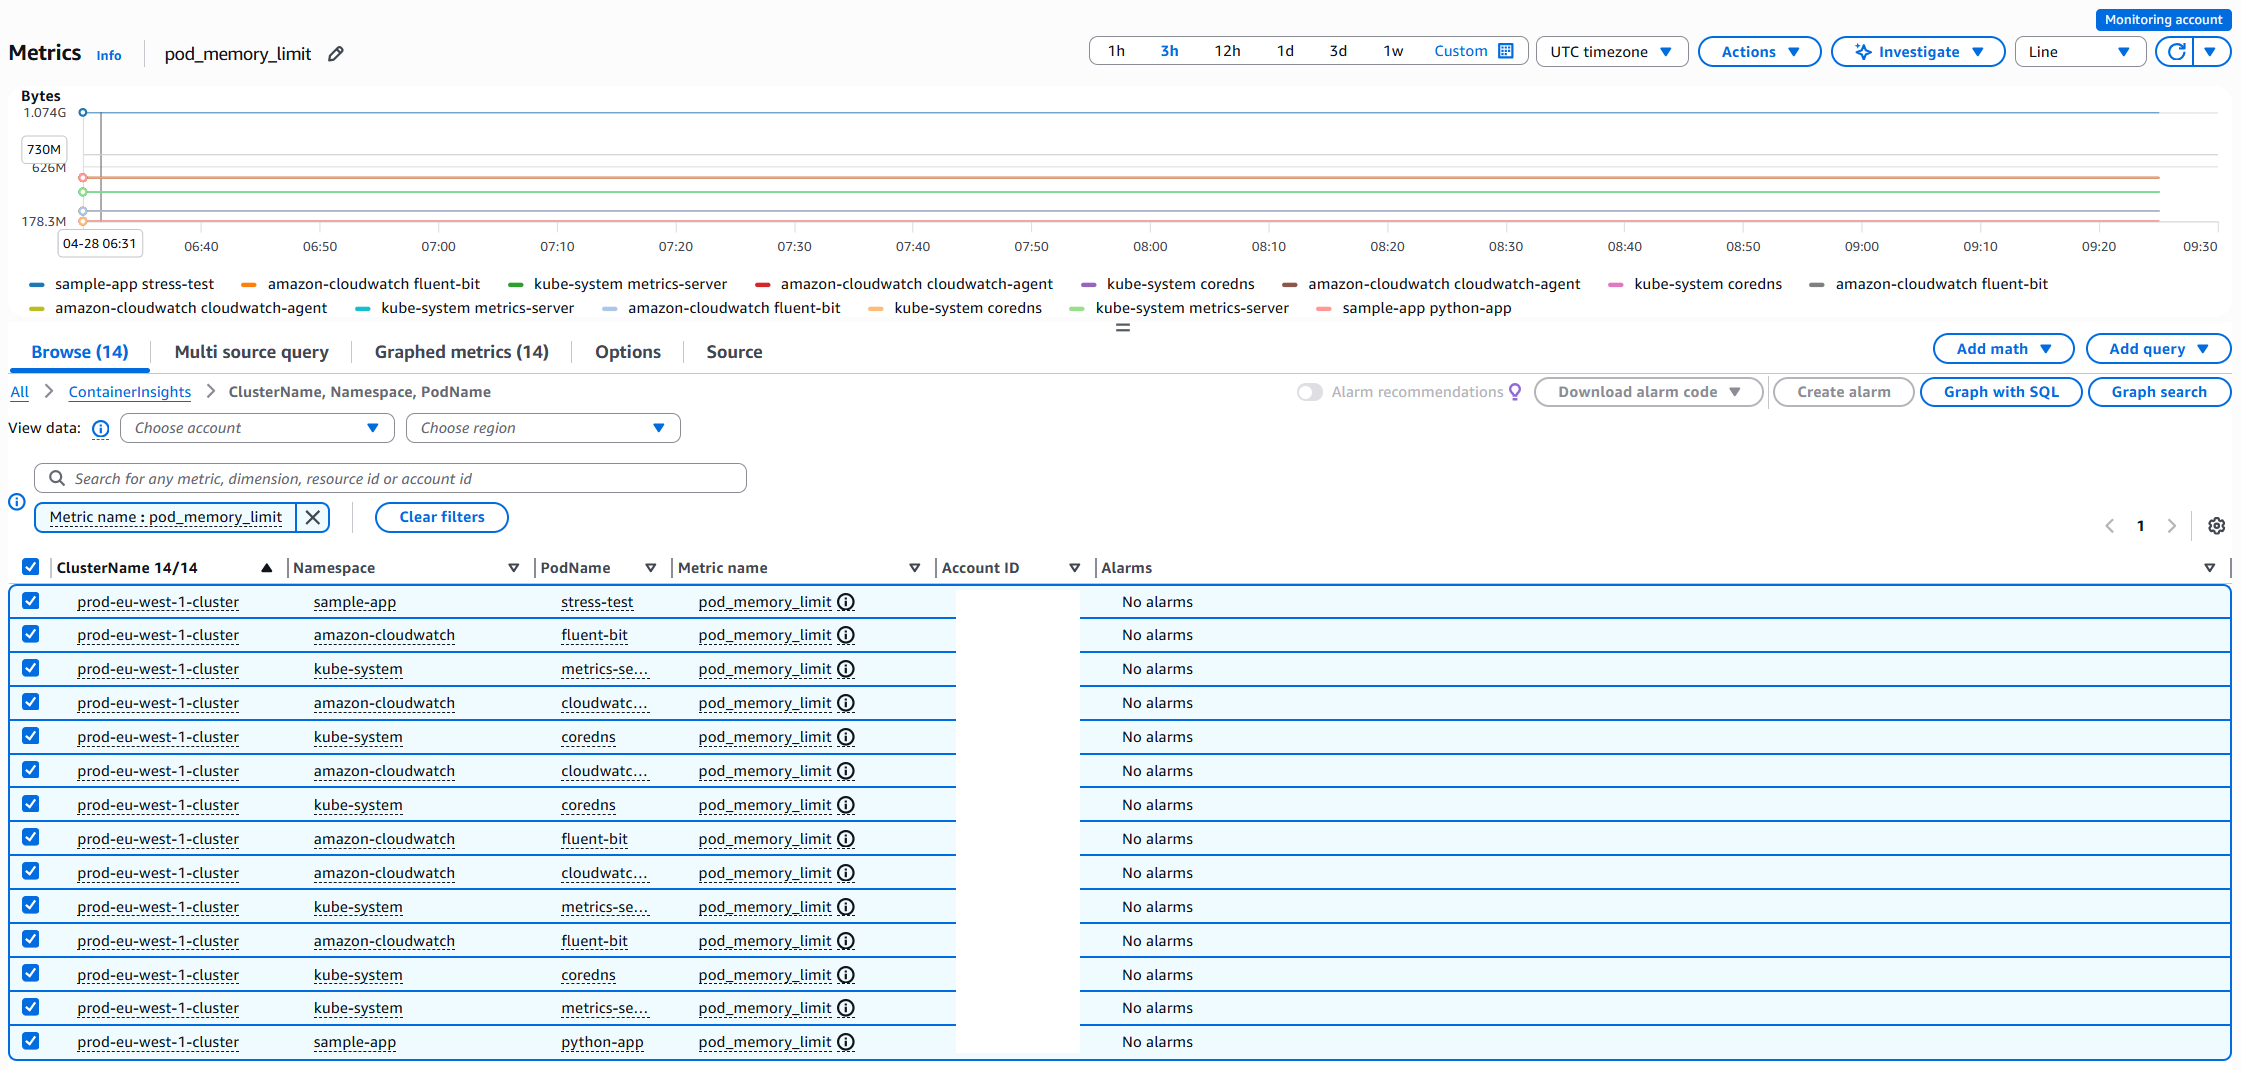
CloudWatch appends an Account ID to each metric in the Metric table, so you can differentiate between metrics from different accounts.
Logs
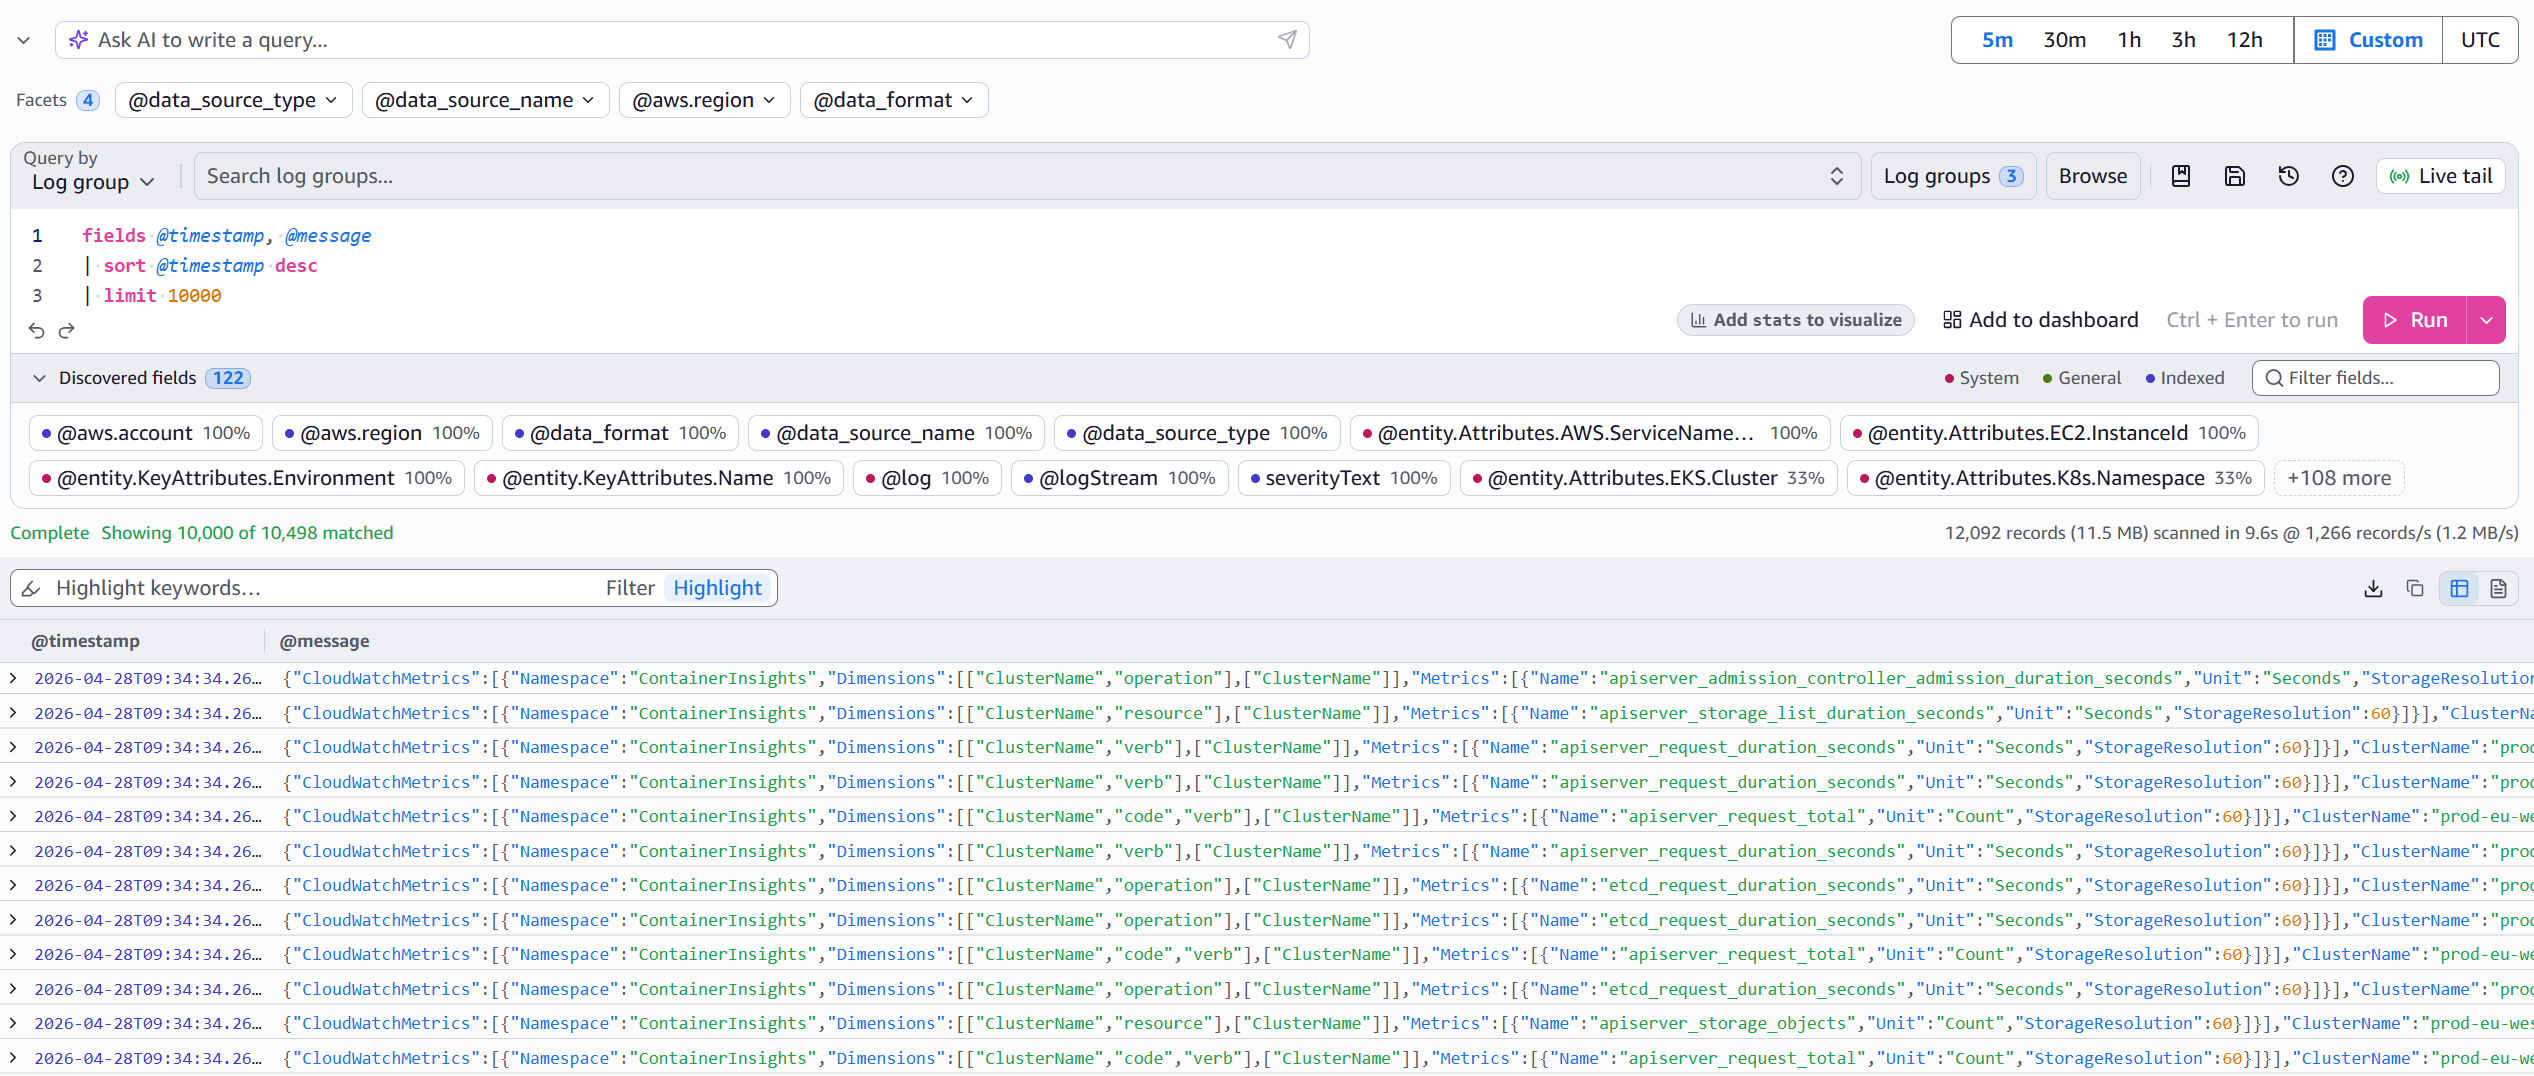
Next, verify log access by going to Log groups in the CloudWatch console. Verify that you can see log groups from source accounts, such as /aws/containerinsights/<cluster-name>/performance
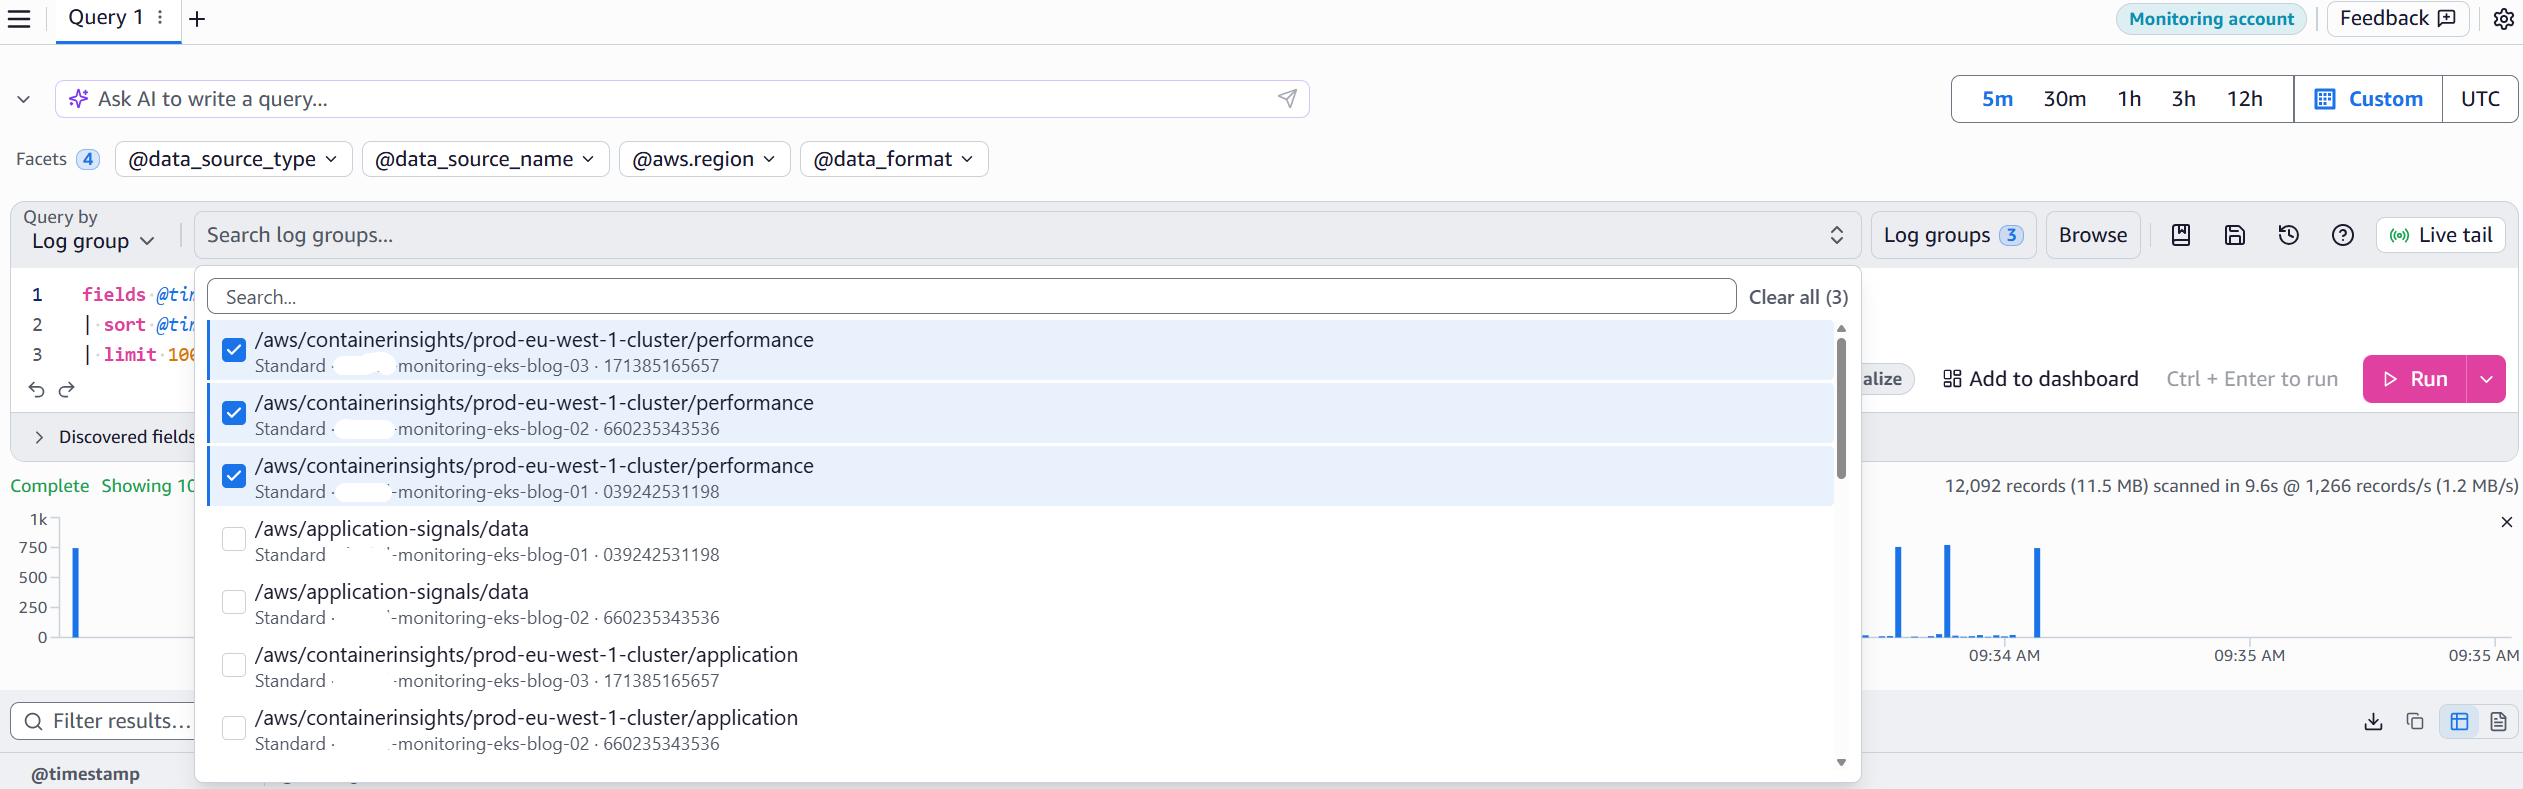
You can now query multiple log groups across multiple accounts using CloudWatch Logs Insights to troubleshoot and review logs at scale from a single Region.
Note: For compliance or security requirements that mandate log centralization in a single account, see the documentation on Cross-account cross-Region log centralization or this related blog post.
Cross-account observability now provides unified metrics and logs within eu-west-1. To monitor clusters across multiple Regions, you need cross-account cross-Region dashboards.
Step 3: Enable cross-account cross-Region dashboard functionality
The final component creates your operational command center with dashboards that display metrics from multiple accounts and Regions simultaneously. While the EKS Dashboard (Step 1) provides strategic visibility, and cross-account observability (Step 2) enables Regional monitoring, cross-account cross-Region dashboards complete the solution by extending your view across all your Regions. As explained in the Key Concepts section, cross-account cross-Region dashboards complement the observability configuration from Step 2 by extending visibility across Region boundaries using IAM role assumption. While Step 2 created your Regional data foundation, Step 3 helps you to visualize metrics across multiple AWS Regions from a single dashboard.
3.1: Set up sharing account (source account)
Before creating cross-account dashboards, you must configure your source account to share CloudWatch data with the monitoring account. This step creates an IAM role that grants read-only access to CloudWatch resources, enabling the monitoring account to query metrics and logs across account boundaries. Unlike the observability configuration in Step 2, which automatically replicates data, cross-account dashboards query data on-demand by assuming this role.
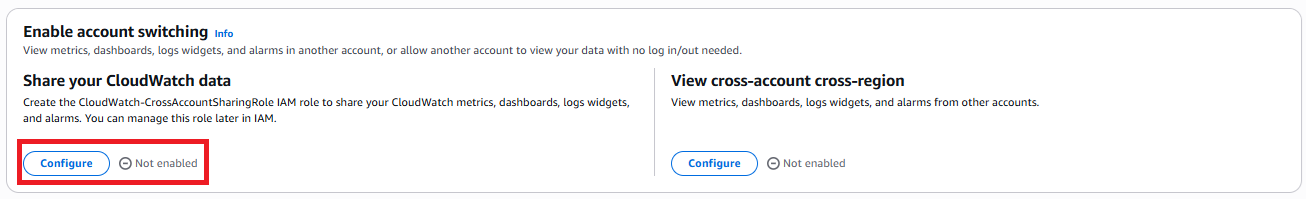
Switch to your source account, open the CloudWatch console, and go to Setup, then Settings. Under Share your CloudWatch data, choose Configure. For more information, see Enable cross-account cross-Region functionality.
For Sharing, choose Specific accounts and enter your monitoring account ID. For Permissions, select Full read-only access to CloudWatch resources in your account.
Review the IAM policy attached to the CloudWatch-CrossAccountSharingRole after creation to confirm that it aligns with your organization’s least-privilege requirements. You can restrict permissions to specific actions such as cloudwatch:GetMetricData, cloudwatch:DescribeAlarms, logs:DescribeLogGroups, and logs:FilterLogEvents after the stack is created.
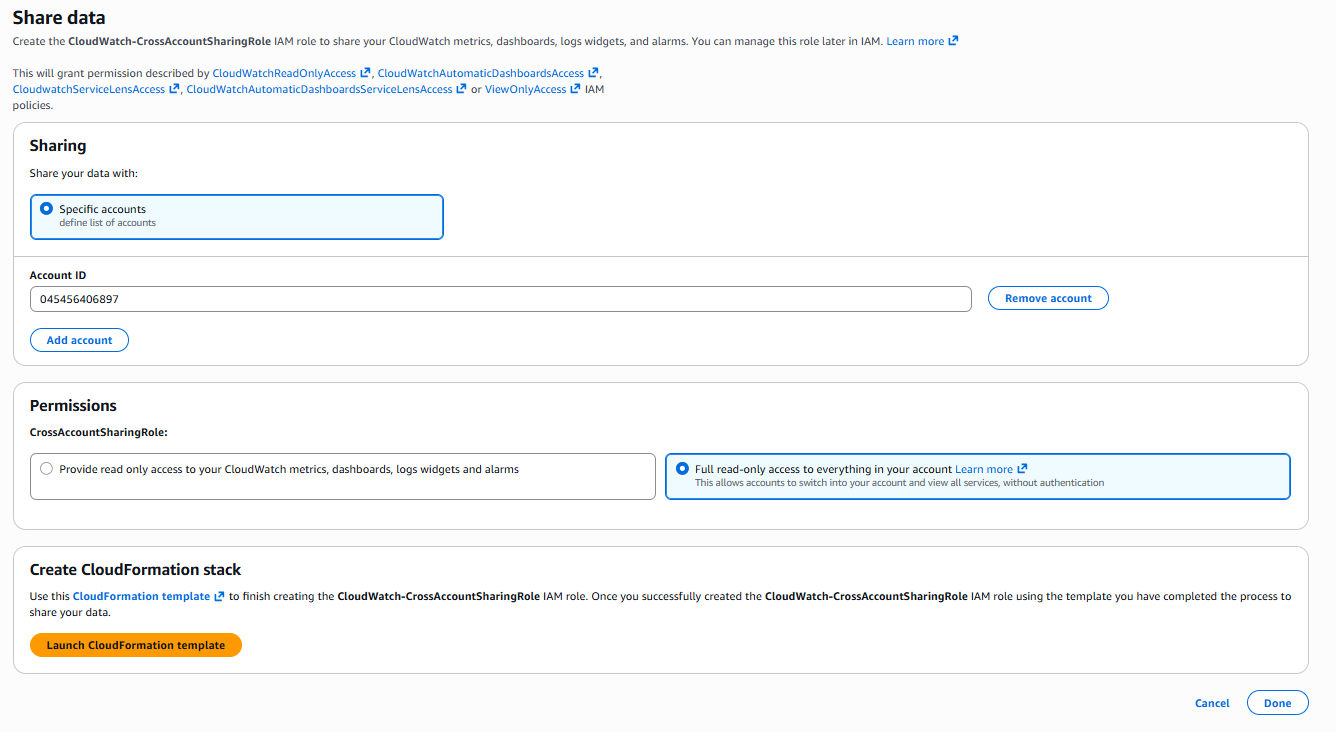
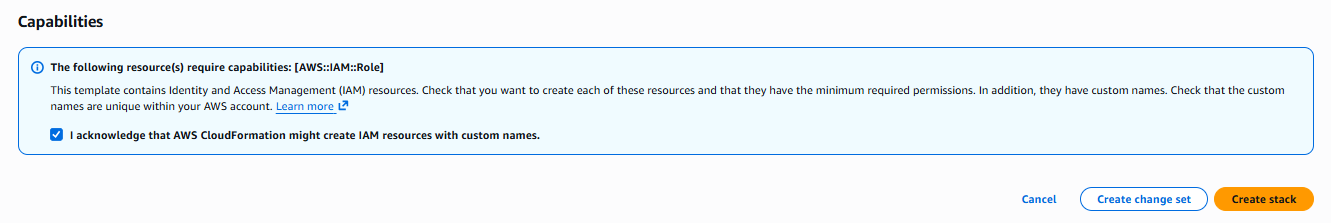
Choose Launch CloudFormation template. In the confirmation screen, enter Confirm and choose Launch template. Select the I acknowledge checkbox, then choose Create stack.
Navigate back to the previous screens and select Done. Repeat this process for other source accounts that you want to share data from.
CloudFormation creates an IAM role named CloudWatch-CrossAccountSharingRole that the monitoring account assumes to access CloudWatch data.
3.2: Enable cross-account console (monitoring account)
Return to your monitoring account and open the CloudWatch console. Go to Setup, then Settings. Under View cross-account cross-Region, choose Configure. In the View cross-account cross-Region section, choose Enable, then select Show selector in the console to display an account selector in the CloudWatch console.
Choose how to select accounts: manually input an account ID each time, automatically display accounts from your AWS Organization, or enter a custom list of account IDs in a dropdown. The AWS Organization account selector is the most suitable choice for accounts managed by an organization, because it automatically discovers the accounts you have access to.
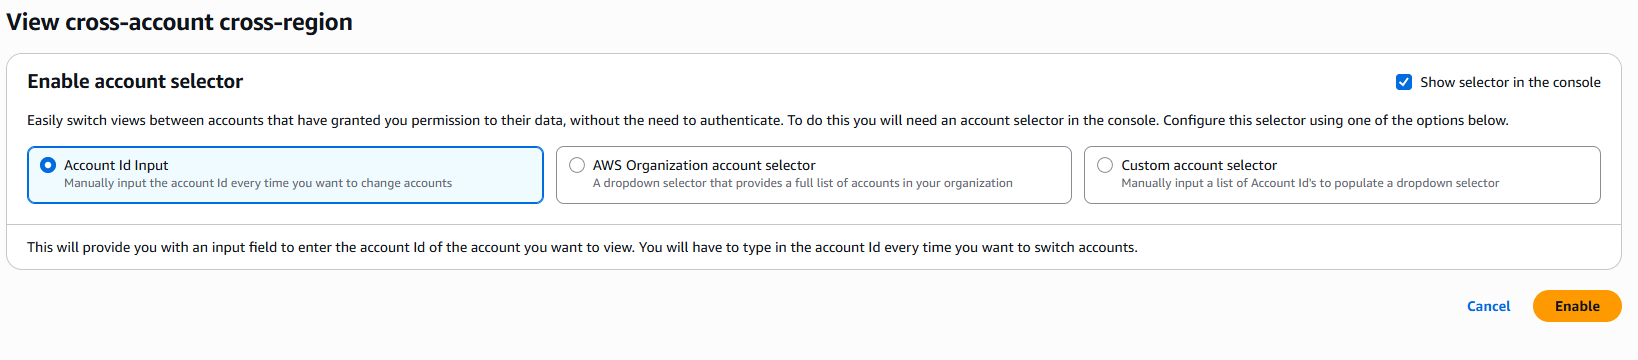
Choose Enable.
To confirm that the setting is enabled, open the CloudWatch console and go to Metrics, then select All Metrics. You will see an Account ID and Region selector, which you can use to monitor metrics and traces across multiple accounts and Regions from a single console without switching contexts.
3.3: Create cross-account cross-Region dashboard
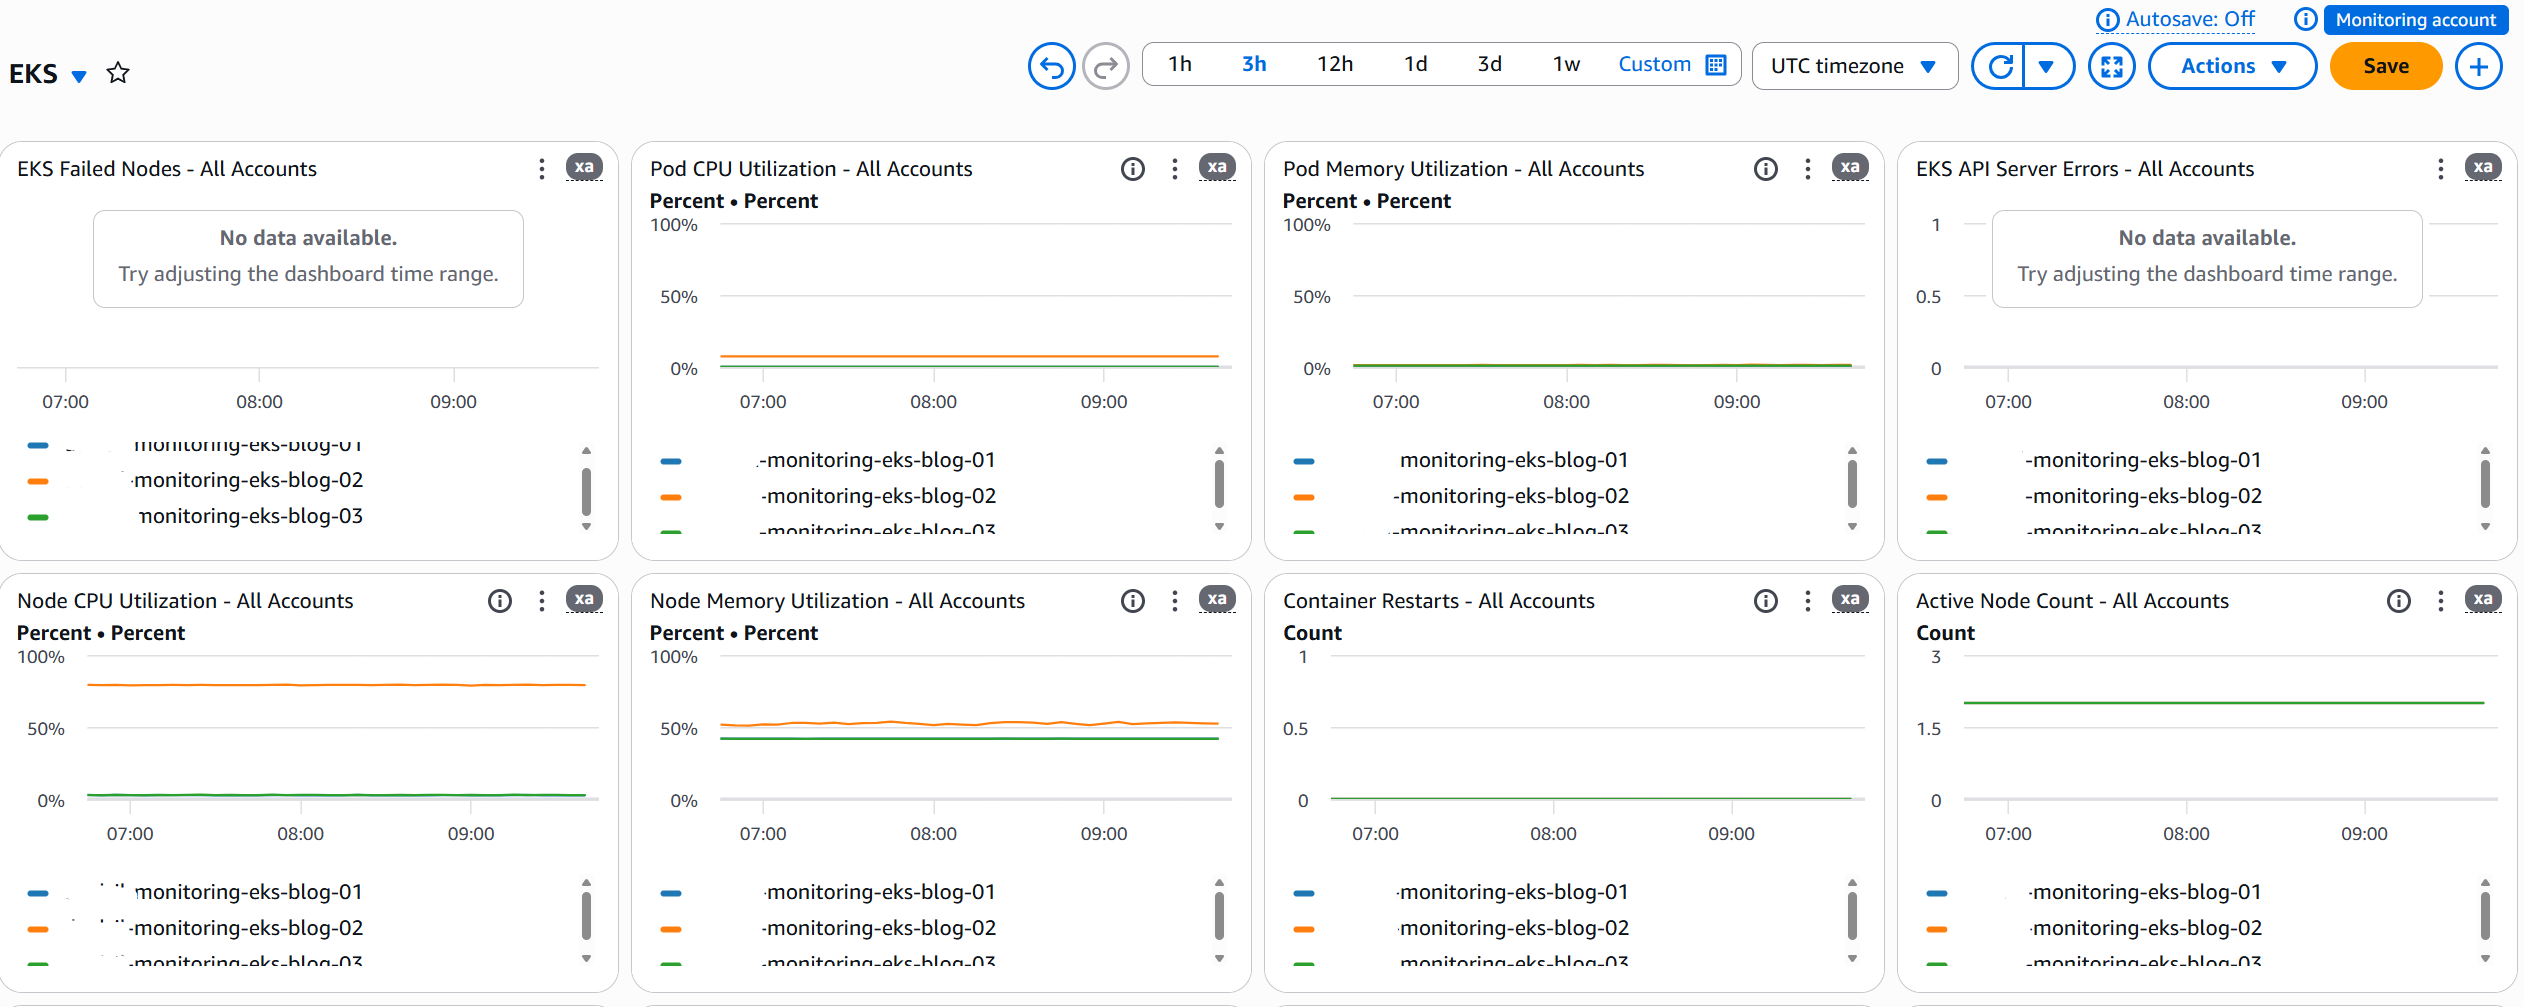
You will now create an operational dashboard that provides real-time visibility across your entire Amazon EKS infrastructure.
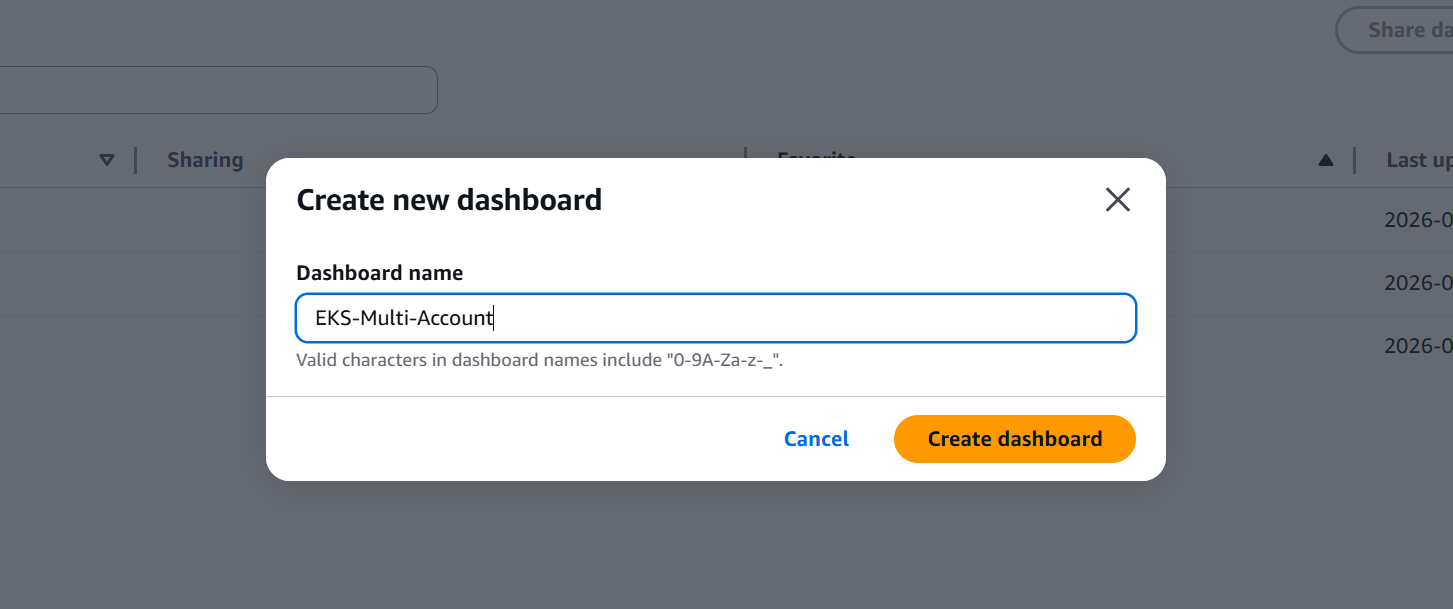
From your monitoring account, open the CloudWatch console and select Dashboards. Choose Create dashboard, enter the name EKS-Multi-Account, and choose Create dashboard again.
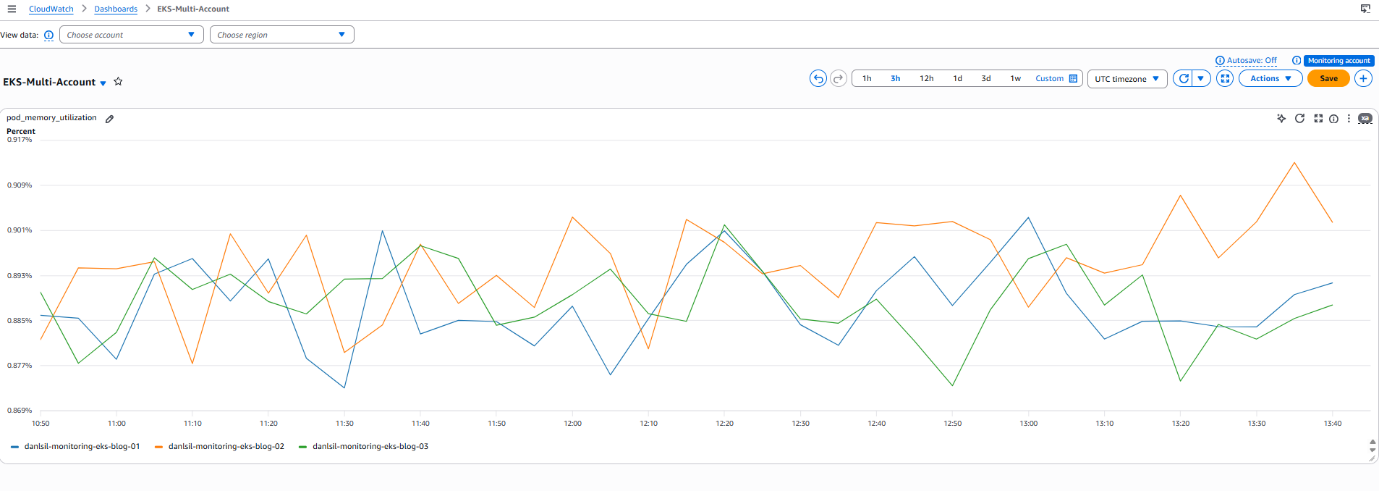
Select Line graph. Search for metrics by name and add them from multiple accounts. Use the account and Region selectors to switch between accounts and Regions as needed. In the following example, pod_memory_utilization metrics were added.
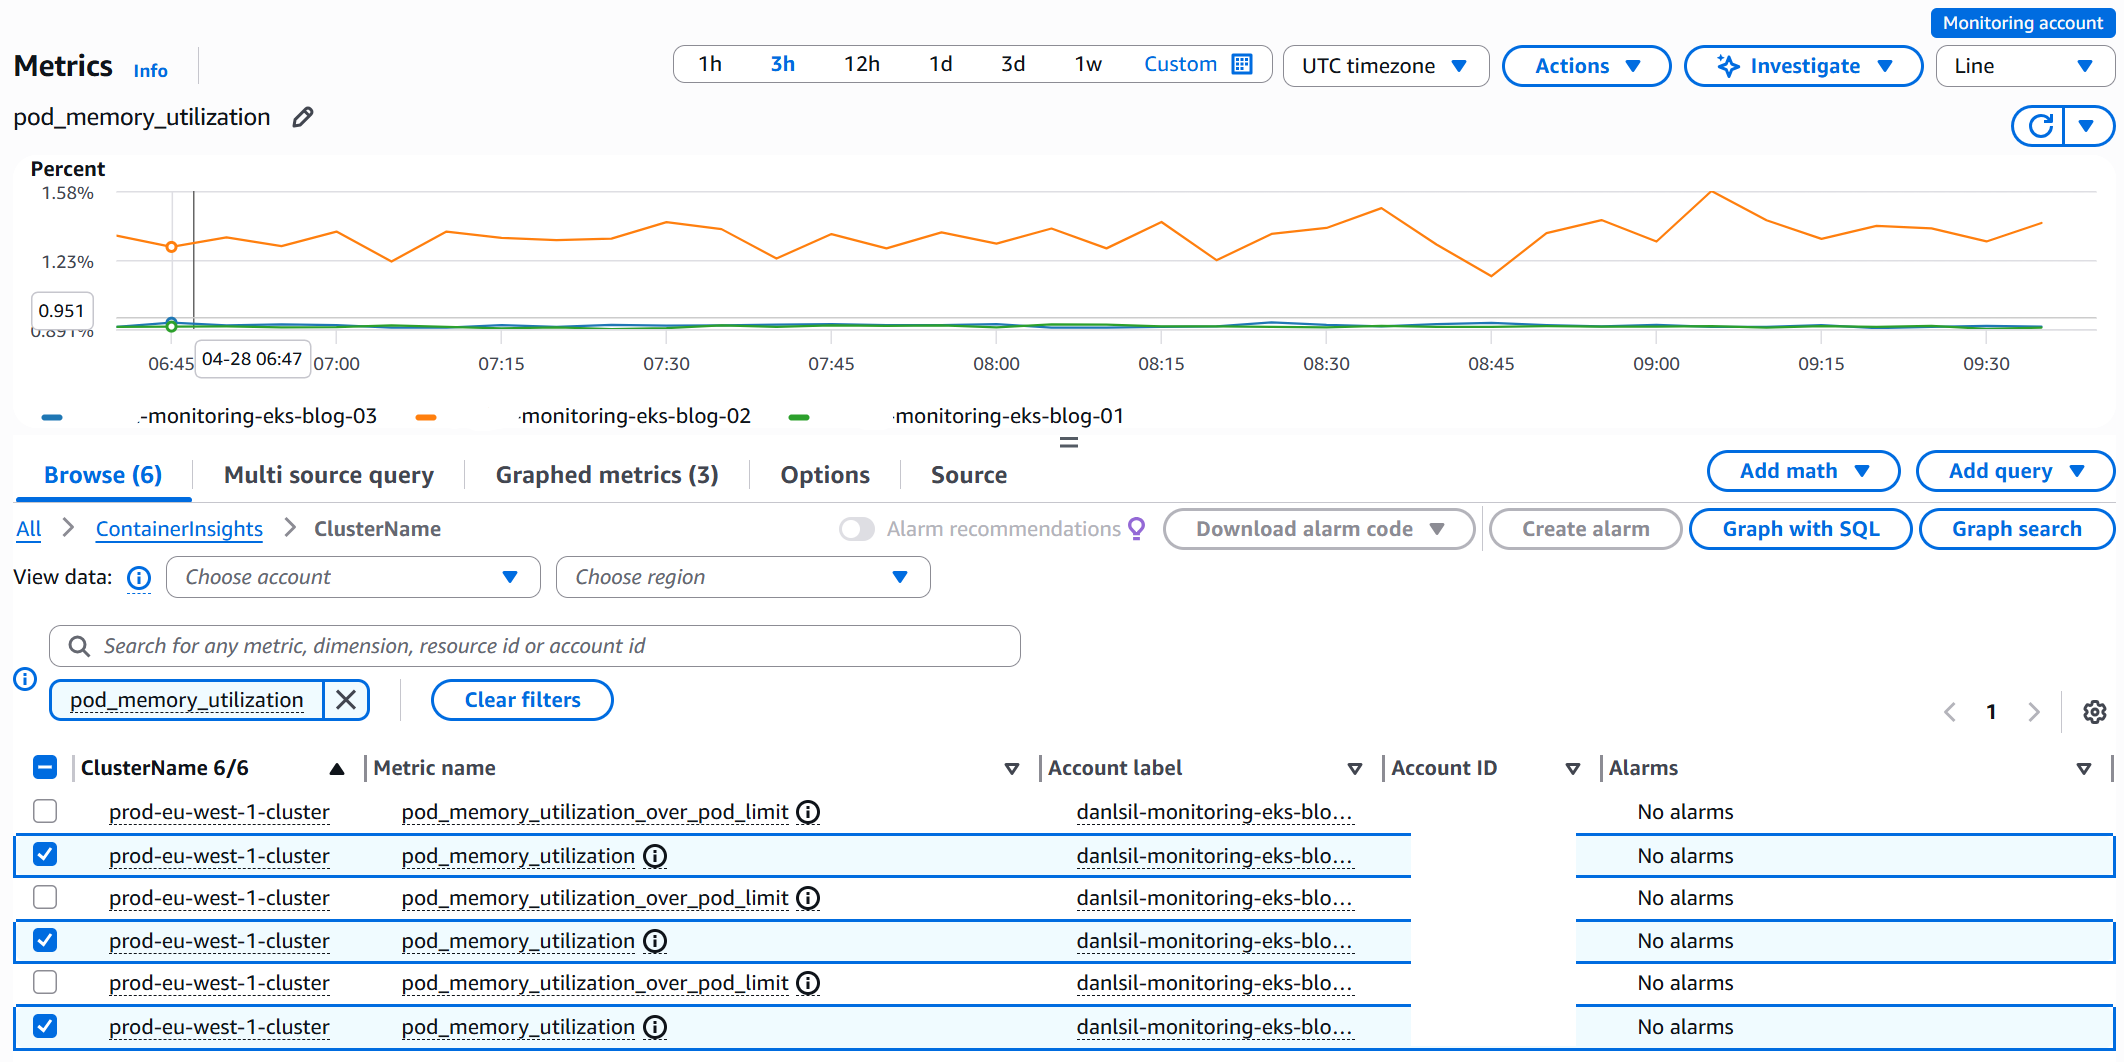
Select Create widget to add them to the dashboard, then choose Save to save the dashboard. Repeat this process to add more widgets.
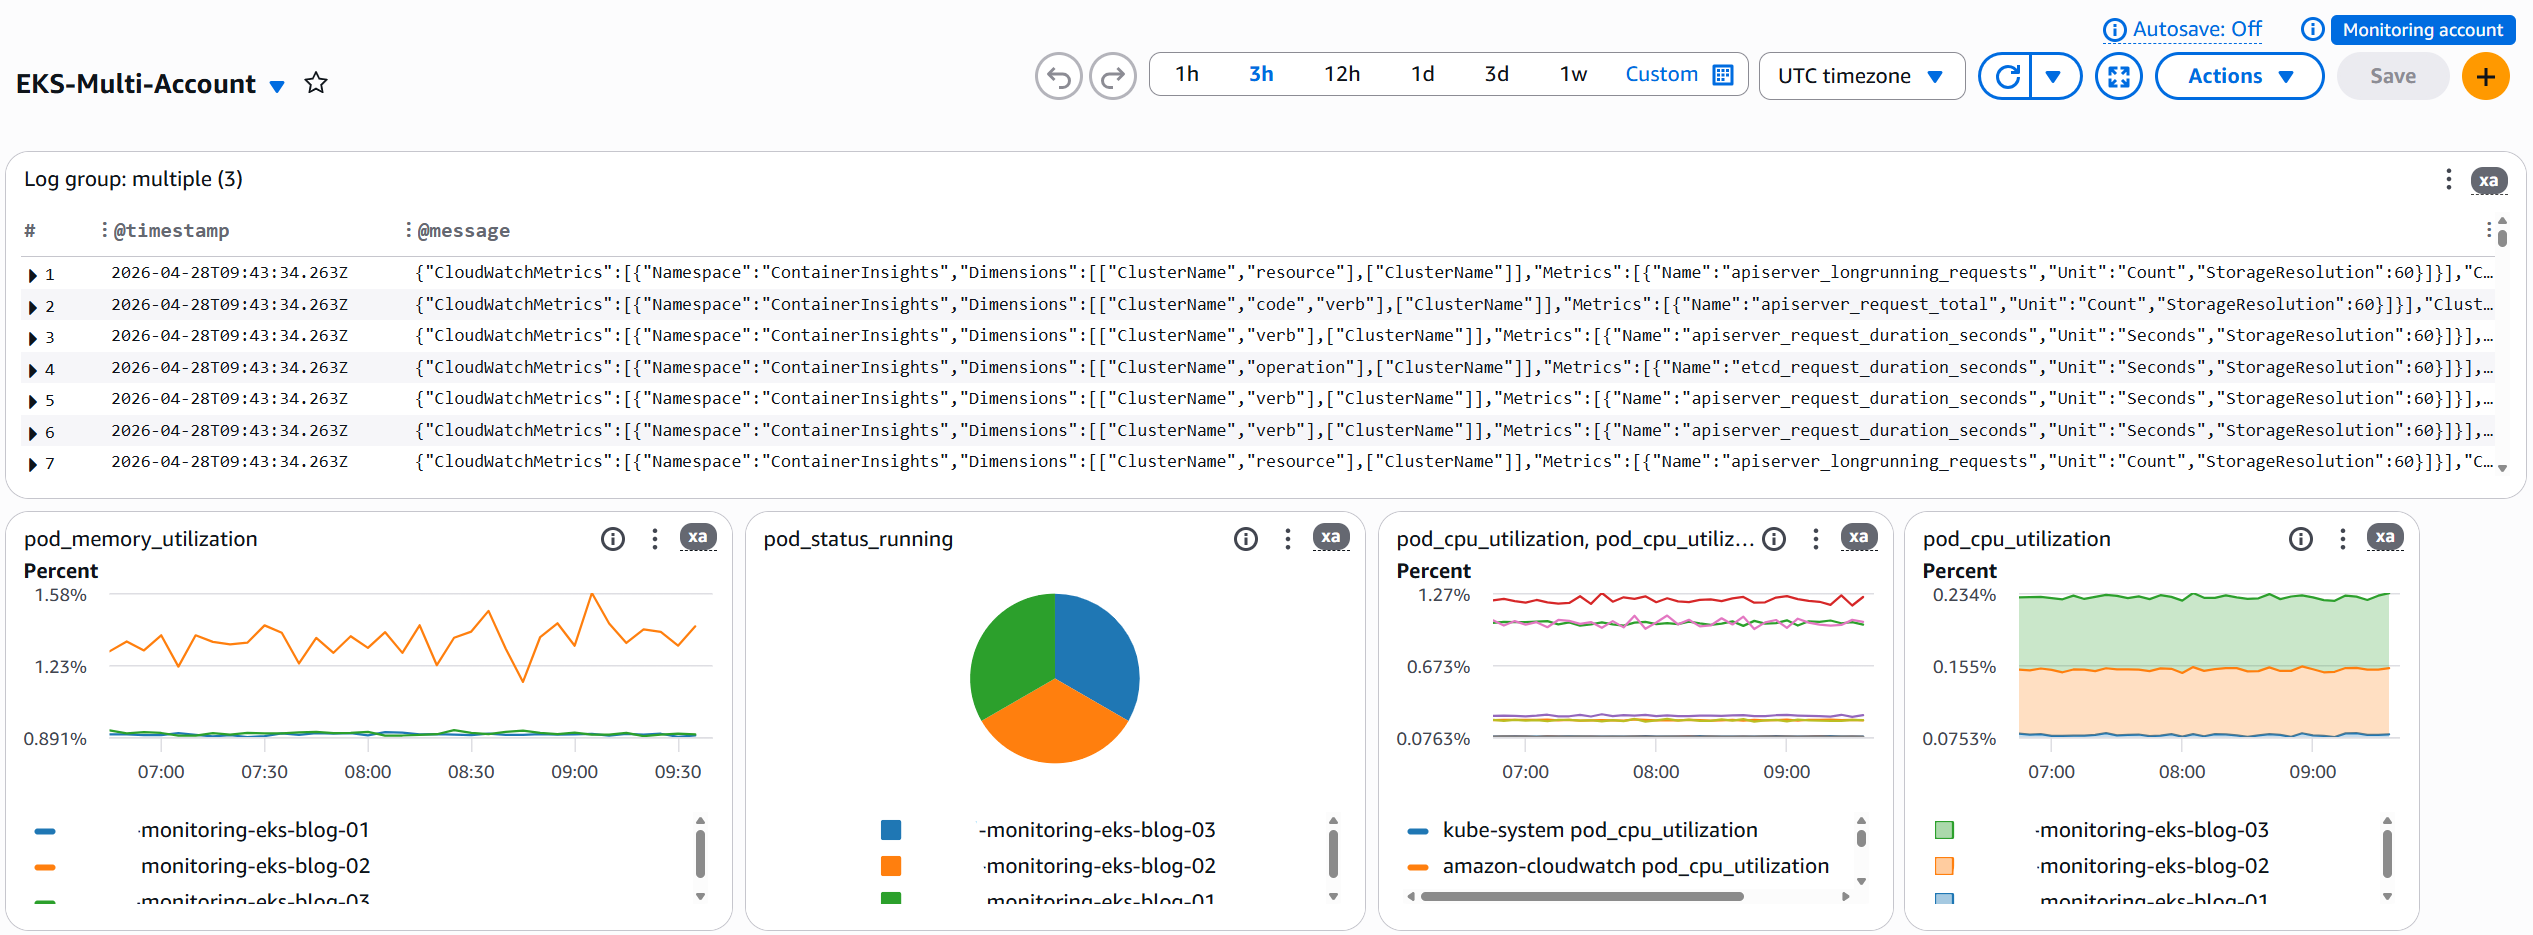
Multiple widget types can be added for Metrics, Logs, and CloudWatch Alarms that monitor your infrastructure.
To scale to additional accounts, add their account IDs to the widget metrics. For multi-Region setups, create separate sinks and dashboards per Region. For more information, see Creating a CloudWatch cross-account cross-Region dashboard.
Operational use cases
Incident response
During an incident, you must access multiple AWS accounts, switch between Regions, and correlate metrics and logs to identify root causes. With centralized observability through CloudWatch Cross-account cross-Region observability and cross-account cross-Region dashboards, your team gains unified visibility across your entire Amazon EKS fleet from a single console. From this consolidated view, you can see which clusters are experiencing elevated error rates across Regions and where pod CPU and memory usage is spiking. Log errors from affected clusters become straightforward to correlate, and you gain visibility into API server health across your entire fleet. This centralized approach can help reduce MTTR by reducing the need to context-switch between multiple consoles and manually piece together information from disparate sources.
Capacity planning
Tracking cluster capacity across multiple accounts and Regions requires coordination across your teams and accounts. The Amazon EKS Dashboard provides immediate visibility into critical capacity metrics across your organization. The dashboard immediately shows which clusters are approaching node capacity limits and which require version upgrades. You will also see extended support cost projections and the Amazon Machine Image (AMI) versions running across your managed node groups. This visibility helps you add capacity before issues occur, shifting from a reactive to a preventive operational model.
Cost considerations
One of the most compelling aspects of CloudWatch cross-account observability is its cost efficiency. You incur no additional charges for sharing metrics and logs across accounts, and the first trace copy is provided at no cost. Additional trace copies follow standard AWS X-Ray pricing. For more information about pricing, see Amazon CloudWatch pricing.
Similarly, the EKS Dashboard and cross-account cross-Region dashboards generate no additional charges apart from the standard cost of $3 per CloudWatch dashboard per month, pro-rated hourly. Any log widgets that are built using logs insights queries will charge for the query itself and every time the dashboard is opened or refreshed, a new logs query will be started adding to this cost. For example, consider an organization running 10 Amazon EKS clusters across three Regions in their source account. With Container Insights already enabled, existing costs remain unchanged. The additional cost for implementing cross-account observability and cross-account cross-Region console is effectively zero, because the solution uses telemetry that you’re already collecting. With effectively zero additional costs beyond existing monitoring, centralized observability is accessible regardless of the Region.
Understanding the limitations
While CloudWatch cross-account observability provides powerful capabilities, it’s important to understand its operational boundaries. The Amazon EKS Dashboard updates every 12 hours rather than in real-time, making it well-suited for capacity planning and auditing but less appropriate for real-time incident response. Cross-account observability supports up to 100,000 source accounts per monitoring account, and each source account can share telemetry with up to five monitoring accounts. When creating resources on cross account data like CloudWatch Alarms, the resource must be created in the same Region for which the telemetry resides.
Next steps
To scale this solution, automate onboarding using CloudFormation StackSets to create monitoring links in new accounts. Set up CloudWatch Alarms based on cross-account metrics for proactive issue detection. Create role-specific dashboards tailored to different stakeholders, giving operations teams detailed troubleshooting views while providing executives with high-level health metrics. This maintains consistent observability across your global Amazon EKS infrastructure while preserving security boundaries.
Conclusion
Unifying multi-account, multi-Region Amazon EKS monitoring addresses a critical operational challenge by reducing the time and effort required to monitor distributed infrastructure. The Amazon EKS Dashboard, CloudWatch cross-account observability, and cross-account cross-Region dashboards remove the operational overhead of fragmented monitoring while maintaining security boundaries and account isolation. The solution requires no changes to your existing monitoring infrastructure. It unifies what you already have into a centralized view. You gain a single pane of glass for incident response, and your capacity planning becomes proactive rather than reactive.
We encourage you to start implementing centralized observability in your AWS environment today. Begin by using your existing Container Insights and CloudWatch monitoring, then implement a hub-and-spoke architecture for centralized visibility. Use AWS Organizations to enable scalable account onboarding, create role-specific dashboards tailored to different stakeholders, and maintain security boundaries while enabling cross-account access. For personalized guidance on implementing this solution in your specific environment, contact your AWS Solutions Architect or visit the AWS Architecture Center.
To learn more about Amazon EKS observability and AWS monitoring best practices, explore the Amazon EKS User Guide, CloudWatch Cross-Account Observability Documentation, EKS Best Practices Guide, AWS Well-Architected EKS Lens, and the CloudWatch Dashboard Body Structure Reference.