Containers
Monitoring Amazon EKS on AWS Fargate using Prometheus and Grafana
At AWS, we are continually looking to improve customer experience by reducing complexity. Our customers want to spend more time solving business problems and less time maintaining infrastructure. Two years ago, we launched Amazon EKS to make it easy for you to operate Kubernetes clusters. And last year, at re:Invent 2019, we announced support for EKS on Fargate. This feature allows you to run Kubernetes pods without creating and managing EC2 instances.
Customers often ask, “Can I monitor my pods running on Fargate using Prometheus?”
Yes, you can use Prometheus to monitor pods running on Fargate. We’ll take a more in-depth look at how pods run on Fargate and where the relevant Prometheus metrics originate.
Running Kubernetes pods on Fargate
AWS Fargate is a serverless compute engine for containers that works with both Amazon Elastic Container Service (ECS) and Amazon Elastic Kubernetes Service (EKS). When you run your Kubernetes workload on Fargate, you don’t need to provision and manage servers. With Fargate, you can get the right amount of compute to run your containers. If you can run your containers on Fargate, you can avoid having to size EC2 instances for your workload. Fargate allows you to specify and only pay for resources your application needs. You need to know how much vCPU and memory your application pod needs, and Fargate will run it. And if you right-size your pods, then you can use tools like right-size-guide and Goldilocks vertical-pod-autoscaler. And scaling pods horizontally is also easier with Fargate; as the horizontal pod autoscaler creates new replicas, Fargate will create nodes for the new pods.
EKS allows you to choose where you obtain compute capacity from (EC2 or Fargate) on a per-pod basis. You can either run all the pods in a namespace on Fargate or specify a label for pods you want to run on Fargate. You can have a cluster where some pods run on EC2 while others run on Fargate.
You can declare which pods run on Fargate using the Fargate profile. Along with specifying which Kubernetes namespaces and labels should require Fargate capacity, you can also define from which subnets the pods will get their IP address.
As an additional benefit, pods on Fargate get their own VM-isolated environment, which means your pods do not share kernel, CPU, memory, and network interface with any other pods. Fargate runs Kubernetes processes like kubelet, kubeproxy, and containerd along with the pod. If you have five pods running on Fargate, and you run kubectl get nodes, you will see five worker nodes, one for each pod. If you run an EKS cluster that also runs kube-system pods also on Fargate, then you will also see nodes for CoreDNS as well.
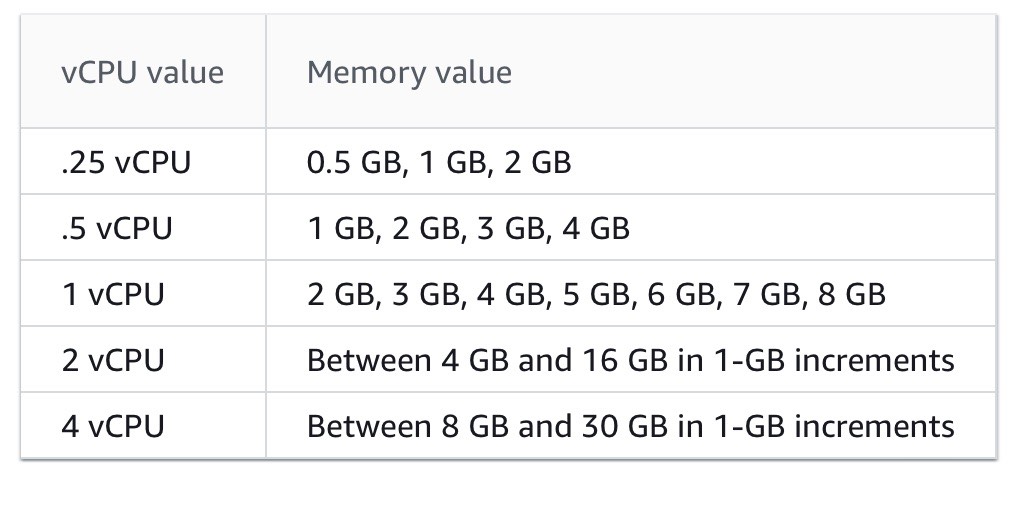
When pods are scheduled on Fargate, the vCPU and memory reservations within the pod specification determine how much vCPU and memory to provision for the pod.
- The maximum
requestsout of any Init containers is used to determine the Init request vCPU and memory requirements. requestsfor all long-running containers are added up to determine the long-running request vCPU and memory requirements.- The larger of the above two values is chosen for the vCPU and memory
requeststo use for your pod. - Fargate adds 256 MB to each pod’s memory reservation for the required Kubernetes components (
kubelet,kube-proxy, andcontainerd). - Fargate rounds up to the compute configuration that most closely matches the sum of vCPU and memory
requestsin order to ensure pods always have the resources that they need to run. - If you do not specify a vCPU and memory combination, then the smallest available combination is used (.25 vCPU and 0.5 GB memory).
Consider declaring vCPU and memory requests irrespective of whether you use Fargate or EC2. It will enable Kubernetes to ensure that at least the requested resources for each pod are available on the compute resource.
Monitoring CPU and memory usage percentage
Defining vCPU and memory requests for pods running on Fargate will also help you correctly monitor the CPU and memory usage percentage in Fargate. The formula used for the calculation of CPU and memory used percent varies by Grafana dashboard. For example, some Grafana dashboards calculate a pod’s memory used percent like this:
Pod's memory used percentage =
(memory used by all the containers in the pod/
 Total memory of the worker node) * 100
This formula will yield incorrect memory usage in Fargate since, as explained above, a pod’s resource usage is limited to the sum of vCPU and memory requests declared in its containers. In Fargate, a pod’s resource usage should not be calculated against Fargate node’s CPU and memory but against container’s defined requests like this:
Pod's memory used percentage =
(memory used by all the containers in the pod/
 Max(sum of memory requested by the containers in the pod,
    The highest value of requested memory by all init containers in the Pod )
    * 100
This formula will help you monitor pod’s compute resources and help you identify when your container’s resource requests should be adjusted. The values you declare in the resource requests will tell Fargate how much CPU and memory should be allocated to the pod. If you notice your pod’s memory and CPU usage is constantly nearing the values you’ve declared in the resource requests, then it may be time to review the requested resources.
Given the way Fargate allocates resources, a pod will get total memory requested in containers (individual Init containers or the sum of all the long-running containers, whichever is more) + 256 MB rounded to the next Fargate configuration (see the table below). For example, if you request 3.5 GB of memory, Fargate will allocate 4 GB memory: 3.5 GB + 250 MB rounded up. If you don’t declare any values for memory, then Fargate will allocate 0.5GB. The containers in your pod will be able to use all the available memory unless you specify a memory limit in your containers.
You can determine the size of the Fargate node that runs a pod by checking the pod’s annotations:
$ kubectl describe <pod>
...
Annotations:          CapacityProvisioned: 0.25vCPU 1GB
...
Having understood what to measure, let’s now explore how it can be measured.
Prometheus architecture
Prometheus is a time-series based, open source systems monitoring tool originally built at SoundCloud. Prometheus joined Cloud Native Computing Foundation in 2016 as the second hosted project, after Kubernetes.
Prometheus collects metrics via a pull model over HTTP. In Kubernetes, Prometheus can automatically discover targets using Kubernetes API, targets can be pods, daemon sets, nodes, etc. A typical Prometheus installation in Kubernetes includes these components:
- Prometheus server
- Node exporter
- Push gateway
- Alert manager
- kube-state-metrics
In Kubernetes, the Prometheus server runs as a pod that is responsible for scraping metrics from metrics endpoints.
Node exporter runs as a daemon set and is responsible for collecting metrics of the host it runs on. Most of these metrics are low-level operating system metrics like vCPU, memory, network, disk (of the host machine, not containers), and hardware statistics, etc. These metrics are inaccessible to Fargate customers since AWS is responsible for the health of the host machine.
To measure a pod’s performance on Fargate, we need metrics like vCPU, memory usage, and network transfers. Prometheus collects these metrics from two sources: cAdvisor and kube-state-metrics.
cAdvisor
cAdvisor (short for container advisor) analyzes and exposes resource usage and performance data from running containers on a node. In Kubernetes, cAdvisor runs as part of the Kubelet binary. You can use kubectl to view the metrics generated by cAdvisor:
kubectl get —raw /api/v1/nodes/[NAME-OF-A-NODE]/proxy/metrics/cadvisorcAdvisor provides node and pod usage statistics that are useful in understanding how a pod is using its resources. Here are the metrics it exposes:
cadvisor_version_info  -- A metric with a constant '1' value labeled by kernel version, OS version, docker version, cadvisor version & cadvisor revision.
container_cpu_load_average_10s  -- Value of container cpu load average over the last 10 seconds.
container_cpu_system_seconds_total  -- Cumulative system cpu time consumed in seconds.
container_cpu_usage_seconds_total  -- Cumulative cpu time consumed in seconds.
container_cpu_user_seconds_total  -- Cumulative user cpu time consumed in seconds.
container_fs_inodes_free  -- Number of available Inodes
container_fs_inodes_total  -- Number of Inodes
container_fs_io_current  -- Number of I/Os currently in progress
container_fs_io_time_seconds_total  -- Cumulative count of seconds spent doing I/Os
container_fs_io_time_weighted_seconds_total  -- Cumulative weighted I/O time in seconds
container_fs_limit_bytes  -- Number of bytes that can be consumed by the container on this filesystem.
container_fs_read_seconds_total  -- Cumulative count of seconds spent reading
container_fs_reads_bytes_total  -- Cumulative count of bytes read
container_fs_reads_merged_total  -- Cumulative count of reads merged
container_fs_reads_total  -- Cumulative count of reads completed
container_fs_sector_reads_total  -- Cumulative count of sector reads completed
container_fs_sector_writes_total  -- Cumulative count of sector writes completed
container_fs_usage_bytes  -- Number of bytes that are consumed by the container on this filesystem.
container_fs_write_seconds_total  -- Cumulative count of seconds spent writing
container_fs_writes_bytes_total  -- Cumulative count of bytes written
container_fs_writes_merged_total  -- Cumulative count of writes merged
container_fs_writes_total  -- Cumulative count of writes completed
container_last_seen  -- Last time a container was seen by the exporter
container_memory_cache  -- Number of bytes of page cache memory.
container_memory_failcnt  -- Number of memory usage hits limits
container_memory_failures_total  -- Cumulative count of memory allocation failures.
container_memory_mapped_file  -- Size of memory mapped files in bytes.
container_memory_max_usage_bytes  -- Maximum memory usage recorded in bytes
container_memory_rss  -- Size of RSS in bytes.
container_memory_swap  -- Container swap usage in bytes.
container_memory_usage_bytes  -- Current memory usage in bytes, including all memory regardless of when it was accessed
container_memory_working_set_bytes  -- Current working set in bytes.
container_network_receive_bytes_total  -- Cumulative count of bytes received
container_network_receive_errors_total  -- Cumulative count of errors encountered while receiving
container_network_receive_packets_dropped_total  -- Cumulative count of packets dropped while receiving
container_network_receive_packets_total  -- Cumulative count of packets received
container_network_transmit_bytes_total  -- Cumulative count of bytes transmitted
container_network_transmit_errors_total  -- Cumulative count of errors encountered while transmitting
container_network_transmit_packets_dropped_total  -- Cumulative count of packets dropped while transmitting
container_network_transmit_packets_total  -- Cumulative count of packets transmitted
container_scrape_error  -- 1 if there was an error while getting container metrics, 0 otherwise
container_spec_cpu_period  -- CPU period of the container.
container_spec_cpu_shares  -- CPU share of the container.
container_spec_memory_limit_bytes  -- Memory limit for the container.
container_spec_memory_reservation_limit_bytes  -- Memory reservation limit for the container.
container_spec_memory_swap_limit_bytes  -- Memory swap limit for the container.
container_start_time_seconds  -- Start time of the container since unix epoch in seconds.
container_tasks_state  -- Number of tasks in given state
machine_cpu_cores  -- Number of CPU cores on the machine.
machine_memory_bytes  -- Amount of memory installed on the machine.
cAdvisor also exposes the total CPU and memory of the node. For example, I scheduled a pod on Fargate and requested 200m vCPU.
kubectl get --raw /api/v1/nodes/fargate-ip-192-168-102-240.us-east-2.compute.internal/proxy/metrics/cadvisor
...
machine_cpu_cores 2
machine_memory_bytes 4.134506496e+09
As reflected in the metrics, the Fargate node that runs my pod has 2 vCPUs and 4GiB RAM. This can be a bit confusing.
Even though the node has 2vCPUs and 4GiB RAM, my pod is limited to 200m (or 0.25 vCPU, 0.5GiB RAM if no requests are configured). I am being billed for the resources that the pod uses and not for the rest of the unused capacity on the Fargate node.
Once Fargate uses Firecracker microVMs, the compute resources of the microVM will closely match the requirements of the pod running on Fargate. Until then, you should expect to see unused capacity on your Fargate nodes even though you are not responsible for its cost.
Most Grafana dashboards intended for pod monitoring use the following metrics generated by cAdvisor:
- container_cpu_usage_seconds_total
- container_memory_usage_bytes
- container_network_*_bytes_total
While some Grafana dashboards for monitoring pod usage are based on cAdvisor metrics only, others combine metrics from other sources like kube-state-metrics.
Not all cAdvisor metrics are populated in Fargate-backed nodes. For example, the container_cpu_load_average_10s metric is not populated in Fargate-backed nodes because it requires the --enable_load_reader flag, which is not enabled on Fargate. Here are the metrics that are unavailable in Fargate:
- container_cpu_load_average_10s
- container_fs_io_current
- container_fs_io_time_seconds_total
- container_fs_io_time_weighted_seconds_total
- container_memory_failcnt
- container_memory_swap (because there’s no swap in Fargate)
- container_spec_memory_reservation_limit_bytes
- container_spec_memory_swap_limit_bytes
- container_start_time_seconds
kube-state-metrics
kube-state-metrics is an open source project that is responsible for listening to the Kubernetes API server and generating metrics. It creates a Kubernetes service and exposes metrics in Prometheus text format. It collects metrics for the following resources:
- nodes
- pods
- replicationcontrollers
- services
- endpoints
- namespaces
- limitranges
- resourcequotas
- persistentvolumes
- persistentvolumeclaims
- configmaps
- secrets
It creates a service that listens on port 8080, and you can use kubectl to see all the metrics it exposes.
kubectl get --raw /api/v1/namespaces/prometheus/services/prometheus-kube-state-metrics:8080/proxy/metricsPod monitoring Grafana dashboards generally use kube-state-metrics to determine pod’s compute resource requests and limits. Here are some relevant metrics:
- kube_pod_container_resource_requests — The number of requested request resource by a container.
- kube_pod_container_resource_requests_cpu_cores — The number of requested cpu cores by a container.
- kube_pod_container_resource_limits_cpu_cores — The limit on cpu cores to be used by a container. CPU limits are ignored in Fargate.
- kube_pod_container_resource_requests_memory_bytes — The number of requested memory bytes by a container.
- kube_pod_container_resource_limits_memory_bytes — The limit on memory to be used by a container in bytes. Memory limits are ignored in Fargate.
Prometheus gives us the complete picture by combining data collected from cAdvisor and kube-state-metrics. Let’s review some helpful Grafana dashboards for monitoring pods running on Fargate.
Tutorial
The tutorial walks you through setting up Prometheus and Grafana. If you already use Prometheus and Grafana you can skip the tutorial.
We will create an EKS cluster and install Prometheus and Grafana. Prometheus includes a local time series database to store metrics chronologically. It’s a best practice to use persistent volumes with Prometheus so its data is not lost during container restarts. In EKS, you can create persistent volumes that are backed by Amazon EBS, Amazon EFS, or Amazon FSx for Lustre. Prometheus currently doesn’t support NFS file systems, hence we cannot use EFS-backed persistent volumes and must to rely on EBS volumes to provide persistence for Prometheus.
Fargate supports stateful workloads through its integration with EFS. Since Prometheus requires EBS volumes, our Kubernetes cluster will need an EC2 node group to run Prometheus with an EBS persistent volume. In the cluster we create during this tutorial, all pods in the prometheus and kube-system namespace will run on EC2. Pods in the default namespace will run on Fargate.
Before we can schedule pods on Fargate, we must define a Fargate profile which specifies what pods should use Fargate as they are launched.
The Fargate profile allows an administrator to declare which pods run on Fargate. This declaration is done through the profile’s selectors. Each profile can have up to five selectors that contain a namespace and optional labels. You must define a namespace for every selector. The label field consists of multiple optional key-value pairs. Pods that match a selector (by matching a namespace for the selector and all of the labels specified in the selector) are scheduled on Fargate. If a namespace selector is defined without any labels, Amazon EKS will attempt to schedule all pods that run in that namespace onto Fargate using the profile. If a to-be-scheduled pod matches any of the selectors in the Fargate profile, then that pod is scheduled on Fargate.
You can create a Fargate profile using eksctl for your existing EKS cluster. In this tutorial, we will use eksctl to create a new EKS cluster with a Fargate profile. All pods in the default namespace will run on Fargate.
Architecture

Build the cluster:
If you don’t have an EKS cluster, you can use eksctl to create one. You can use this template to create a cluster that schedules all pods in the default namespace on Fargate:
cat > cluster.yaml <<EOF
apiVersion: eksctl.io/v1alpha5
kind: ClusterConfig

metadata:
  name: fargate-prometheus
  region: us-west-2

nodeGroups:
  - name: node-group-1
    instanceType: m5.large
    desiredCapacity: 2
    iam:
      withAddonPolicies:
        autoScaler: true
        ebs: true

fargateProfiles:
  - name: fp-default
    selectors:
      - namespace: default
EOF

eksctl create cluster -f cluster.yaml
Add Helm repositories
We will use Helm to install the components required to run Prometheus. If you don’t have Helm installed, please see Using Helm with Amazon EKS. Add these repositories:
helm repo add aws-ebs-csi-driver https://kubernetes-sigs.github.io/aws-ebs-csi-driver
helm repo add kube-state-metrics https://kubernetes.github.io/kube-state-metrics
helm repo add prometheus-community https://prometheus-community.github.io/helm-charts
helm repo add grafana https://grafana.github.io/helm-charts
helm repo update
Install Prometheus
Before we can install Prometheus, we need to install the EBS CSI driver, which allows Kubernetes applications to use EBS volumes for stateful workloads. Install the EBS CSI driver Helm chart:
helm upgrade --install aws-ebs-csi-driver \
    --namespace kube-system \
    --set enableVolumeScheduling=true \
    --set enableVolumeResizing=true \
    --set enableVolumeSnapshot=true \
    aws-ebs-csi-driver/aws-ebs-csi-driver
Create a namespace for Prometheus:
kubectl create namespace prometheusPrometheus needs two EBS-backed persistent volumes: one for prometheus-server and another for prometheus-alertmanager. Because EBS volumes are accessible within a single Availability Zone (AZ), we must determine the AZs in which our cluster’s worker nodes exist. We will configure the storage class to create EBS volumes in the same AZ as the node.
Get the Availability Zone of one of the worker nodes:
EBS_AZ=$(kubectl get nodes \
  -o=jsonpath="{.items[0].metadata.labels['topology\.kubernetes\.io\/zone']}")
Create a storage class:
echo "
kind: StorageClass
apiVersion: storage.k8s.io/v1
metadata:
  name: prometheus
  namespace: prometheus
provisioner: ebs.csi.aws.com
parameters:
  type: gp2
reclaimPolicy: Retain
allowedTopologies:
- matchLabelExpressions:
  - key: topology.ebs.csi.aws.com/zone
    values:
    - $EBS_AZ
" | kubectl apply -f -
Download the Helm values for Grafana file:
wget https://github.com/aws-samples/containers-blog-maelstrom/raw/main/fargate-monitoring/prometheus_values.ymlInstall Prometheus:
helm install prometheus -f prometheus_values.yml \
  prometheus-community/prometheus --namespace prometheus
Verify that Prometheus pods are running:
kubectl get pods --namespace prometheusThe output should look like this:
$ kubectl get pods --namespace prometheus
NAME                                             READY   STATUS    RESTARTS   AGE
prometheus-alertmanager-74d848d9ff-l44hf         2/2     Running   0          4m
prometheus-kube-state-metrics-6df5d44568-hkxkz   1/1     Running   0          4m
prometheus-node-exporter-8gxfs                   1/1     Running   0          4m
prometheus-node-exporter-k7hkd                   1/1     Running   0          4m
prometheus-pushgateway-86785d4c65-xcrdk          1/1     Running   0          4m
prometheus-server-54856869c8-zhhdr               2/2     Running   0          4m
The chart creates two persistent volume claims: an 8Gi volume for prometheus-server pod and a 2Gi volume for prometheus-alertmanager.
The Helm chart also creates these Kubernetes services:
$ kubectl get service --namespace prometheus
NAME                            TYPE        CLUSTER-IP       EXTERNAL-IP   PORT(S)        AGE
prometheus-alertmanager         ClusterIP   10.100.43.57     <none>        80/TCP         4m50s
prometheus-kube-state-metrics   ClusterIP   10.100.187.129   <none>        8080/TCP       4m50s
prometheus-node-exporter        ClusterIP   None             <none>        9100/TCP       4m50s
prometheus-pushgateway          ClusterIP   10.100.57.57     <none>        9091/TCP       4m50s
prometheus-server               NodePort    10.100.57.26     <none>        80:30900/TCP   4m50s
The prometheus-server service provides Prometheus’ API and user interface. This is the service that Grafana will use to fetch Prometheus metrics.
Install Grafana
Download the values file for the Grafana Helm chart:
wget https://raw.githubusercontent.com/aws-samples/containers-blog-maelstrom/main/fargate-monitoring/grafana-values.yamlInstall Grafana:
helm install grafana -f grafana-values.yaml \
  grafana/grafana --namespace prometheus
The chart creates a 5Gi persistent volume for Grafana and a LoadBalancer service for the UI. Get the load balancer’s DNS name:
printf $(kubectl get service grafana \
  --namespace prometheus \
  -o jsonpath="{.status.loadBalancer.ingress[].hostname}");echo
Open Grafana UI in your browser:
Login to using username admin. You can use kubectl to retrieve the password stored as a Kubernetes secret:
kubectl get secret --namespace prometheus grafana \
 -o jsonpath="{.data.admin-password}" | \
 base64 --decode ; echo
Install sample dashboard 7249.
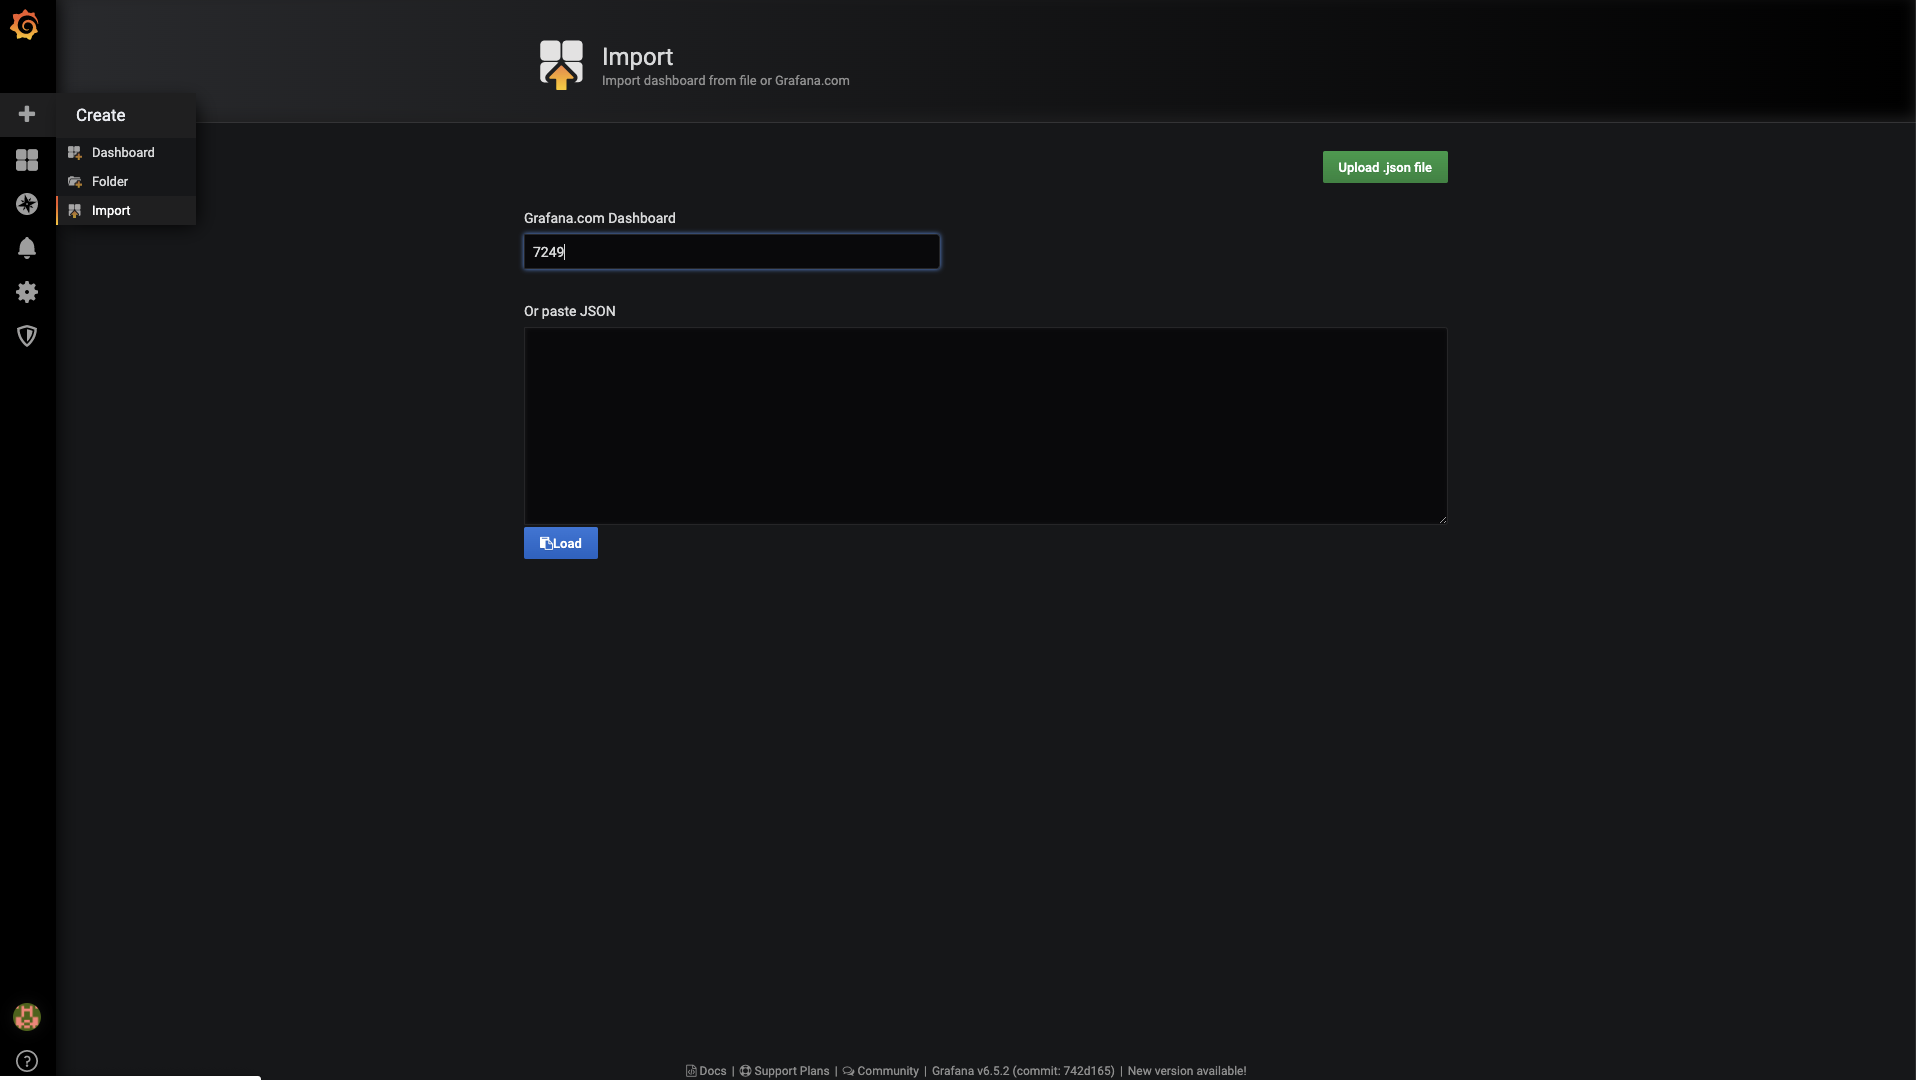

This dashboard gives a cluster level overview of the workloads deployed based on Prometheus metrics.

If you already have pods running on Fargate, you will see them in the dashboard. If you don’t have any existing workloads, you can deploy a sample application:
kubectl apply -f https://github.com/aws-samples/containers-blog-maelstrom/raw/main/fargate-monitoring/sampleapp.yamlThe result should be this:
ng/sampleapp.yaml
service/appf created
deployment.apps/appf created
ingress.extensions/appf created
horizontalpodautoscaler.autoscaling/appf created

$ kubectl get pods
NAME READY STATUS RESTARTS AGE
appf-5cc9c4655-gfm8r 0/1 Pending 0 7s
appf-5cc9c4655-nk97x 0/1 Pending 0 7s
appf-5cc9c4655-vtwpn 0/1 Pending 0 7s
With this setup, we can monitor pod memory usage as shown.

Similarly, we can calculate the CPU usage as shown below.

We have created Grafana Dashboard 12421 to track CPU and memory usage against requests.
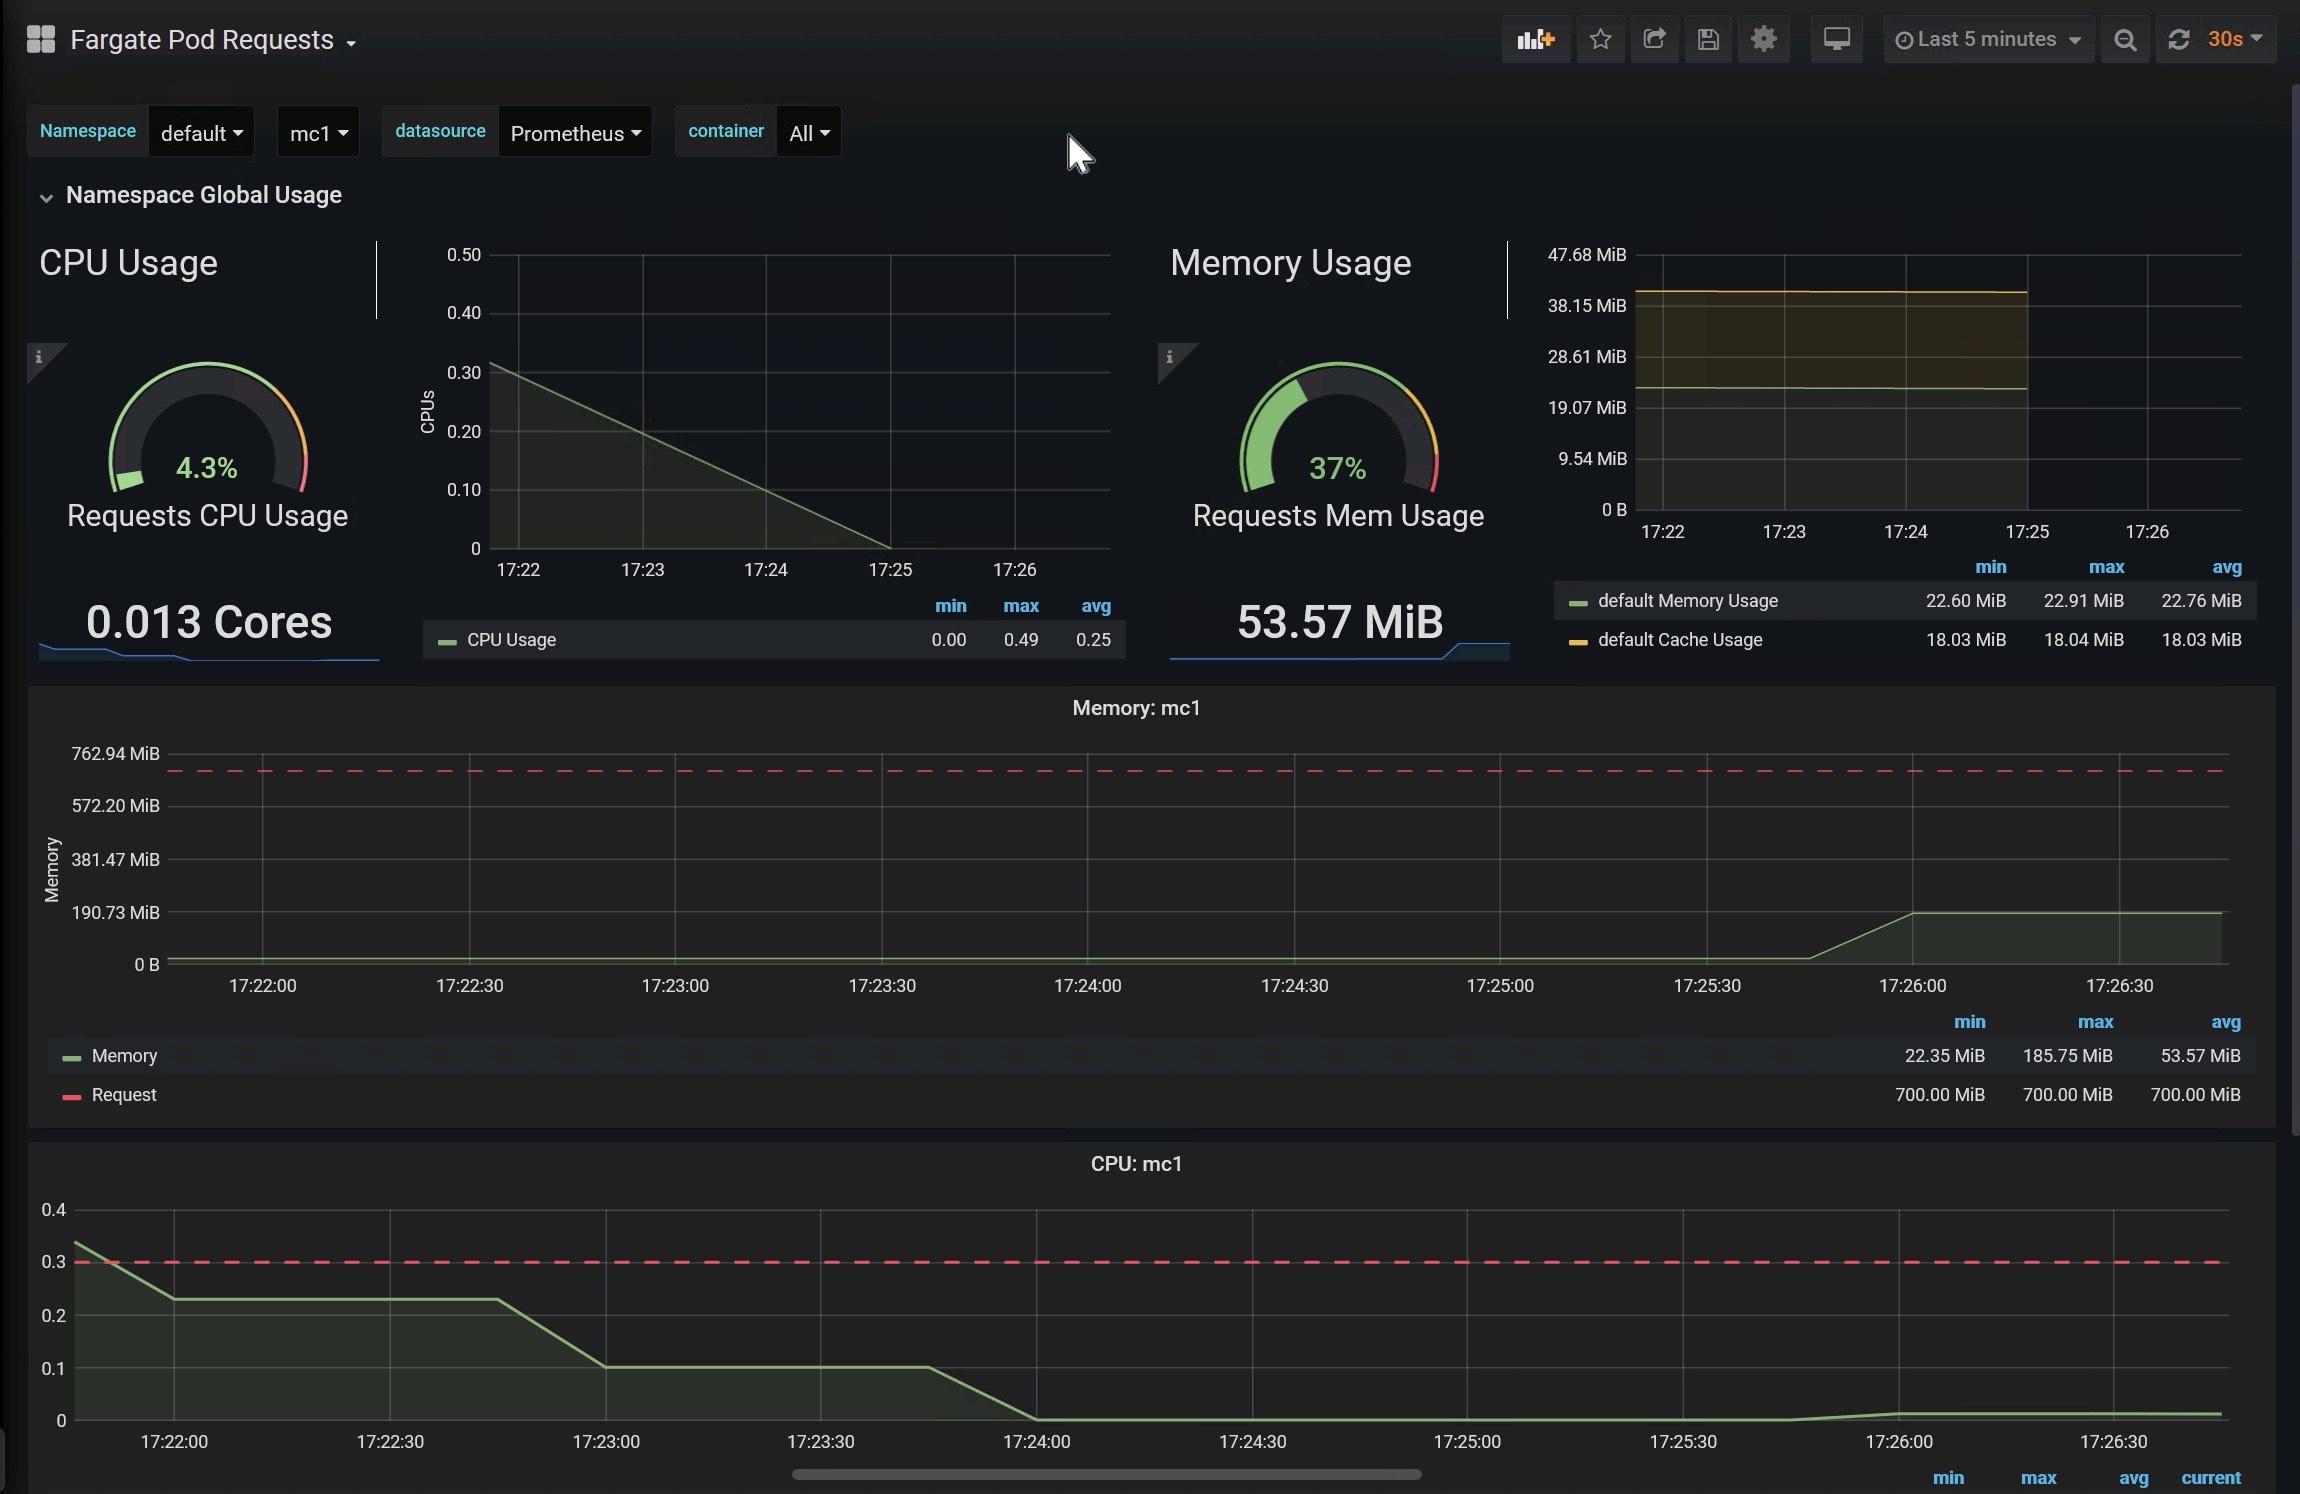
The formula it uses for calculating CPU usage is:
sum(rate(container_cpu_usage_seconds_total[5m]))
/ sum(kube_pod_container_resource_requests{resouce="cpu"}) * 100
The formula for calculating memory usage is:
sum(container_memory_working_set_bytes)
/ sum(kube_pod_container_resource_requests{resource="memory"}+262144000) * 100
The syntax has been modified for legibility.
The current version of the dashboard doesn’t consider initContainers’ requests. This is because kube-state-metrics doesn’t expose resources requested by initContainers.
The requests metric in the graph will be absent if none of the long-running containers request any resources. The request metric should not be confused with the total CPU and memory the pod has at its disposal. The pod’s CPU and memory is determined by the calculated Fargate configuration of the pod, as explained above.
Here are some common metrics used in pod monitoring dashboard and the source of the metric:
- kube_pod_info [kube-state-metrics]
- kube_pod_status_phase [kube-state-metrics]
- kube_pod_container_status_restarts_total [kube-state
- metrics]
- CPU
- container_cpu_usage_seconds_total [cAdvisor]
- kube_pod_container_resource_requests_cpu_cores [kube-state-metrics]
- Memory
- container_memory_working_set_bytes [cAdvisor]
- kube_pod_container_resource_requests_memory_bytes [kube-state-metrics]
- kube_pod_container_resource_limits_memory_bytes [kube-state-metrics]
- Network
- container_network_transmit_bytes_total [cAdvisor]
- container_network_receive_bytes_total [cAdvisor]
Conclusion
As demonstrated, the inability to run node-exporter as a DaemonSet in Fargate doesn’t impede the ability to monitor Kubernetes workloads running on Fargate. Metrics provided by cAdvisor and kube-state-metrics are sufficient for monitoring pods on Fargate.
With Fargate, it’s important to implement requests in your containers. Otherwise, you will get the Fargate default configuration profile, and you wouldn’t be able to measure the performance of your applications correctly.
You may also like Michael Fischer’s Grafana dashboard to monitor EKS control plane performance.
Further reading
Using Prometheus Metrics in Amazon CloudWatch
EKS Workshop — Deploy Prometheus and Grafana tutorial