Containers
Monitoring network performance on Amazon EKS using AWS Managed Open-Source Services
As organizations scale their microservices architectures on Amazon Elastic Kubernetes Service (Amazon EKS), platform and development teams face mounting challenges in monitoring network performance across distributed workloads. While VPC Flow Logs provide visibility into IP traffic, they lack the Kubernetes context needed to correlate network flows to specific pods, services, and namespaces. This makes it difficult to diagnose connectivity issues, identify packet drops, or investigate security incidents. Platform teams struggle to answer critical questions such as: “Which services are communicating with each other? Where are the latency bottlenecks? Are there any security policy violations?” Without Kubernetes-enriched network telemetry integrated into their observability and Security information and event management (SIEM) systems, teams spend excessive time troubleshooting network-related issues and lack the real-time visibility needed to ensure optimal performance and security across their EKS environments.
In this post, we will discuss how to monitor the network performance of your workloads running in Amazon EKS clusters using new advanced network observability features which are a part of Container Network Observability in EKS. This includes capturing network performance metrics and exporting them to AWS Managed Open-Source services such as Amazon Managed Service for Prometheus, Amazon Managed Grafana, etc. You can leverage the same approach to integrate with third-party observability solutions such as Datadog, New Relic, etc., or self-managed open-source tools like Prometheus.
Amazon EKS introduced new advanced network observability features that give you the ability to dynamically visualize and quickly understand the landscape, performance and security of the network environment of your Kubernetes clusters. At a cluster level, it provides you with a Service Map that depicts end-to-end visibility of network traffic flows for workloads in the cluster (east ↔ west traffic). Alongside this, you can access Network Flow Analysis which provide more granular information around application network activity and the network security posture for your workloads. Additionally, you can export Kubernetes-enriched network performance metrics from all your EKS clusters to be analyzed in your preferred monitoring solution or SIEM. Network monitoring in EKS is powered by Network Flow Monitor. To enable network monitoring in EKS, visit the get started guide.
Architecture diagram
Network Flow Monitor provides both system and flow level network performance metrics. System level metrics include ingress and egress packet count / flow count / bytes, and bandwidth, PPS allowance exceeded metrics. For a complete list of metrics, refer to Amazon EKS documentation. The Network Flow Monitor addon runs a daemon pod on every node and enriches the system level metrics with Kubernetes pod metadata and makes them available in open metrics format, so that you can use any compatible agent to scrape these metrics and export to your observability platform.
In addition, Network Flow Monitor captures network flow data along with flow level metrics: retransmissions – RT, retransmission timeouts – RTO, and data transferred (in bytes). This data is processed by Network Flow Monitor and visualized in the EKS console to surface traffic in your cluster environment, and how it’s performing based on these flow level metrics. The following diagram depicts a high-level workflow in which both types of metrics (system and flow level) can be leveraged to gain more operational intelligence.
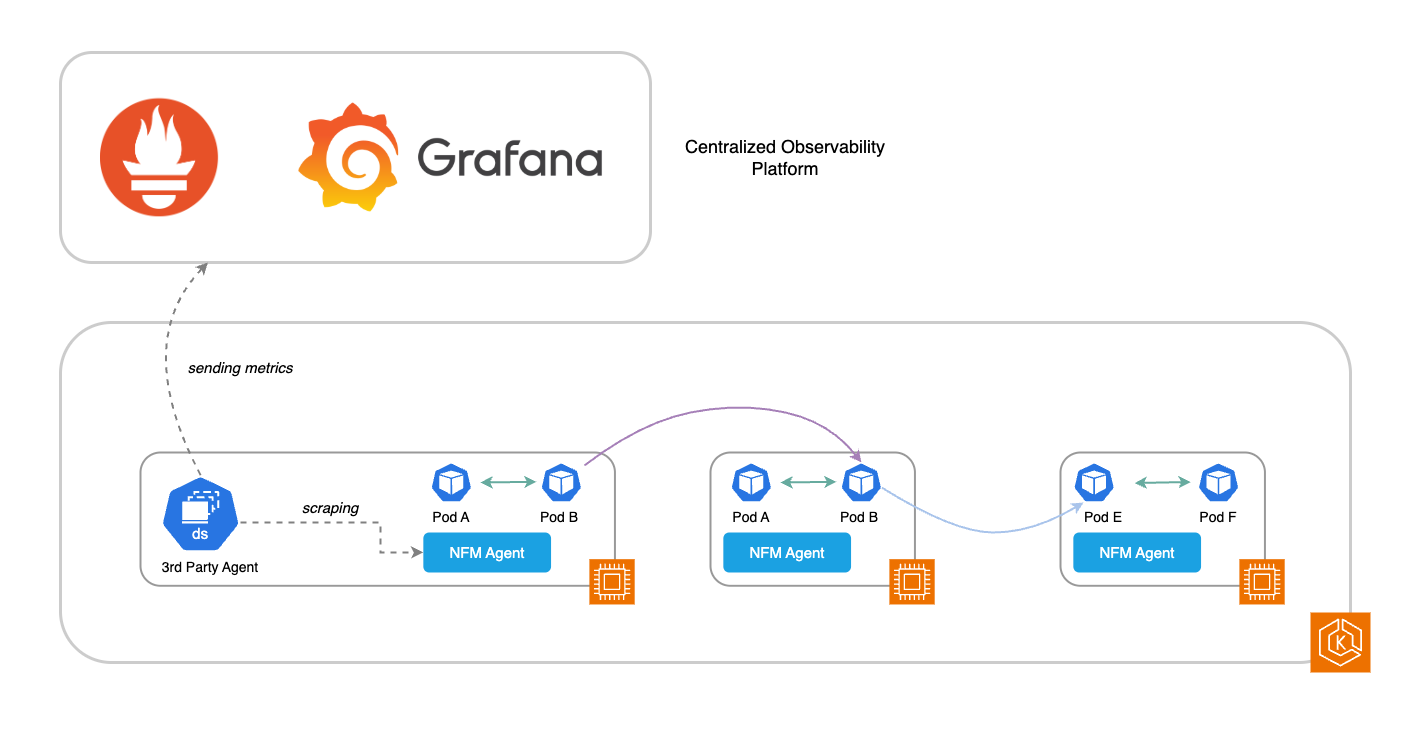
Figure 1: High-level overview of network performance monitoring in Amazon EKS
Walkthrough
In this section, we create a new EKS cluster and walk through the networking monitoring setup, export the metrics to Amazon Managed Service for Prometheus, and finally visualize them in the Amazon Managed Grafana dashboards. We can get started with the prerequisites.
Prerequisites
The following prerequisites are necessary to complete this solution:
- An AWS Account
- AWS Command Line Interface (AWS CLI) configured on your device or AWS CloudShell
- eksctl, a CLI tool for creating and managing EKS clusters
- kubectl, a CLI tool to interact with the Kubernetes API server
- awscurl, a CLI tool with AWS Signature Version 4 request signing
Setup
Let’s start with setting up few environment variables:
export AWS_REGION=us-west-2 #Replace with your AWS Region
export AWS_ACCOUNT=$(aws sts get-caller-identity --query 'Account' --output text)
export CLUSTER_NAME=eks-nfm-metrics-demo #Replace with your EKS cluster name
Start by creating a new EKS cluster with Kubernetes version 1.34. We are using eksctl to create an EKS cluster with one managed node group and a few addons:
cat << EOF > cluster.yaml
apiVersion: eksctl.io/v1alpha5
kind: ClusterConfig
metadata:
  name: ${CLUSTER_NAME}
  region: ${AWS_REGION}
  version: "1.34"
availabilityZones:
  - ${AWS_REGION}a
  - ${AWS_REGION}b
  - ${AWS_REGION}c
iam:
  podIdentityAssociations:
  - namespace: amazon-network-flow-monitor
    serviceAccountName: aws-network-flow-monitor-agent-service-account
    roleName: ${CLUSTER_NAME}-nfm-role
    permissionPolicyARNs: ["arn:aws:iam::aws:policy/CloudWatchNetworkFlowMonitorAgentPublishPolicy"]
managedNodeGroups:
- name: mng-1
  instanceType: t3.medium #smaller instance type
  desiredCapacity: 3
  privateNetworking: true
addonsConfig:
   autoApplyPodIdentityAssociations: true
addons:
- name: eks-pod-identity-agent
- name: metrics-server
- name: vpc-cni
- name: kube-proxy
- name: coredns
EOF

eksctl create cluster -f cluster.yaml
It takes approximately 15 minutes to get the cluster infrastructure created, so please wait until the cluster infrastructure is successfully created and you can verify the status using the following command or Amazon EKS console.
aws eks describe-cluster \
 --name ${CLUSTER_NAME} \
 --region ${AWS_REGION} \
 --query 'cluster.status'
The output of this command should be ACTIVE.
Now, install the AWS Network Flow Monitoring agent add-on on the EKS cluster. We need to customize the addon configuration to enable the open metrics endpoint. The add-on will deploy the network flow monitoring agent as a DaemonSet where every node will host an agent. In this command, we are enabling the open metrics endpoint listening on 9101 port and binding to 0.0.0.0 to make it available outside the node. We are doing this as Amazon Managed Service for Prometheus managed collectors is running outside the node, if your observability agent is running within the node, then you can skip the OPEN_METRICS_ADDRESS attribute.
aws eks describe-addon-versions \
 --kubernetes-version 1.34 \
 --addon-name aws-network-flow-monitoring-agent \
 --query 'addons[].addonVersions[].{Version: addonVersion, Defaultversion: compatibilities[0].defaultVersion}' \
 --output table
Pick the latest version for the addon from the output from previous command, always pick version v1.1.0-eksbuild.1 or above.
aws eks create-addon \
 --cluster-name ${CLUSTER_NAME} \
 --addon-name aws-network-flow-monitoring-agent \
 --addon-version v1.1.0-eksbuild.1 \
 --service-account-role-arn arn:aws:iam::${AWS_ACCOUNT}:role/${CLUSTER_NAME}-nfm-role \
 --configuration-values '{"env":{"OPEN_METRICS":"on","OPEN_METRICS_PORT":9101,"OPEN_METRICS_ADDRESS":"0.0.0.0"}}' \
 --region ${AWS_REGION}
In this walkthrough, we are using Amazon Managed Service for Prometheus and AWS managed collector to demonstrate the Amazon EKS network performance metrics scraping functionality. The same can be adapted to other Prometheus-based solutions such as self-managed Prometheus. Alternatively, you can use AWS Observability Accelerator (available in Terraform and CDK formats), which comes with opinionated modules, curated metrics, logs, traces collection, alerting rules, and Grafana dashboards for your AWS infrastructure and custom applications.
Start by creating an Amazon Managed Service for Prometheus workspace.
export AMP_WORKSPACE_ID=$(aws amp create-workspace \
    --alias eks-amp-demo \
    --region ${AWS_REGION} \
    --output text \
    --query 'workspaceId')
Create the Prometheus agent scraper configuration and include the new Amazon EKS control plane metrics endpoints as scraping targets, as shown in the following:
global:
   scrape_interval: 30s
scrape_configs:
  - job_name: pod_exporter
    kubernetes_sd_configs:
      - role: pod
  - job_name: cadvisor
    scheme: https
    authorization:
      type: Bearer
      credentials_file: /var/run/secrets/kubernetes.io/serviceaccount/token
    kubernetes_sd_configs:
      - role: node
    relabel_configs:
      - action: labelmap
        regex: __meta_kubernetes_node_label_(.+)
      - replacement: kubernetes.default.svc:443
        target_label: __address__
      - source_labels: [__meta_kubernetes_node_name]
        regex: (.+)
        target_label: __metrics_path__
        replacement: /api/v1/nodes/$1/proxy/metrics/cadvisor
  # apiserver metrics
  - scheme: https
    authorization:
      type: Bearer
      credentials_file: /var/run/secrets/kubernetes.io/serviceaccount/token
    job_name: kubernetes-apiservers
    kubernetes_sd_configs:
    - role: endpoints
    relabel_configs:
    - action: keep
      regex: default;kubernetes;https
      source_labels:
      - __meta_kubernetes_namespace
      - __meta_kubernetes_service_name
      - __meta_kubernetes_endpoint_port_name
  # kube proxy metrics
  - job_name: kube-proxy
    honor_labels: true
    kubernetes_sd_configs:
    - role: pod
    relabel_configs:
    - action: keep
      source_labels:
      - __meta_kubernetes_namespace
      - __meta_kubernetes_pod_name
      separator: '/'
      regex: 'kube-system/kube-proxy.+'
    - source_labels:
      - __address__
      action: replace
      target_label: __address__
      regex: (.+?)(\:\d+)?
      replacement: $1:10249
  # Scheduler metrics
  - job_name: 'ksh-metrics'
    kubernetes_sd_configs:
    - role: endpoints
    metrics_path: /apis/metrics.eks.amazonaws.com/v1/ksh/container/metrics
    scheme: https
    bearer_token_file: /var/run/secrets/kubernetes.io/serviceaccount/token
    relabel_configs:
    - source_labels:
      - __meta_kubernetes_namespace
      - __meta_kubernetes_service_name
      - __meta_kubernetes_endpoint_port_name
      action: keep
      regex: default;kubernetes;https
  # Controller Manager metrics
  - job_name: 'kcm-metrics'
    kubernetes_sd_configs:
    - role: endpoints
    metrics_path: /apis/metrics.eks.amazonaws.com/v1/kcm/container/metrics
    scheme: https
    bearer_token_file: /var/run/secrets/kubernetes.io/serviceaccount/token
    relabel_configs:
    - source_labels:
      - __meta_kubernetes_namespace
      - __meta_kubernetes_service_name
      - __meta_kubernetes_endpoint_port_name
      action: keep
      regex: default;kubernetes;https
  - job_name: 'eks-nfm-agent'
    kubernetes_sd_configs:
    - role: pod
    metrics_path: /metrics
    relabel_configs:
    - source_labels:
      - __meta_kubernetes_namespace
      - __meta_kubernetes_pod_label_name
      action: keep
      regex: amazon-network-flow-monitor;aws-network-flow-monitor-agent
    - target_label: __address__
      replacement: ${1}:9101
      source_labels:
      - __meta_kubernetes_pod_ip
An Amazon Managed Service for Prometheus collector consists of a scraper that discovers and collects metrics from an EKS cluster. Amazon Managed Service for Prometheus manages the scraper for you, giving you the scalability, security, and reliability that you need, without having to manage instances, agents, or scrapers yourself. Reference our blog on Automating metrics collection on Amazon EKS with Amazon Managed Service for Prometheus managed scrapers to learn more about setting Prometheus agent scraper configuration options on your Amazon EKS cluster. To set up a scraper, we need to provide VPC Subnets and EC2 Security Group, so we should retrieve these values from our EKS cluster setup.
export $(aws cloudformation describe-stacks \
  --stack-name "eksctl-${CLUSTER_NAME}-cluster" \
  --query 'Stacks[0].Outputs[?OutputKey==`SubnetsPrivate`].OutputValue' \
  --output text   | awk -F',' '{print "SUBNET_1=" $1 " SUBNET_2=" $2 " SUBNET_3=" $3}')

export EKS_SG_ID=$(aws cloudformation describe-stacks \
  --stack-name "eksctl-${CLUSTER_NAME}-cluster" \
  --query 'Stacks[0].Outputs[?OutputKey==`ClusterSecurityGroupId`].OutputValue' \
  --output text)
Create the scraper using the following command:
aws amp create-scraper \
  --source eksConfiguration="{clusterArn='arn:aws:eks:${AWS_REGION}:${AWS_ACCOUNT}:cluster/${CLUSTER_NAME}', securityGroupIds=['${EKS_SG_ID}'],subnetIds=['${SUBNET_1}','${SUBNET_2}',${SUBNET_3}]}" \
  --scrape-configuration configurationBlob="$(cat amp-scraper-config.yaml | base64)" \
  --destination ampConfiguration="{workspaceArn='arn:aws:aps:${AWS_REGION}:${AWS_ACCOUNT}:workspace/${AMP_WORKSPACE_ID}'}"
The scraper takes a few minutes to become active. You can verify the status in the Amazon EKS console under the Observability tab, as shown in the following figure:
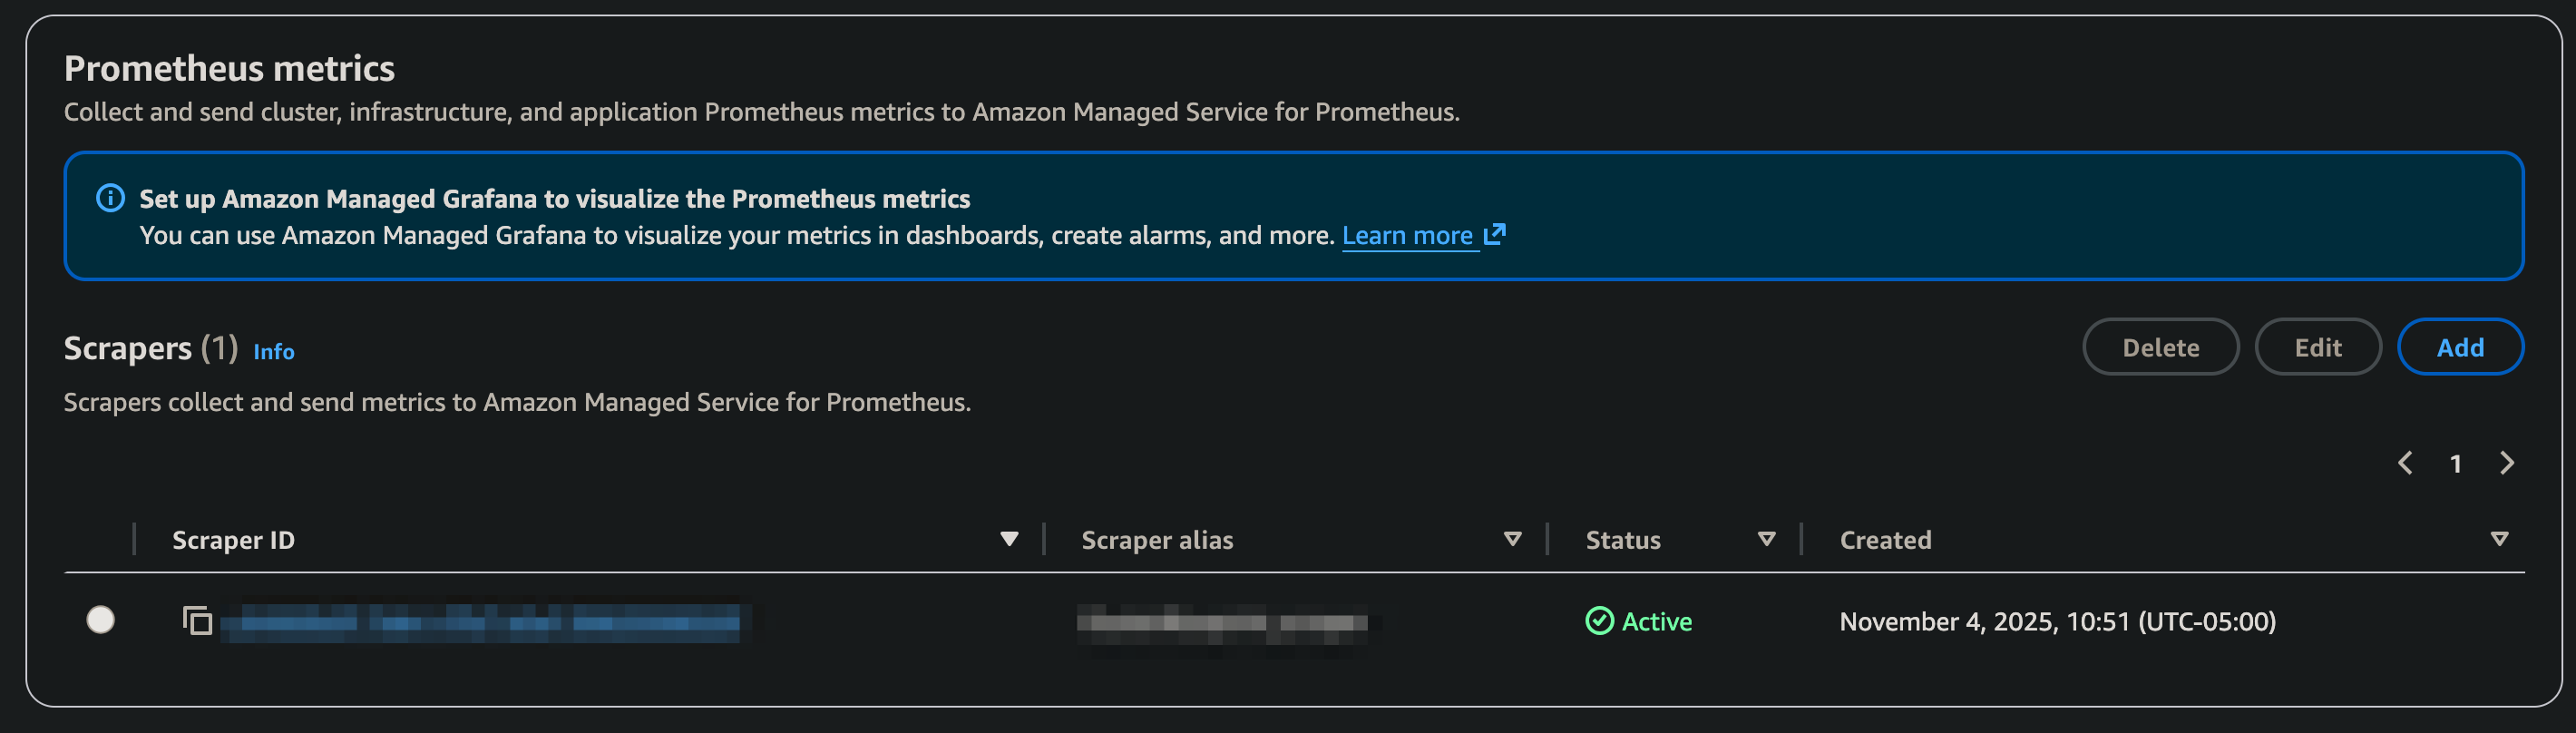
Figure 2: Amazon Managed Service for Prometheus scraper status
awscurl is a command-line tool that extends the functionality of curl by automatically handling AWS Signature Version 4 (SigV4) signing for HTTP requests. This allows users to make authenticated requests to AWS services directly from the command line, simplifying interaction with AWS APIs. We can verify the metrics ingestion by querying the Amazon Managed Service for Prometheus workspace using following awscurl command:
AMP_URL=$(aws amp describe-workspace \
  --workspace-id $AMP_WORKSPACE_ID \
  --query workspace.prometheusEndpoint \
  --output text)

export AMP_FULL_URL=${AMP_URL}api/v1/query
awscurl --service="aps" \
  --region=${AWS_REGION} \
  -X POST \
  -H "Content-Type: application/x-www-form-urlencoded" \
  -d 'query=bw_in_allowance_exceeded' "${AMP_FULL_URL}"
We can also use visualization tools such as Amazon Managed Grafana to instantly query, correlate, and visualize metrics. Follow the Amazon Managed Grafana getting started guide on how to set up a workspace and use Prometheus data source to connect to Amazon Managed Service for Prometheus workspace.
Now let’s import this dashboard to provide comprehensive network monitoring for Kubernetes pods. First, copy the JSON raw content from the link. Then, go to Dashboard -> New -> Import and Paste the JSON content and click load. Make sure you select your Prometheus Workspace id as a data source. This dashboard will highlight four key pieces of information: Summary Statistics, Network Traffic Metrics, Anomaly Detection & Alerts, and Correlation Analysis.
Network performance testing and visualization:
If we look at the cluster currently, it shows a normal network activity where Top 10 pods in bandwidth consumption (ingress/egress) are expected.
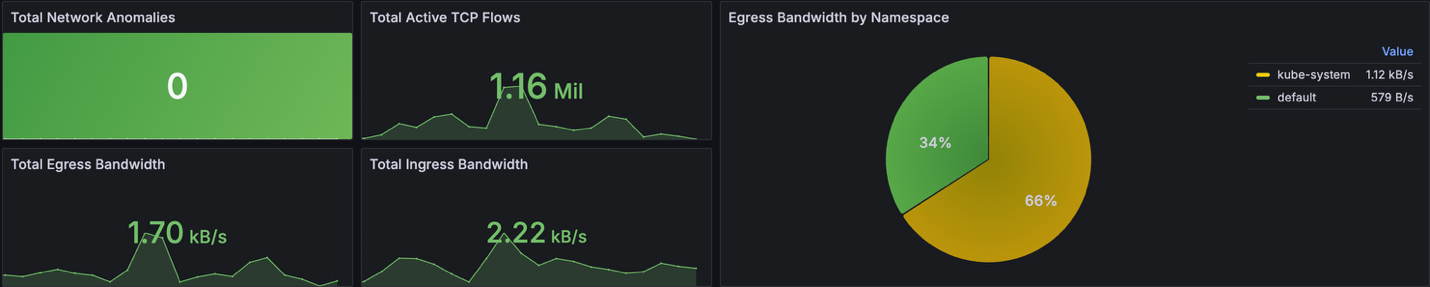
Figure 3: Grafana board showing network activity on the cluster
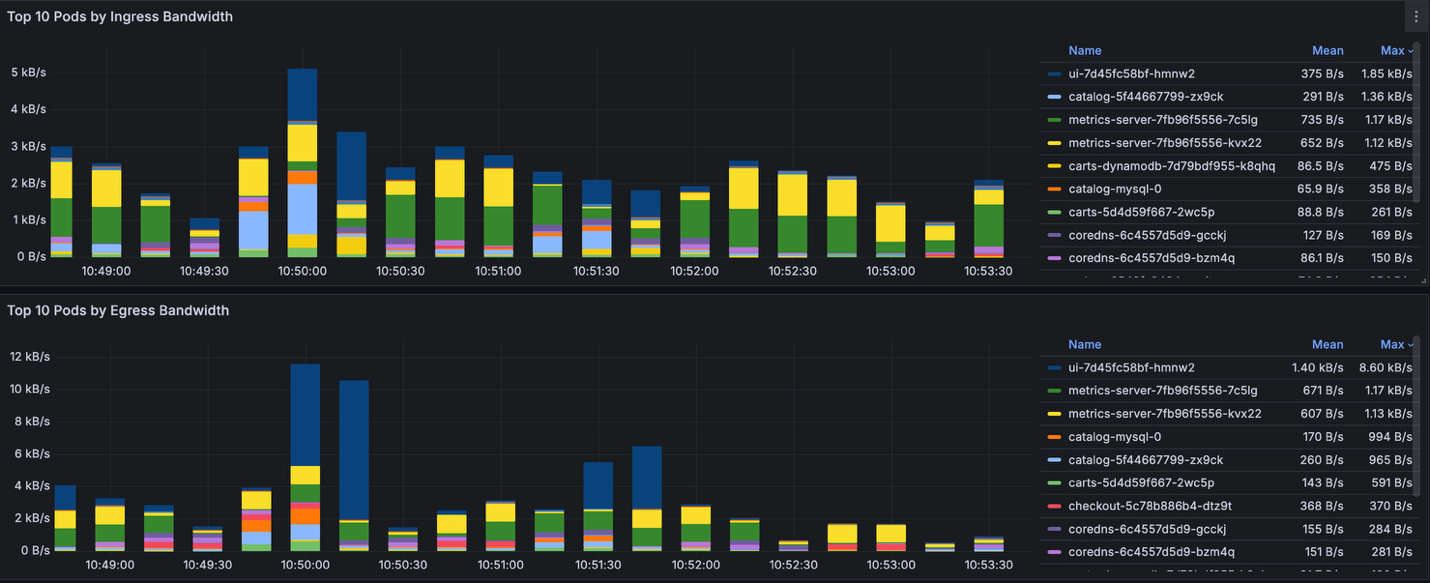
Figure 4: Grafana board showing network activity of top 10 pods.
Let’s generate heavy network traffic inside the cluster. We are using iperf, an open-source network performance measurement tool. The command will attempt to utilize all available bandwidth between client pod and server pod, it pushes the underlying infrastructure on the EC2 instance (t3.medium) to its limits.
To create this test, iperf-client will generate traffic (egress traffic) and send it toiperf-server within the EKS cluster. Below are the commands to create this test.
kubectl create ns iperf
kubectl run iperf-server -n iperf --image=cagedata/iperf3 --port=5201 -- iperf3 -s
kubectl expose pod iperf-server -n iperf --type ClusterIP
# 100 parallel streams to the SAME single server
kubectl run iperf-client --restart=Never -n iperf --image=cagedata/iperf3 -- iperf3 -c iperf-server.iperf.svc.cluster.local -p 5201 -P 100 -t 900 -i 30

kubectl get pods –n iperf

NODE                                           NAMESPACE   NAME           STATUS
ip-192-168-48-232.us-west-2.compute.internal   iperf       iperf-server   Running
ip-192-168-81-132.us-west-2.compute.internal   iperf       iperf-client   Running
As expected, the iperf namespace will consume most of egress bandwidth. We see that number of network anomalies and both ingress and egress are exceeding our threshold (10MB/s)
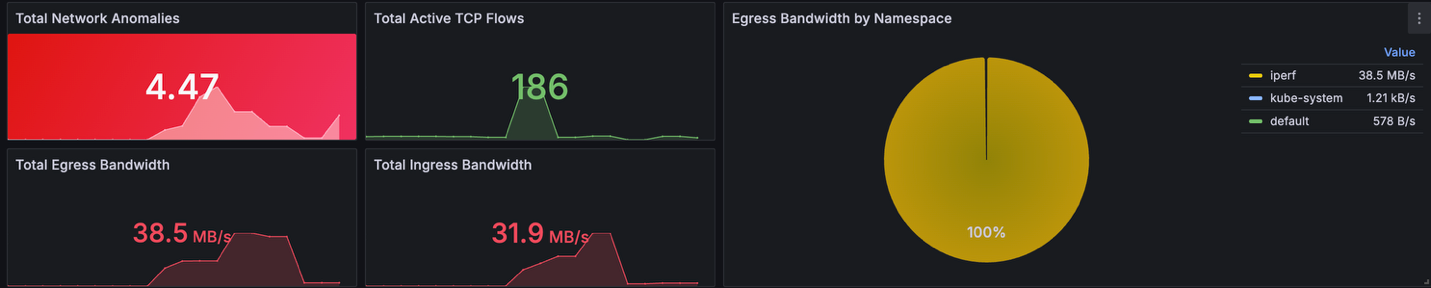
Figure 5: Grafana board showing network activity after load generation
To investigate these findings, let’s check different Anomaly Detection Panels about: Inbound Bandwidth Allowance Exceeded, Outbound Bandwidth Allowance Exceeded, PPS Allowance Exceeded, Connection Tracking Allowance Exceeded and Link Local Allowance Exceeded.
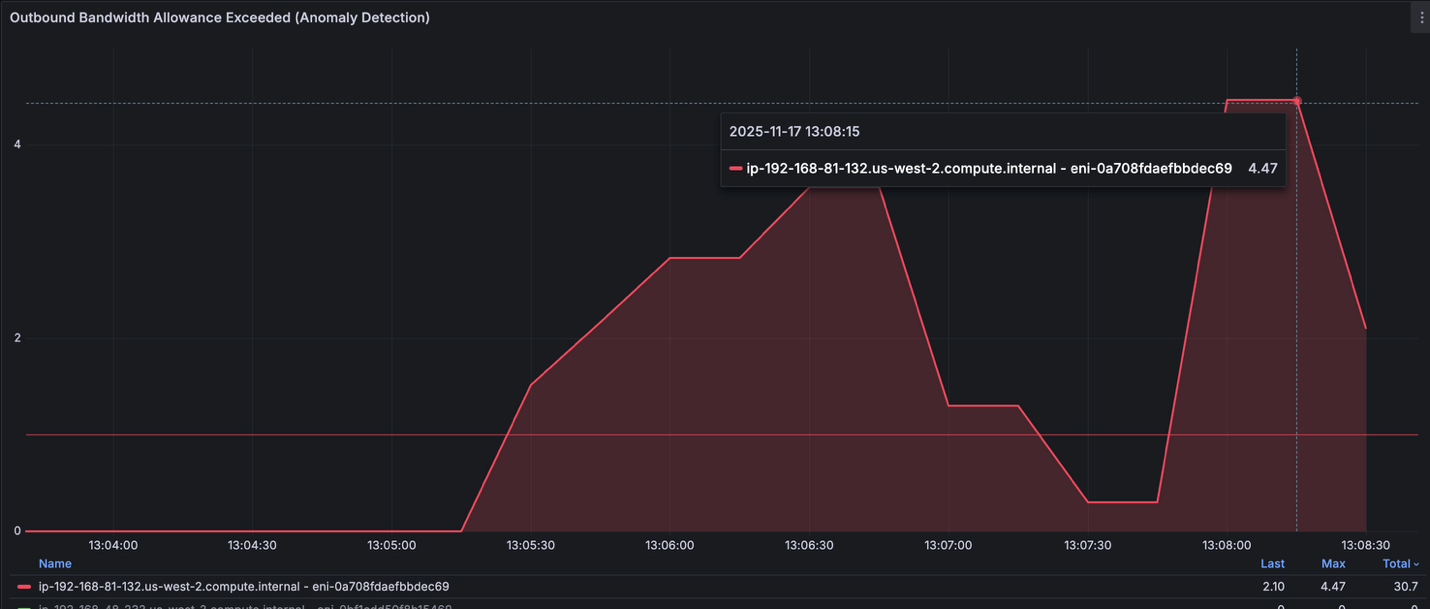
Figure 6: Grafana board showing Outbound Bandwidth Allowance
We see that one of the EKS node (ip-192-168-81-132.us-west-2.compute.internal) is having trouble meeting egress traffic that was generated on the node due to the network capacity on the instance. Further investigation, we can check top pods that have higher egress consumption per network interface (ENI). We found that iperf-client pod is on top by generating up to 600MB/s traffic that was sent to iperf-server pod.
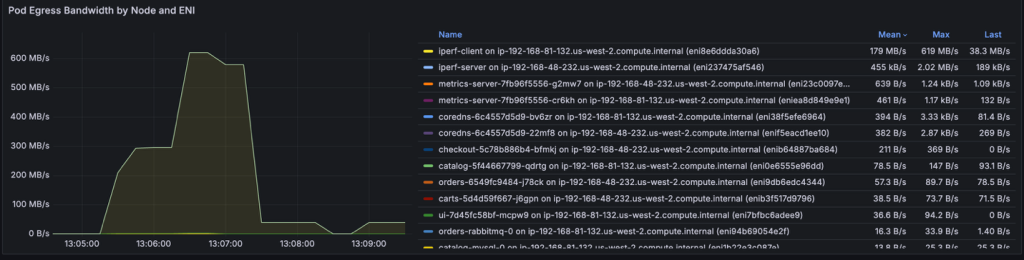
Figure 7: Grafana board showing Pod Egress Bandwidth by Node and ENI
On the other hand, the iperf-server is a receiver for all the traffic generated by the client side will be received as Ingress. This is why we see iperf-server is top on Pod Ingress bandwidth consumption per ENI.
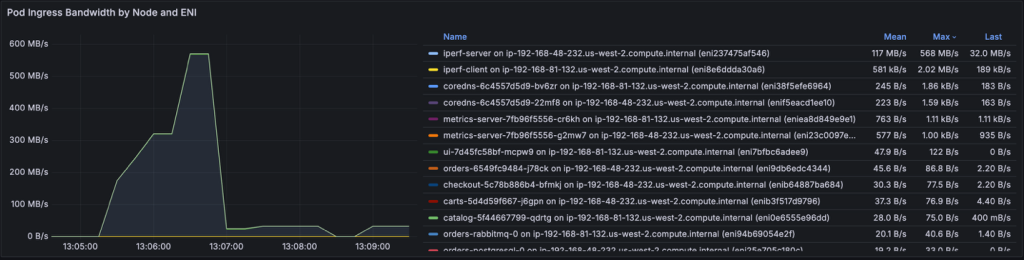
Figure 8: Grafana board showing Pod Egress Bandwidth by Node and ENI – iperf-server on top
Using iperf3 with 100 parallel TCP streams across two nodes, we successfully saturated the network to 618 MB/s egress and 568 MB/s ingress, reaching 96% of the t3.medium’s 625 MB/s burst capacity.
However, this sustained high throughput triggered AWS bandwidth allowance violations at a rate of 4.7 per second, as indicated by the bw_out_allowance_exceeded metric. The t3.medium instance type provides only 128 MB/s baseline bandwidth with temporary burst capability, and once burst credits were depleted, the instance experienced network throttling and packet drops.
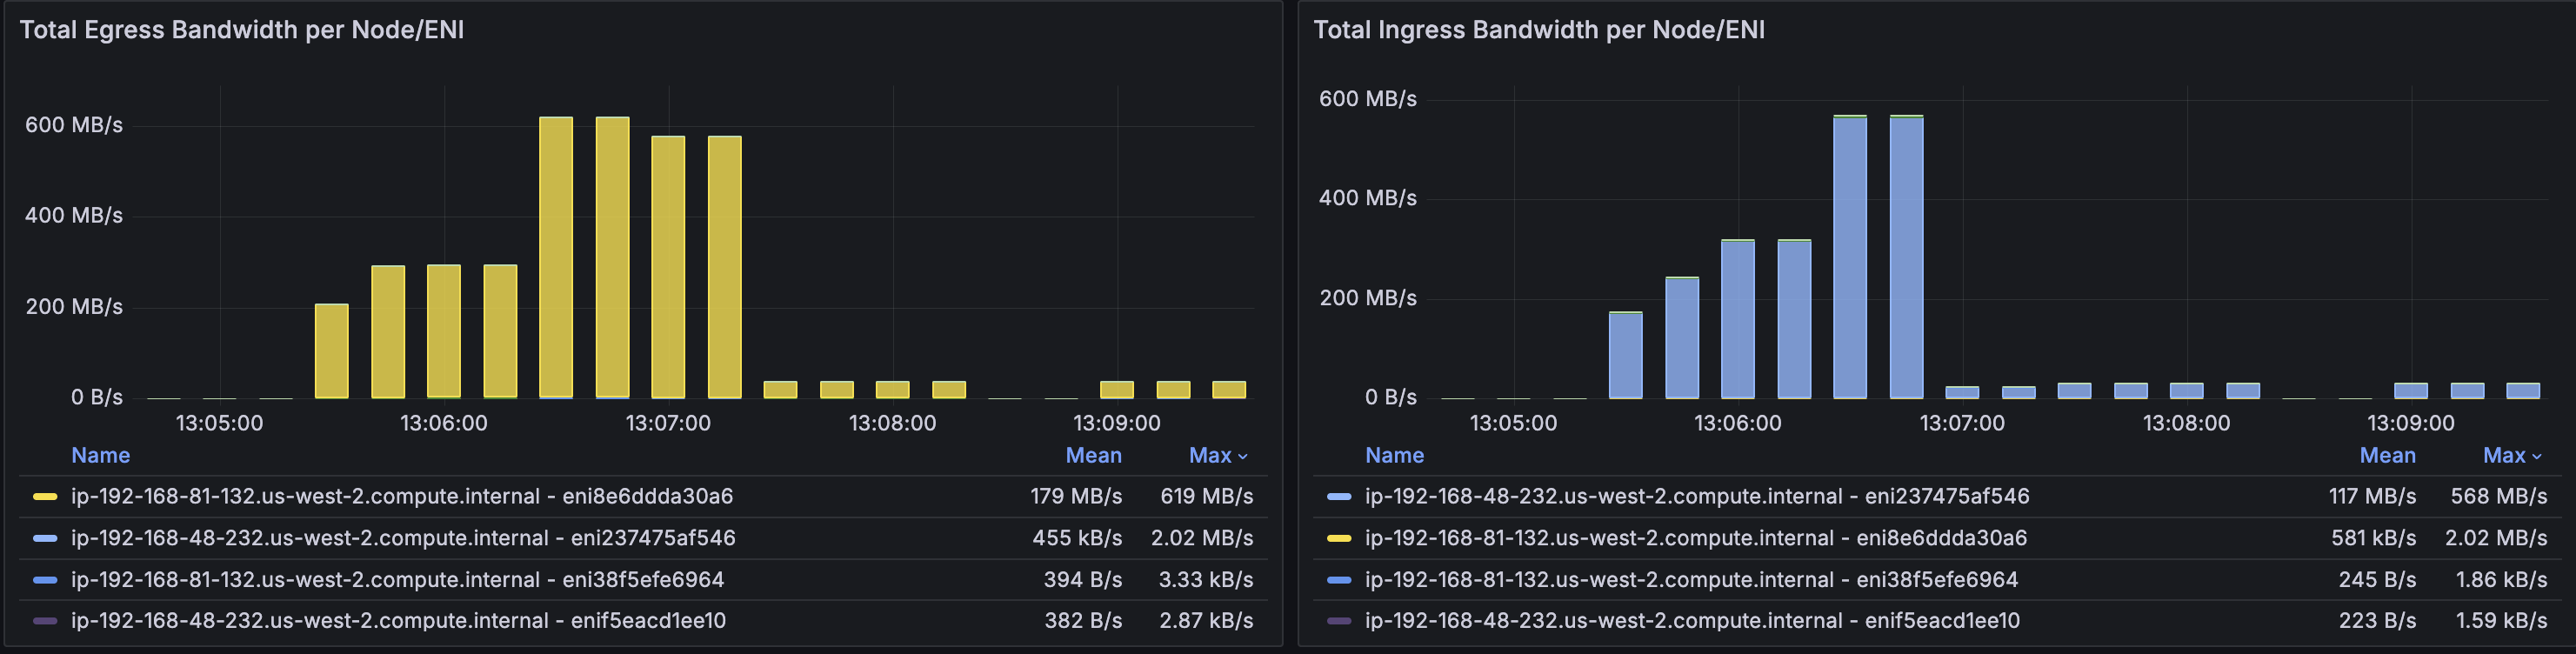
Figure 9: Grafana board showing total Egress and Ingress Bandwidth by Node and ENI
The Network Flow Monitor grafana dashboard successfully detected these anomalies in real-time, validating our monitoring infrastructure. For production workloads requiring sustained bandwidth exceeding 128 MB/s, we recommend upgrading to m5.xlarge or larger instances that offer 10 Gbps baseline capacity without burst limitations, ensuring consistent network performance without throttling.Self-managed Prometheus Setup
If you are running a self-managed Prometheus in your EKS cluster using kube-prometheus-stack, you can configure it by creating PodMonitor resource. In the kube-prometheus-stack, a PodMonitor is a custom resource that defines how Prometheus should monitor Kubernetes pods. It specifies which pods to scrape for metrics, how often to scrape them, and any more configuration needed for the scraping process. This allows for dynamic and declarative configuration of Prometheus monitoring targets. Create the PodMonitor objects to configure the prometheus agent to scrape the aws-network-flow-monitor-agent pods.
apiVersion: monitoring.coreos.com/v1
kind: PodMonitor
metadata:
  name: eks-nfm-agent
  namespace: amazon-network-flow-monitor
spec:
  selector:
    matchLabels:
      name: aws-network-flow-monitor-agent
  podMetricsEndpoints:
  - port: 9101
    path: /metrics
Key considerations
Managing dashboards and data sources with Grafana Operator
If you’re managing multiple EKS clusters or taking a GitOps approach, consider deploying the open-source grafana-operator to manage your Amazon Managed Grafana resources declaratively. The operator lets you define dashboards, data sources, and folders as Kubernetes custom resources, which means you can version control your network performance dashboards alongside your application code and deploy them through your existing CI/CD pipelines. This is particularly useful when you’re standardizing network observability across teams — you can template out dashboards showing network flow metrics, traffic patterns, and connection statistics, then automatically provision them as new clusters come online. Reference our blog on Using Open Source Grafana Operator on your Kubernetes cluster to manage Amazon Managed Grafana to learn more about using grafana-operator on Amazon EKS for managing Amazon Managed Grafana.
Using ADOT for telemetry collection
The AWS Distro for OpenTelemetry (ADOT) Collector is a secure, AWS-supported distribution that scrapes and exports metrics, traces, and logs from your workloads to various observability backends. Rather than manually deploying and managing ADOT Collectors across your EKS clusters, the ADOT Operator automates this by treating collectors as native Kubernetes resources. The operator supports different deployment patterns, DaemonSet for node-level collection, Deployment for cluster-level aggregation, or Sidecar for application-specific telemetry. For network performance monitoring, you’ll typically deploy a DaemonSet collector to scrape network metrics from each node, capturing data on throughput, packet drops, connection states, latency, and forward them to Amazon Managed Prometheus, while the operator handles lifecycle management, configuration updates, and health checks as your cluster scales.
Cleanup
To avoid ongoing charges, make sure to delete the EKS cluster resources and all the other AWS resources created in your AWS account.
SCRAPER_ID=$(aws amp list-scrapers \
  --region ${AWS_REGION} \
  --query "scrapers[?contains(source.eksConfiguration.clusterArn, '${CLUSTER_NAME}')].scraperId" \
  --output text)

aws amp delete-scraper \
  --scraper-id ${SCRAPER_ID} \
  --region ${AWS_REGION}

aws amp delete-workspace \
  --workspace-id ${AMP_WORKSPACE_ID} \
  --region ${AWS_REGION}

eksctl delete cluster -f cluster.yaml
Conclusion
In this post, we walked through how to monitor network performance for your Amazon EKS workloads using the new network observability features. We explored Network Flow analysis views to gain deeper insights into connection patterns, performance, and system level metrics. Next, we configured the export of Kubernetes-enriched network performance metrics to Amazon Managed Service for Prometheus and built custom dashboards in Amazon Managed Grafana to visualize key metrics like throughput, packet drops, latency, and connection states across our services. This gave our platform team the Kubernetes-aware network telemetry they needed to correlate to actual pods, services, and namespaces eliminating the guesswork when troubleshooting connectivity issues and reducing mean time to resolution.
We encourage you to enable network flow monitoring in your EKS clusters and start gaining visibility into network observability on your EKS cluster. The same approach works whether you’re using AWS managed services, third-party observability platforms, or self-managed open-source tools.
For more information, see the following resources:
- Using Network Flow Monitor
- AWS Network Flow monitor Agent addon-on on EKS
- Container Network Observability on EKS
- AWS Observability Best Practices Guide
- Amazon Managed Services for Prometheus
- AWS Observability Accelerators
About the authors
 Elamaran (Ela) Shanmugam is a Senior Container Specialist Solutions Architect at Amazon Web Services with over 20 years of experience in enterprise systems and infrastructure. Ela specializes in container technologies, app modernization, observability, and machine learning, Agentic AI, helping AWS Global Financial Services customers and partners design scalable and secure container workloads. Based in Tampa, Florida, Ela contributes to open source projects, speaks at events, mentors, and creates technical content.
 Ashok Srirama is a Principal Solutions Architect at Amazon Web Services, based in Washington Crossing, PA. He specializes in serverless applications, containers, and architecting distributed systems. When he’s not spending time with his family, he enjoys watching cricket, and driving his bimmer.
 Jihed Mselmi is a Senior Containers Solutions Architect at Amazon Web Services, specializing in application modernization for Global Financial Services across EMEA/APJ. He helps enterprises design and scale compliant containerized platforms on Amazon EKS, with deep expertise in Observability, Networking, and Platform Engineering for mission-critical production environments.