AWS Database Blog
How to use Amazon CloudWatch to monitor Amazon DynamoDB table size and item count metrics
Amazon DynamoDB sends metrics about its operations to Amazon CloudWatch. At the time of this writing, the list includes 33 metrics including: throughput consumed and provisioned, account and table limits, request latencies, system errors, and user errors. Two metrics not included are the DynamoDB table size and item count. These values can be observed in the AWS Management Console for DynamoDB and retrieved by using a DescribeTable API call, however the values aren’t sent to CloudWatch.
This post shows why it can be useful to track the history of these metrics, describes a design to send these metrics to CloudWatch using AWS Lambda and Amazon EventBridge, and walks through how to deploy the monitoring into your own account using AWS Cloud Development Kit (AWS CDK). The result is access to the size and item counts of DynamoDB tables and indexes within CloudWatch, where the values can be readily tracked, graphed, and used for alerts, as shown in Figure 1 that follows.
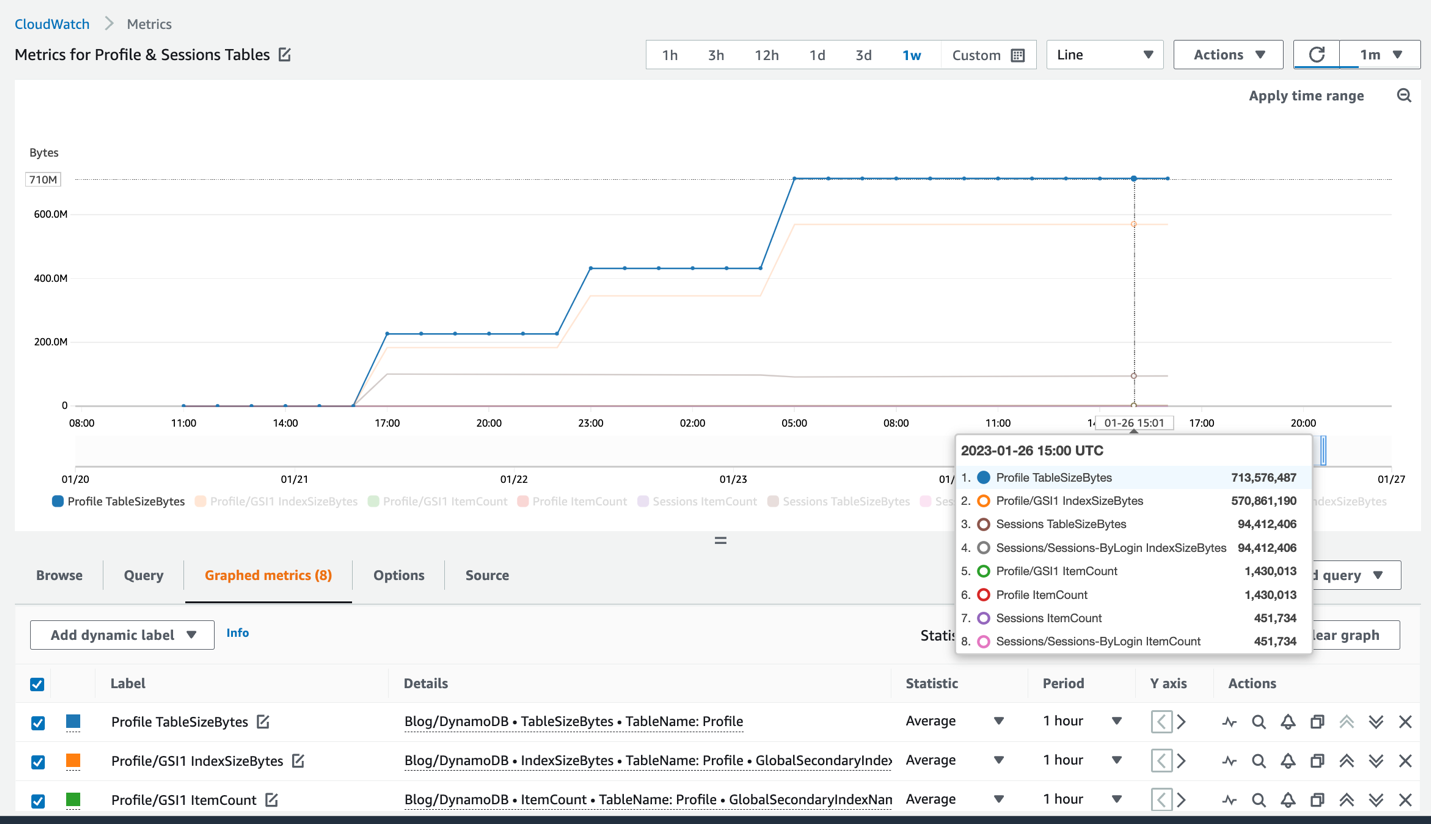
Figure 1: CloudWatch view of table and index metrics
Overview of solution
DynamoDB automatically tracks the total size (in bytes) and the item count of every table and secondary index. These metrics are available as part of the table’s metadata and are updated approximately every six hours at no cost. It’s better to use these values instead of doing a live item count obtained from a full table or index scan because a scan takes time to run and consumes read units.
Knowing the historic trend line of these values can be useful to answer a variety of questions such as:
- At what rate is your data size expanding?
- Has the average item size changed over the last year? (The average item size can be calculated from size and count.)
- How many items per day have been added recently?
- What storage cost should you anticipate for the next two quarters?
- At current storage size growth rates, when will this table become a candidate for the DynamoDB Standard-Infrequent Access (DynamoDB Standard-IA) table class? (Standard-IA is something to consider when the storage costs are greater than half the throughput costs.)
This post provides a Lambda function that loops over DynamoDB tables, calls the DescribeTable function on each, extracts the size and item count for the base table and any indexes, and then pushes the metrics to CloudWatch. EventBridge invokes the Lambda function on a repeating schedule. This process is shown in Figure 2 that follows.

Figure 2: EventBridge calls a Lambda function that gathers metrics and pushes them into CloudWatch
Walkthrough of Lambda code
The following is a simplified version of the Lambda function code. The actual code includes more edge cases, optimizations, and error handling. You’ll be given instructions for automated deployment of the production version later in this post.
First, the function needs to list the tables. A table listing request returns at most 100 items per page, so it uses the built-in paginator to automatically and invisibly handle any additional requests as necessary. For each table, it uses the DescribeTable function, which returns the table metadata in structured format. For any ACTIVE tables, it passes that metadata to append_metrics().
The job of the append_metrics() function that follows is to extract the ItemCount and TableSizeBytes from the table’s metadata and do the same for any secondary indexes whose metrics also reside within the metadata. As it extracts the values, it puts them into the metrics array in a format suitable for pushing to CloudWatch. The Dimensions array provides the table (or index) name. The MetricName says whether it’s a count or size. The Value is the number extracted from the metadata. The Unit designates the ItemCount as being a Count and TableSizeBytes and IndexSizeBytes as being in Bytes.
At this point, the Lambda function has created an array with all the latest metrics in a format ready to push to CloudWatch. The function has avoided pushing metrics one at a time in order to improve performance should an account have a large number of tables or indexes. CloudWatch allows up to 1,000 entries (or 1 MB of data) per call. The following code sends the entries in blocks of 1,000:
The code that pushes each batch to CloudWatch is a one-liner:
CloudWatch doesn’t require advance notice of what metrics it will receive and the metrics will usually appear in CloudWatch within 2 minutes after they’re sent. It can take up to 15 minutes for a new metric name to appear metric names list.
The namespace provides the context for the incoming metrics within CloudWatch. The official DynamoDB metrics all use the AWS/DynamoDB namespace. The code provided for download with this post defaults to the Blog/DynamoDB namespace so as not to confuse these unofficial metrics with the official metrics. You can change the namespace by setting the Namespace environment variable on the Lambda function, as shown in Figure 3 that follows, which gets read by the Lambda function and passed into the put call.
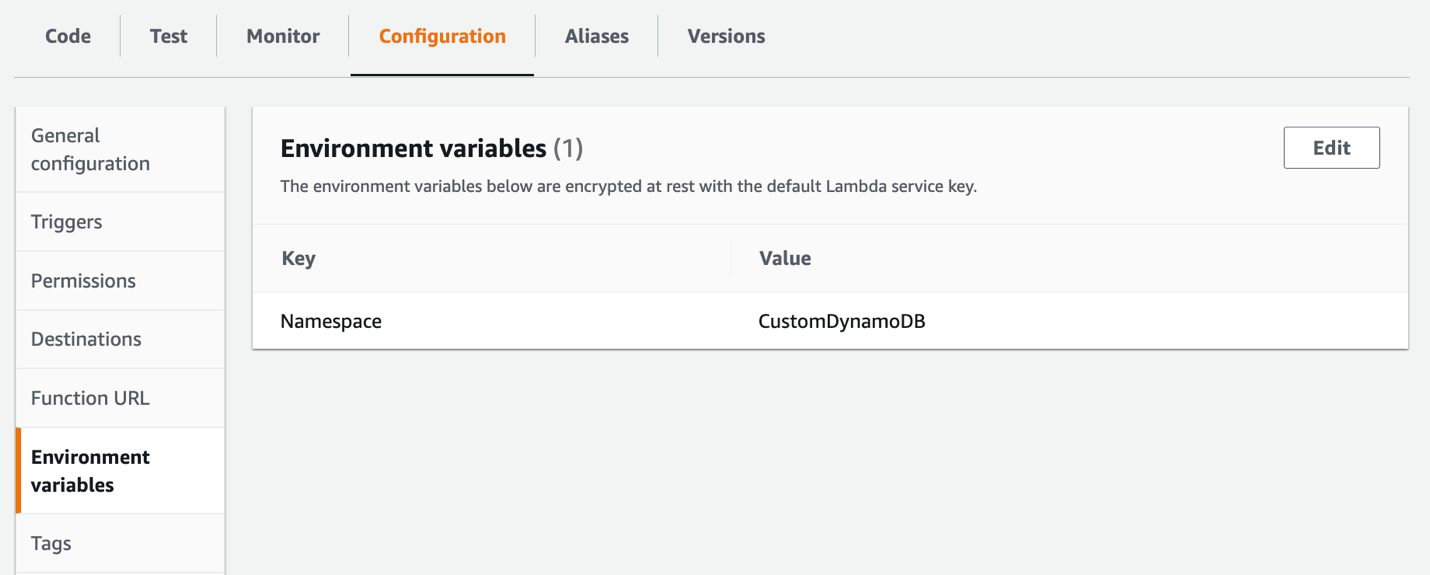
Figure 3: Specifying the namespace of the custom metrics using a Lambda configuration environment variable
Any time this function is invoked, it pushes the latest size and count data for every table and index in the local AWS Region to CloudWatch. Using EventBridge, you can invoke the function automatically on a repeating pattern. We suggest once an hour. By running the function hourly, it will be at most 60 minutes and on average 30 minutes before the table metadata updates (which run in the background approximately every 6 hours but on an unpredictable schedule) are pushed to CloudWatch.
Cost considerations
Let’s now consider the costs associated with this solution. There are no additional costs to poll the DynamoDB control plane APIs. The Lambda costs are essentially zero: running a 256 MB Lambda function every hour for 0.5 seconds consumes 720 requests and 90 GB-seconds each month. The Lambda free tier includes a million requests and 400,000 GB-seconds per month.
The cost to consider is CloudWatch. Custom metrics cost $0.30 per month (in the US East (N. Virginia) Region, as of the time of publication). If you track five tables, each having a secondary index, that’s 10 entities being tracked with two custom metrics each, producing a total of 20 custom metrics at a cost of $6 per month.
Including and excluding tables and indexes
Considering the costs described above, you might want to be selective regarding which tables and indexes to monitor with CloudWatch. By default, the Lambda function sends metrics for every table and index in the given account and Region it runs in. However, you can use Lambda environment variables to include or exclude specific tables and indexes.
The Includes environment variable lets you specify a comma separated list of tables and indexes to track. Any item not specified in the Includes variable will not be tracked. An absent or empty variable value means to track all. Wildcards are supported for the index name so tablename/* means to include all secondary indexes for the named table.
The Excludes environment variable lets you specify a comma separated list of tables and indexes not to track. This can be useful instead of Includes when you want to track everything except a few items. Anything matching both Includes and Excludes will be excluded. Wildcards are supported so tablename/* means to avoid tracking any secondary indexes for the named table and */* means to avoid tracking any secondary indexes on any table (but won’t exclude base table tracking).
You specify these variables in the Lambda configuration based on key-value pairs, as shown in Figure 4 that follows:
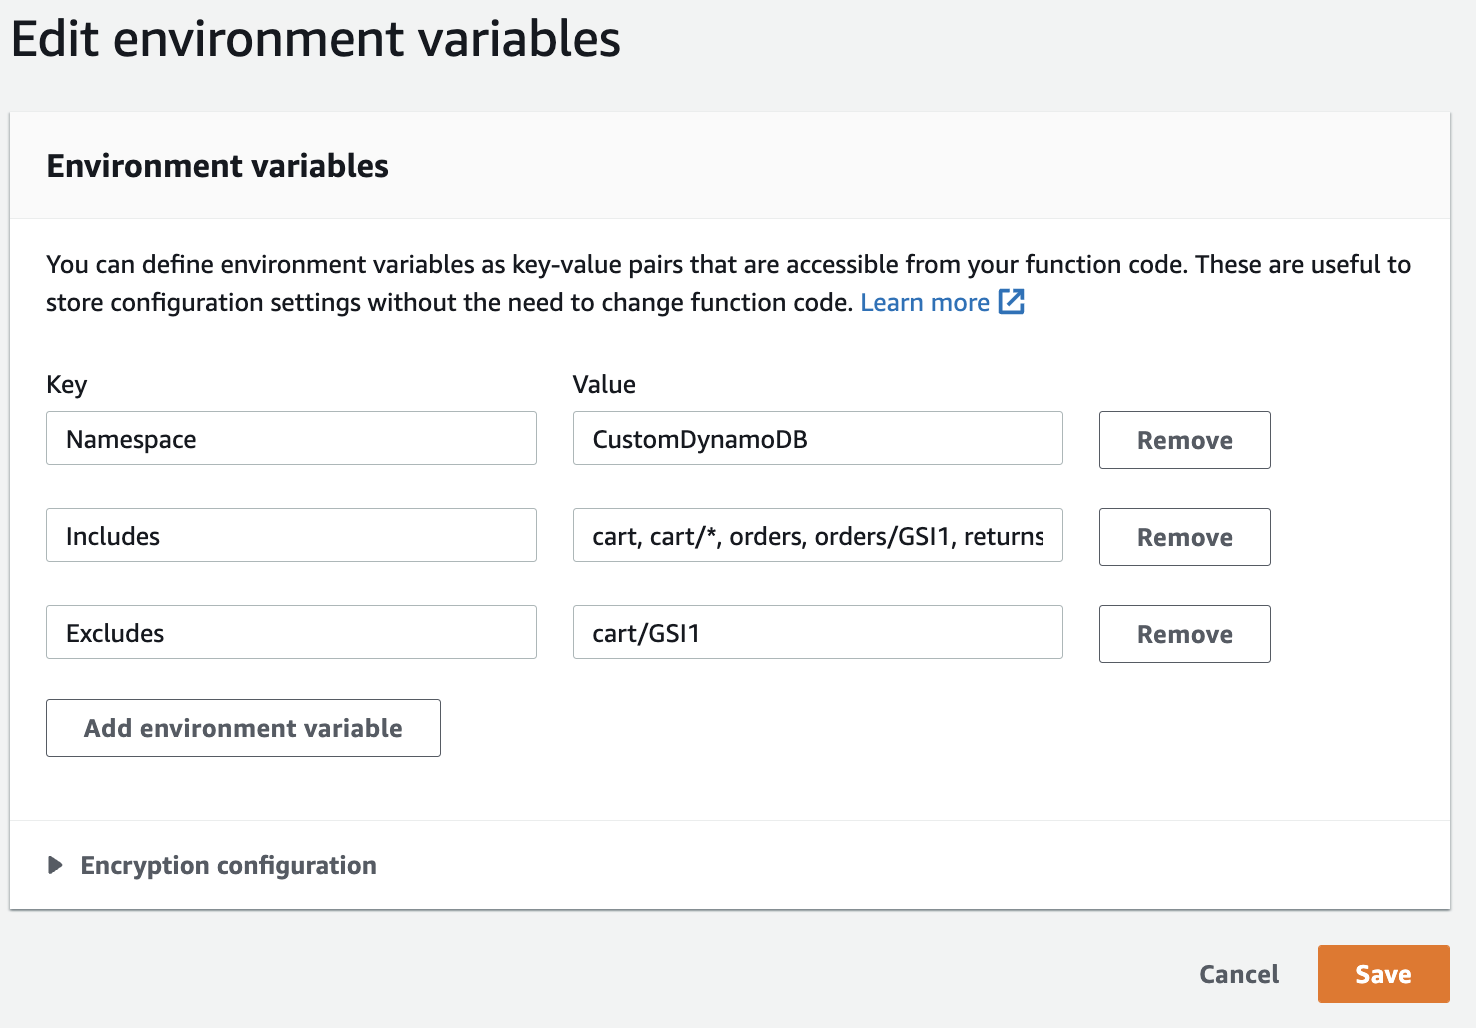
Figure 4: Use Includes and Excludes Lambda environment variables to control which metrics to track
Examples
- Include the
cart,orders, andreturnstables, all secondary indexes oncart, theGSI1secondary index onorders, and no secondary indexes onreturns:
- Exclude the
devtable and all its secondary indexes:
- Include the
carttable and all its secondary indexes, but excludeGSI1:
- Include all tables but exclude all secondary indexes:
Use the AWS CDK to configure a serverless application deployment
This section walks you through how the AWS CDK programmatically installs a serverless application. The components it installs are:
- The Lambda function
- The EventBridge rule that invokes the Lambda function every hour
- An AWS Identity and Access Management (IAM) policy that grants the Lambda function permission to read from DynamoDB and write to CloudWatch
You can deploy these components using the AWS CDK. The CDK is a programming system that lets you script configuration (in a variety of languages, including Python). When run, it synthesizes your configuration to an AWS CloudFormation stack that is then deployed in your account. You don’t have to think about YAML files or zipping Lambda function code. Using the CDK simplifies deploying updated code such that if you want something customized, you can edit the provided Lambda code and then deploy the edits with one command.
The following is the Python code to deploy the code from this blog. With the AWS CDK, you use code like this instead of CloudFormation YAML configuration files:
The init function first defines the Lambda function. It’s set up to use Python 3.9, 256 MB of memory, an ARM processor, and a 60-second timeout. It’s told to pull and package the Lambda code from the lambda folder local to where the code is running.
The function then defines the IAM policy. The Lambda function needs permission to list and describe DynamoDB tables and put metric data into CloudWatch.
Lastly, it creates an EventBridge rule that runs every hour to invoke the function.
Run the AWS CDK deployment commands
This section explains how to actively deploy this serverless application into your own account.
You can deploy with AWS CDK using any compute shell environment: your own laptop, an Amazon Elastic Compute Cloud (Amazon EC2) instance, or (what you’ll use here) the AWS CloudShell, a browser-based shell that’s readily available in many AWS Regions.
To run the deployment commands
- Open the CloudShell console, using any Region that supports CloudShell. If your desired Region doesn’t support CloudShell, you can install cross-Region from one that does as described later.

Figure 5: Command-line access readily provided by the CloudShell service
- Run the following command to download the .zip file to CloudShell.
wget https://aws-blogs-artifacts-public.s3.amazonaws.com/artifacts/DBBLOG-2540/DynamoDBCustomMetrics.zipThis .zip file was built against the source hosted on GitHub.
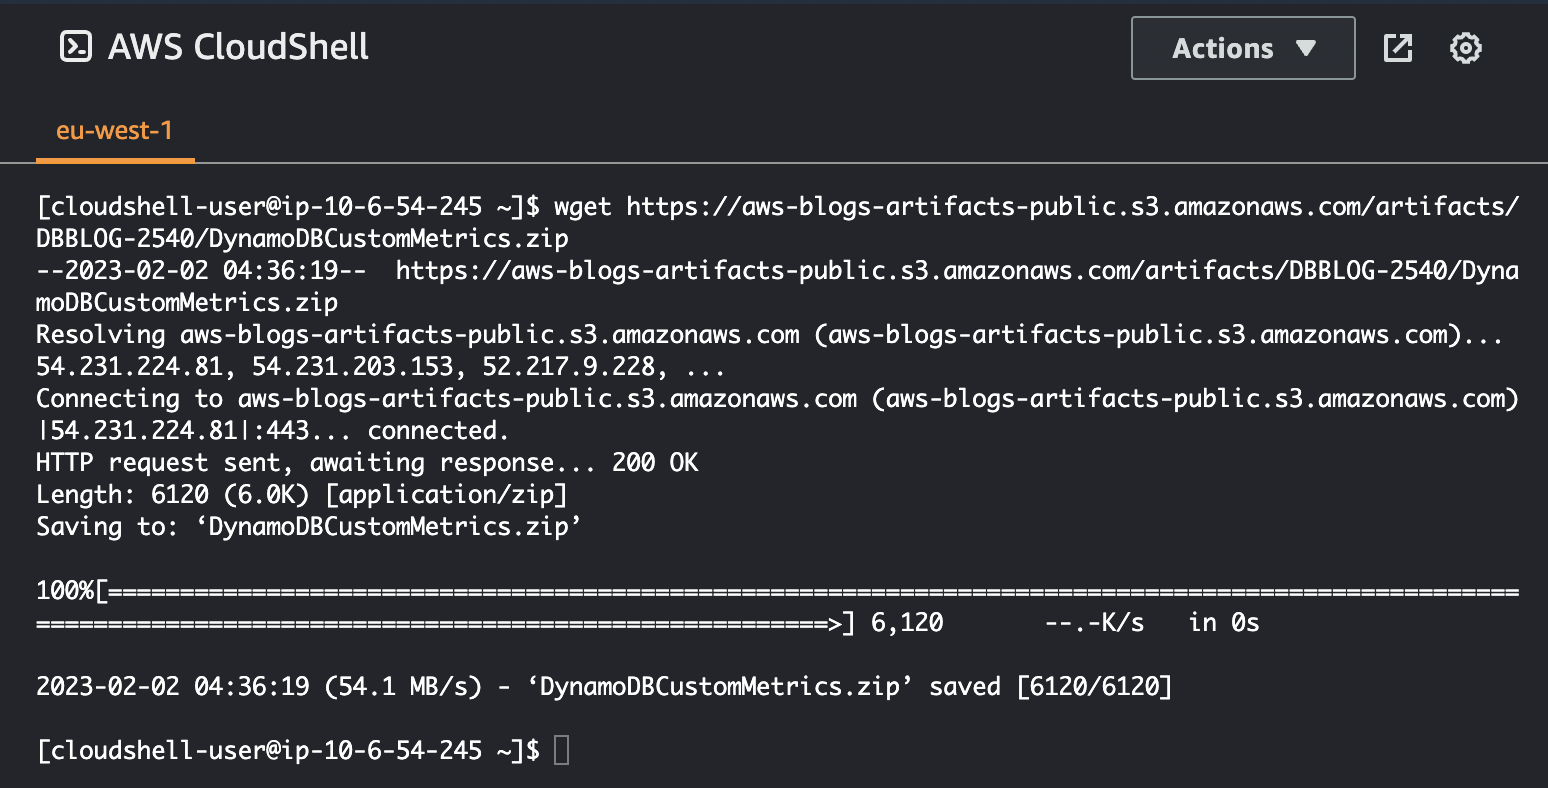
Figure 6: Pulling the .zip file into the CloudShell environment using wget
- Unzip the file and then
cdto the new folder:
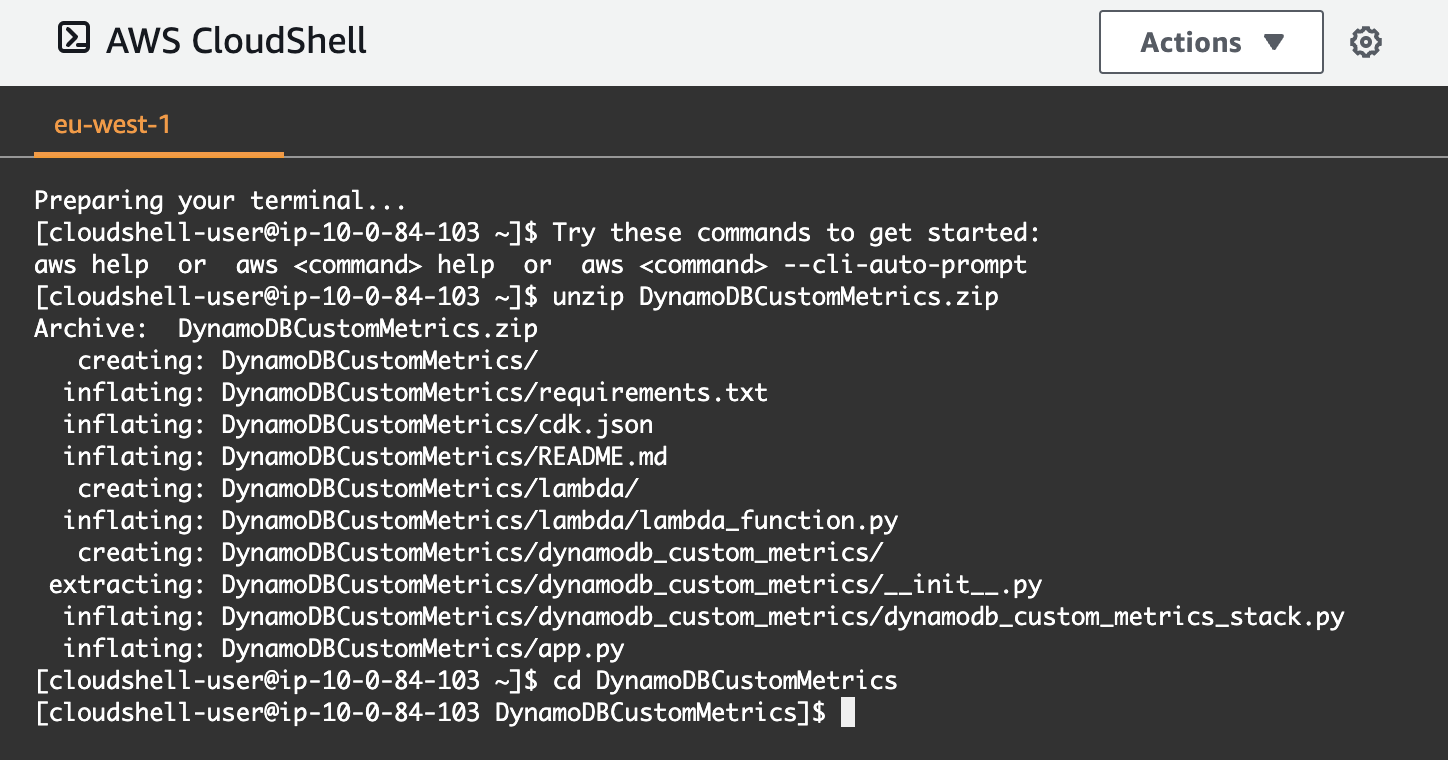
Figure 7: Unzipping the file and changing directory to the destination folder
- Prepare the Python CDK environment by running
pip3 install -r requirements.txt

Figure 8: Installing the needed Python packages
- Bootstrap the CDK with
cdk bootstrap. This must be done once per Region for the CDK to create what it needs in that Region (such as a dedicated S3 bucket to support deployment).

Figure 9: Bootstrapping the CDK
- Deploy the setup with
cdk deploy.
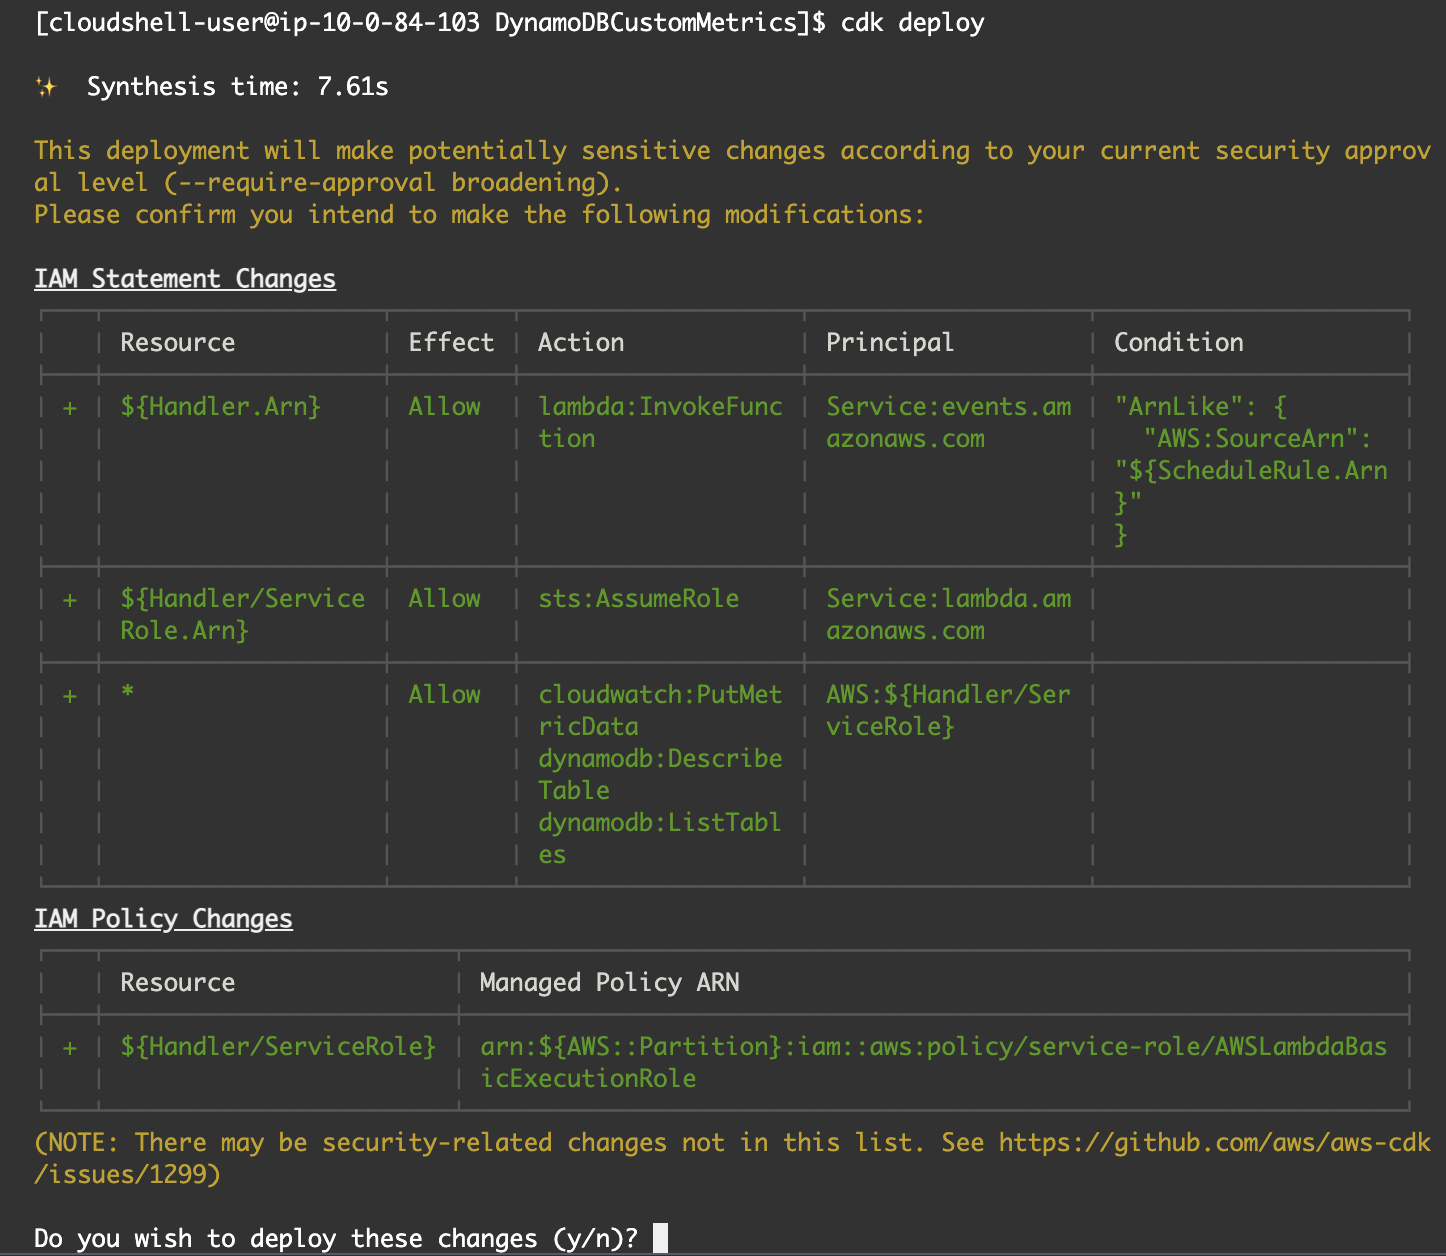
Figure 10: Getting ready for an actual deployment
- Enter
yfor yes, and you’ll have it fully deployed in the chosen Region. If you want to edit the code under thelambdafolder in the future, a secondcdk deploywill push the edited code out.
Note: If you want to deploy to a different Region you can repeat this process in that Region, or you can adjust the app.py code to point to different accounts or Regions for bulk deployment by following the comments in the file.
Cleaning up
To remove everything you just installed, run cdk destroy. You can see that the CDK uses a CloudFormation stack. Any recorded CloudWatch metrics will remain.

Figure 11: Cleaning up what was installed
Conclusion
DynamoDB tables and indexes automatically maintain statistics about their item count and total size, updated approximately every 6 hours, but there’s no automatic tracking of the historic values. By using a Lambda function called regularly from EventBridge and pushing metrics to CloudWatch, you can keep a historic record of these statistics for tracking, graphing, prediction, and alerting. You can deploy the serverless application using the AWS CDK. You’ll need a separate install per Region. You can use Lambda environment variables to control what tables and indexes are tracked and into what namespace the metrics should be placed.
If you have any comments or questions, leave a comment in the comments section. You can find more DynamoDB posts and other posts written by Jason Hunter in the AWS Database Blog.
About the authors
 Jason Hunter is a California-based Principal Solutions Architect specializing in DynamoDB. He’s been working with NoSQL Databases since 2003. He’s known for his contributions to Java, open source, and XML.
 Vivek Natarajan is a CS major at Purdue and a Solutions Architect intern at AWS.