AWS Database Blog
Using the shared plan cache for Amazon Aurora PostgreSQL
In this post, we discuss how the Shared Plan Cache feature of the Amazon Aurora PostgreSQL-Compatible Edition can significantly reduce memory consumption of generic SQL plans in high-concurrency environments, transforming what could be a 40GB memory overhead into a manageable 400MB footprint.
Imagine your Aurora PostgreSQL database cluster is serving thousands of concurrent connections, each executing the same prepared statements. You notice memory usage increasing to tens of gigabytes, yet the queries themselves are simple. What’s happening? You’re likely experiencing the hidden cost of plan duplication, a problem that the shared plan cache can elegantly solve.
Understanding generic plans in PostgreSQL
Prepared statements are commonly used in applications (when they define functions or methods that interact with the database), where these statements are included in their database access code/methods. The preparation phase includes both the SQL statement structure and placeholders, which will be filled with actual values when the application executes the prepared statement. In the preparation phase, the statement is parsed, analyzed and rewritten, thereby saving on repetitive parsing and analyzing work when it is executed.
Before diving into the solution, let’s understand how PostgreSQL handles prepared statements. In PostgreSQL and Aurora PostgreSQL, prepared statements can be executed using two types of plans:
- Custom plans: Created fresh for each execution with specific parameter values where literals are included.
- Generic plans: Parameter-independent plans that are reused across executions where literals are not included.
By default, PostgreSQL uses an intelligent approach to decide between these two plan types:
- The first five executions of a prepared statement use custom plans
- The average cost of these custom plans is calculated
- On the sixth execution, a generic plan is created
- If the generic plan’s cost is comparable to or better than the average custom plan cost, it’s used for subsequent executions
This approach saves planning time for frequently executed queries, but it comes with a hidden cost in environments with many concurrent database connections.
The problem: memory inefficiency at scale
While this approach works well for individual connections, it creates two significant inefficiencies in environments with many concurrent database connections:
- Unnecessary plan generation: Even when a generic plan won’t be used (because custom plans are more efficient), the system still creates and stores it in memory for cost comparison purposes. For example, for partitioned tables, there is a higher chance of a generic plan not being used because the cost is calculated for the leaf partitions and then summed up.
- Plan duplication: When the same query is executed across hundreds or thousands of sessions, each session maintains its own copy of the identical generic plan, leading to massive memory duplication.
Let’s demonstrate this problem with a concrete example:
Setting up the test environment
For this example, we create 2 tables t1 and t2 each with 1000 partitions in a new session. We then insert 100,000 rows into each table by looping 100 times with each loop iteration inserting 1000 values. We finally gather fresh statistics on both tables.
Note: In order to use the shared plan cache feature you must be using Aurora PostgreSQL version 17.6 and later or version 16.10 and later.
You can use the \gexec switch here to run the output of our select as an independent SQL statement. You can disable the psql pager using \pset pager to avoid having to hit enter multiple times when creating your table partitions.
Observing memory consumption
In Session 1, we create and execute the following prepared statement:
Then, we check the memory consumption:
For this test we observe that the generic plan consumes approximately 4MB and remains in memory until the prepared statement is deallocated or the connection terminates.
The duplication problem
Now, let’s use another session (Session 2) and execute the same prepared statement:
Session 2 also consumes 4MB for the exact same generic plan!
The multiplication effect
This duplication happens for every session that executes the prepared statement. Let’s calculate the impact:
- 1 prepared statement × 100 connections × 4MB = 400MB of memory
- 100 different prepared statements × 100 connections × 4MB = 40GB of memory
This massive memory consumption occurs even though the sessions are storing identical copies of the same generic plan. In environments with many concurrent database connections, this can quickly exhaust available memory and force you to use larger, more expensive instance types.
The solution: Aurora PostgreSQL Shared Plan Cache
Aurora PostgreSQL solves this with shared plan cache (SPC), which keeps just one copy of each generic plan that the sessions can use. This dramatically reduces memory consumption while maintaining the performance benefits of plan caching.
You can enable the shared plan cache(SPC) using a cluster or instance parameter group:
apg_shared_plan_cache.enable = ON
Because apg_shared_plan_cache.enable is a dynamic parameter you don’t have to restart the instance for the changes to take effect.
SPC is implemented as a dynamic hash table, shared across the sessions, where the number of entries in the cache can be controlled by via apg_shared_plan_cache.max. You can also use the following parameters to control the minimum and the maximum size of an entry.
Demonstrating the Shared Plan Cache in action
Let’s repeat our earlier experiment with the shared plan cache enabled:
Session 1 (First Connection):
The first session still shows the 4MB plan in its local memory (needed to populate the shared cache).
Session 2 (Subsequent Connection):
No local plan storage! The second session is using the shared plan cache.
Monitoring cache usage
We run the following SQL to show how many cache hits individual shared plans stored in our cache have received. Every hit represents a plan that has not needed to be duplicated in session memory.
Cleanup:
Performance impact
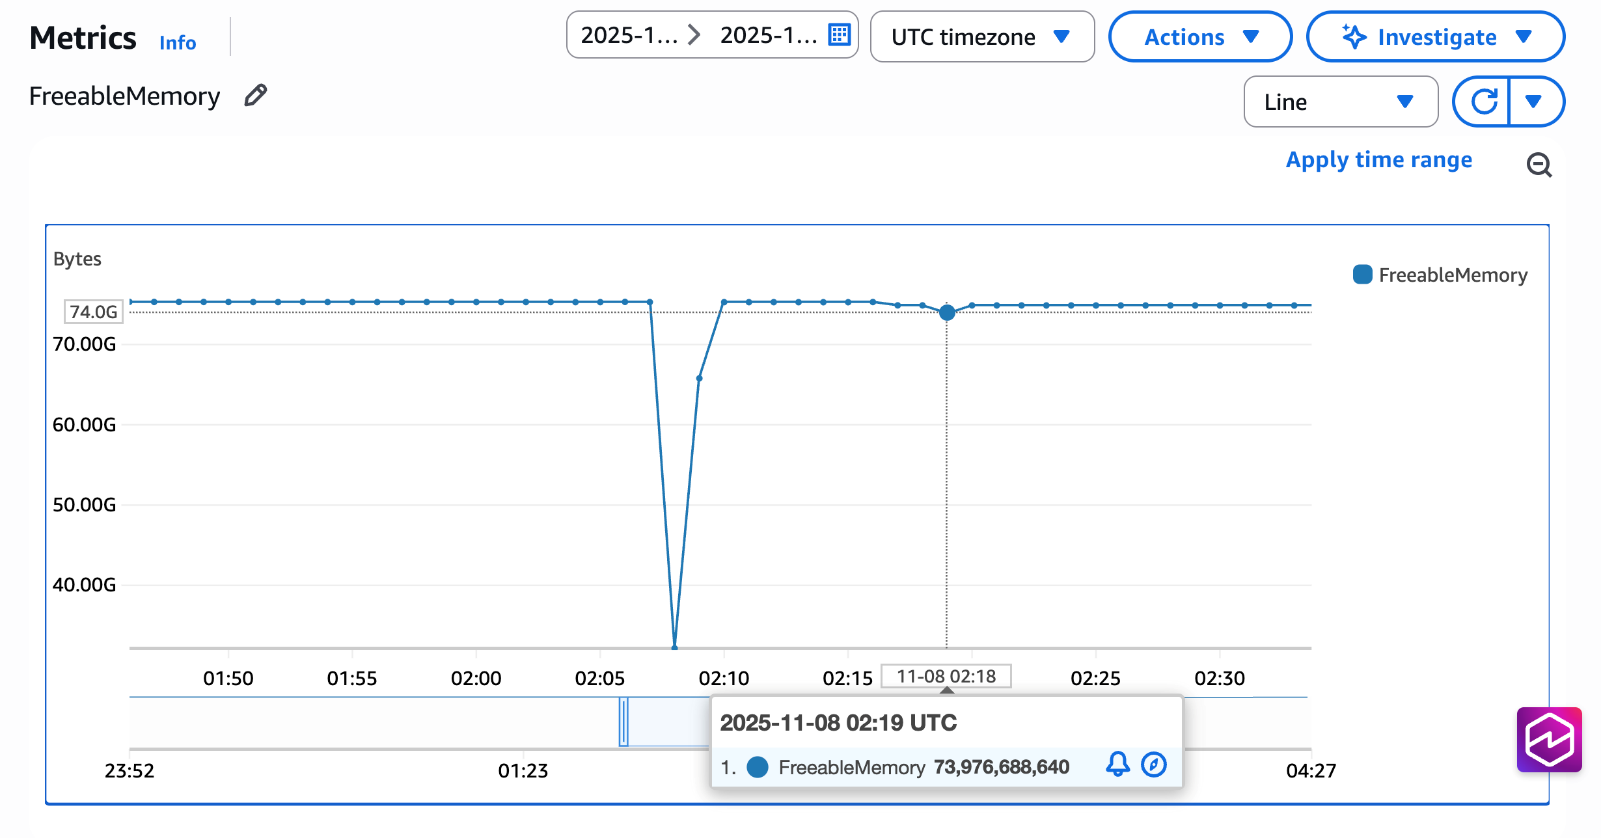
In our example scenario with 100 different prepared statements across 100 connections, we observed a transformation from 40GB of duplicated plan storage down to just 400MB in the shared cache. The screenshot below shows a graph of the Freeable Memory Cloudwatch metric obtained from an instance where a test was run using pgbench with 100 distinct prepared statements (used from the example above) across 100 connections with apg_shared_plan_cache.enable = off. We can observe that between 02:05 and 02:10, FreeableMemory drops by approximately 40GB, which aligns with our expected duplicated plan storage footprint. When we enabled shared plan cache and ran the same test again, the memory impact was drastically reduced, requiring only a small amount of memory instead of 40GB.
This reduction means you can:
- Run the same workload on smaller instances, significantly reducing your AWS costs
- Support more concurrent connections without hitting memory limits
- Avoid out-of-memory errors during traffic spikes
Best practices
This feature is particularly beneficial when:
- Your application maintains hundreds or thousands of database connections
- You use prepared statements extensively
- Your queries involve partitioned tables or complex operators (for example joins and common table expressions) that generate large plans
- You observe high memory usage from backend processes
- Your workload has repetitive query patterns with parameterized queries
While Shared Plan Cache offers significant benefits, note that this feature may not be suited for the following scenarios:
- Workloads with highly unique, ad-hoc queries
- Applications that rarely reuse prepared statements
- Environments with few concurrent connections
Conclusion
In this post we showed you how you can enable the shared plan cache in Aurora PostgreSQL. We have shown that when using prepared statements across many concurrent database sessions, you save the same generic query plan being duplicated in memory.
By removing redundant plan storage across sessions, you can run more connections on smaller instances, reducing both operational complexity and costs. For further details on the different plan types see the PostgreSQL documentation on the prepare statement and Amazon Cloudwatch metrics for Amazon Aurora for further details on measuring freeable memory.