AWS Developer Tools Blog
How to Analyze AWS Config Snapshots with ElasticSearch and Kibana
Introduction
In this blog post, I will walk you through a turn-key solution that includes one of our most recently released services, AWS Config. This solution shows how to automate the ingestion of your AWS Config snapshots into the ElasticSearch/Logstash/Kibana (ELK) stack for searching and mapping your AWS environments. Using this functionality, you can do free-form searches, such as “How many EC2 instances are tagged PROD?” or “How many EC2 instances are currently connected to this master security group?”
Prerequisites
In this post, I assume that you have an ELK stack up and running. (Although the “L” isn’t really required, the ELK acronym has stuck, so I’ll continue to use it.)
Here are some ways to get the ELK stack up and running:
- You can use our Amazon ElasticSearch Service, which provides the two main components you’ll be using: ElasticSearch and Kibana.
- Take a look at this excellent post by Logz.io. It provides step-by-step instructions for installing the ELK stack on an EC2 instance.
- You can install Docker locally or create an Amazon EC2 Container Service (Amazon ECS) cluster and then install the ELK Docker image. Follow the instructions here.
You can download the python app referenced in this post from https://github.com/awslabs/aws-config-to-elasticsearch
Why AWS Config?
AWS Config provides a detailed view of your configurations of your AWS resources and their relationships to other resources. For example, you can find out which resources are set up in your default VPC or which Availability Zone has the most EC2 instances. AWS Config also captures the history of configuration changes made to these resources and allows you to look them up through an API. The service allows you to create one-time snapshots or turn on configuration recording, which provides change snapshots and notifications.
Why ELK?
ElasticSearch and Kibana are some of the most popular free, open-source solutions out there to analyze and visualize data. ElasticSearch, which is built on the Lucene search engine, allows for schema-less data ingestion and querying. It provides out-of-the-box data analysis queries and filters, such as data aggregates and term counts. Kibana is the visualization and searching UI that opens up the ElasticSearch data to the regular user.
The Solution
I’ve created a Python app that automates the process of getting AWS Config data from your AWS account to ELK. In short, it asks AWS Config to take a snapshot in each region in which you have the service enabled; waits until the snapshot is uploaded to the configured Amazon S3 bucket; copies the snapshot from the S3 bucket; parses the snapshot (which is just a huge JSON blob); and ingests the JSON array elements into ELK.
Running the Script
You have a couple of options when you run the app. You can specify the region that you want to export and load by including -r and the region name as shown:
./esingest.py –d localhost:9200 –r us-east-1
Or you can simply include the destination (which is required). The app will loop over all of the regions. The following output is an example of what you would see if you don’t specify the region:
./esingest.py –d localhost:9200

Working with Kibana
Now that you have ingested the data into ElasticSearch, you need to use Kibana to index the data. The first time you open Kibana, the Settings page will be displayed. Use this page to configure the searchable index. For simplicity’s sake, under Index name or pattern, type *, and for Time-field name, choose snapshotTimeIso. You can use any date field from the drop-down list, such as resourceCreationTime:
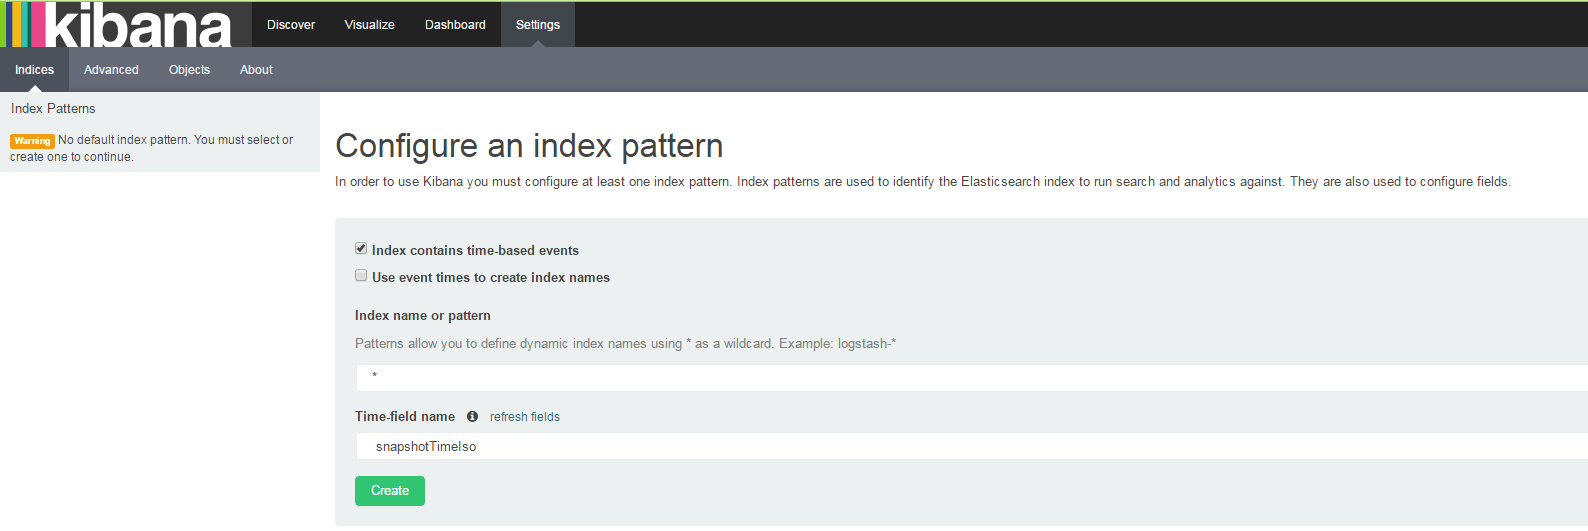
This will index all of your ElasticSearch indices and use the snapshotTimeIso as the time-series field. You will have duplicates if you run esingest without deleting the current ELK indices, but you will be able to include the snapshot time in your search queries to get time-based results.
Now that we have indexed the data in Kibana, let’s do some searching. Choose the Discover tab and change the time filter by clicking the text in the upper-right corner:
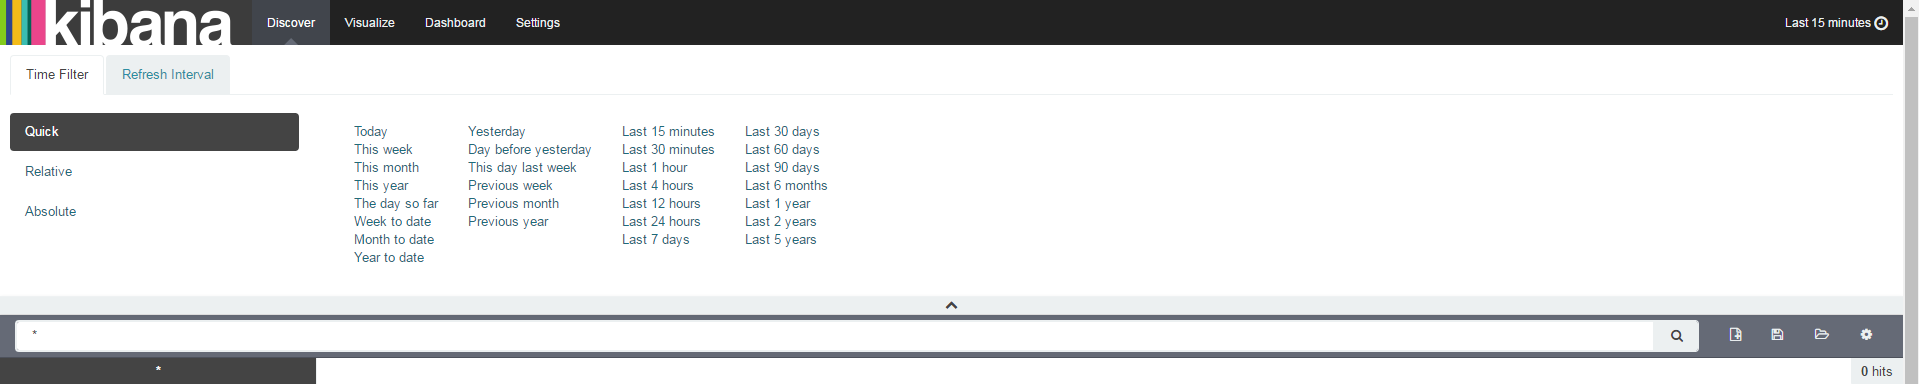
For now, choose Last 5 years, and then minimize the Time Filter section.
For our first search, type resourceType: "aws::ec2::instance" in the text field. You will see all of your EC2 instances in the search results. The time graph shows when they were added to ElasticSearch. Because I ran esingest just once, there’s only one Config snapshot loaded, and only one timestamp will show up.
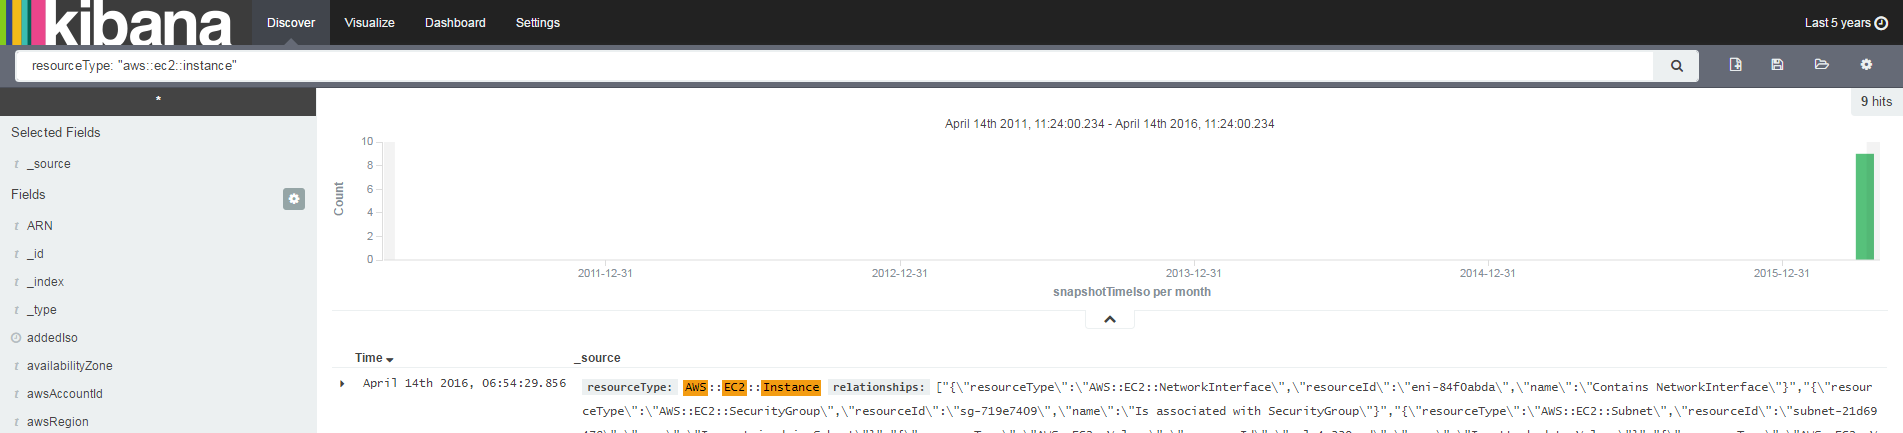
There are many other search queries you can use. Kibana supports the Lucene query syntax, so see this tutorial for examples and ideas.
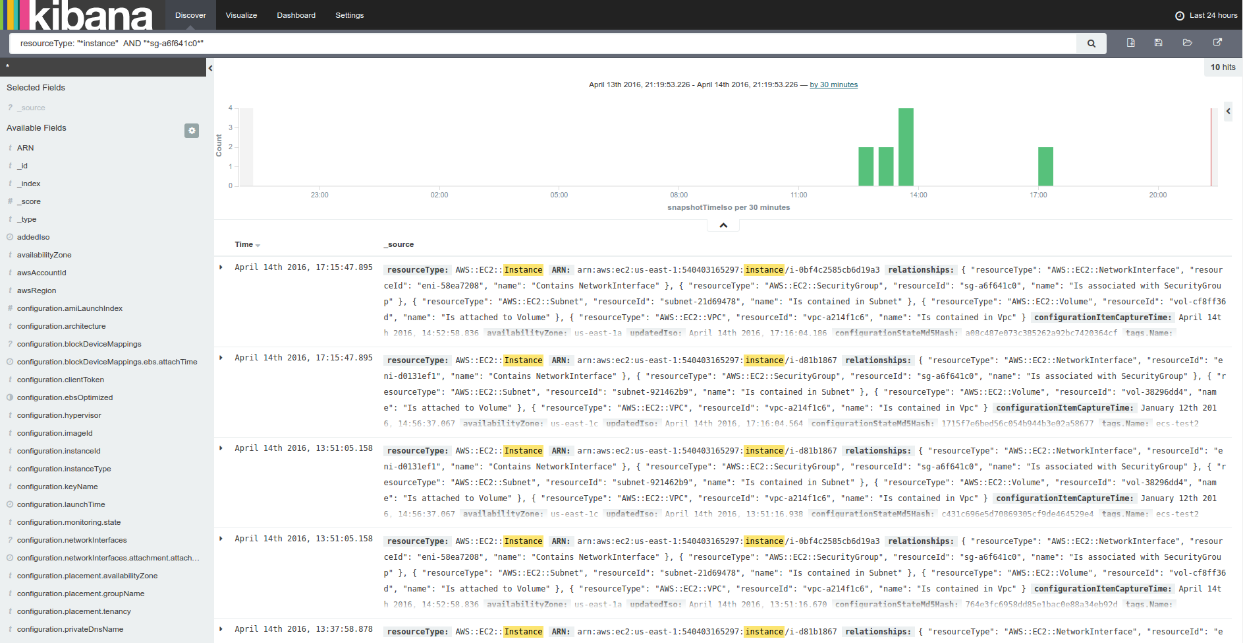
As you can see, the time filter shows when the data was ingested into ElasticSearch. You might have duplicates here, so you can specify the instance ID and the exact snapshot time (input: resourceType: “*Instance*” AND “sg-a6f641c0*”)
Kibana Visualize Functionality
In addition to search functionality, Kibana provides a way to visualize search results and create search slices. Let’s look at some real-world use cases that I’ve encountered while talking to customers. Click the Visualize tab, choose Pie Chart, and start exploring!
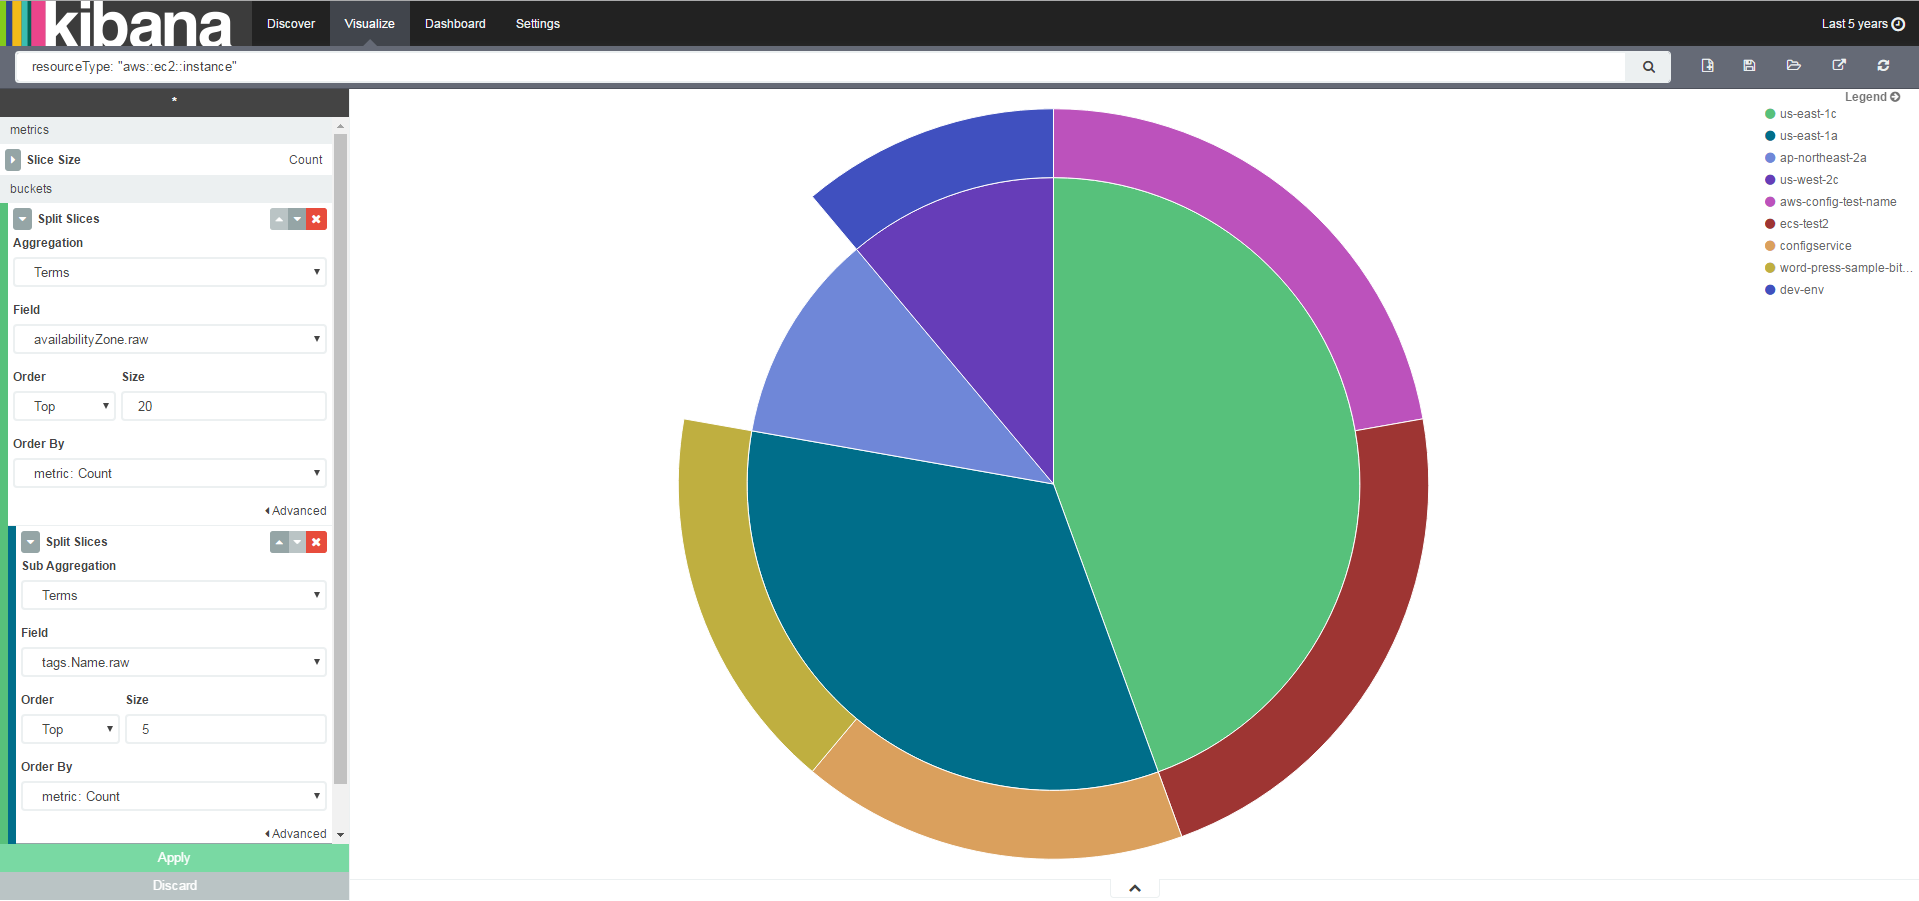
What’s my EC2 distribution between Availability Zones?
Input: resourceType: “aws::ec2::Instance”

Let’s create a sub-aggregation and add the tags that are assigned to those EC2 instances:
Input: resourceType: “aws::ec2::Instance”
Which AMIs were used to create your EC2 instances, and when were they created?
Input: *

How many instances use a security group that you have set up?
Input: “sg-a6f641c0*”

Conclusion
AWS Config is a useful tool for understanding what’s running in your AWS account. The combination of ELK and AWS Config offers AWS admins a lot of advantages that are worth exploring.