AWS Cloud Operations Blog
Building enterprise patching and inventory dashboards using Amazon Q in Amazon QuickSight
In today’s fast-paced IT environment, monitoring and visualizing patching compliance across your infrastructure is crucial. Traditionally, creating comprehensive patching dashboards in Amazon QuickSight has been a manual, time-intensive process requiring multiple steps for each visual component.
Amazon Q in QuickSight is an AI-powered assistant that enhances data analysis and visualization capabilities within Amazon QuickSight. This blog explores how Amazon Q in QuickSight transforms this experience by simplifying dashboard creation through natural language interactions. Learn how you can reduce a multi-step manual process into a few simple prompts, enabling you to quickly generate insightful patching compliance and inventory visualizations. Discover how Amazon Q’s AI-powered capabilities help you create dynamic dashboards, saving valuable time while maintaining accuracy and providing real-time insights into your organization’s patching status. Whether you’re a systems administrator, security analyst, or IT manager, this guide demonstrates how Amazon Q in QuickSight revolutionizes the way you monitor and report on patching compliance and inventory.
Furthermore, this solution provides comprehensive visibility into your infrastructure through custom inventory visualizations. Create graphs to view how your computing resources are spread across cloud providers, AWS drivers, and instance types to better understand your infrastructure distribution.
Solution Overview
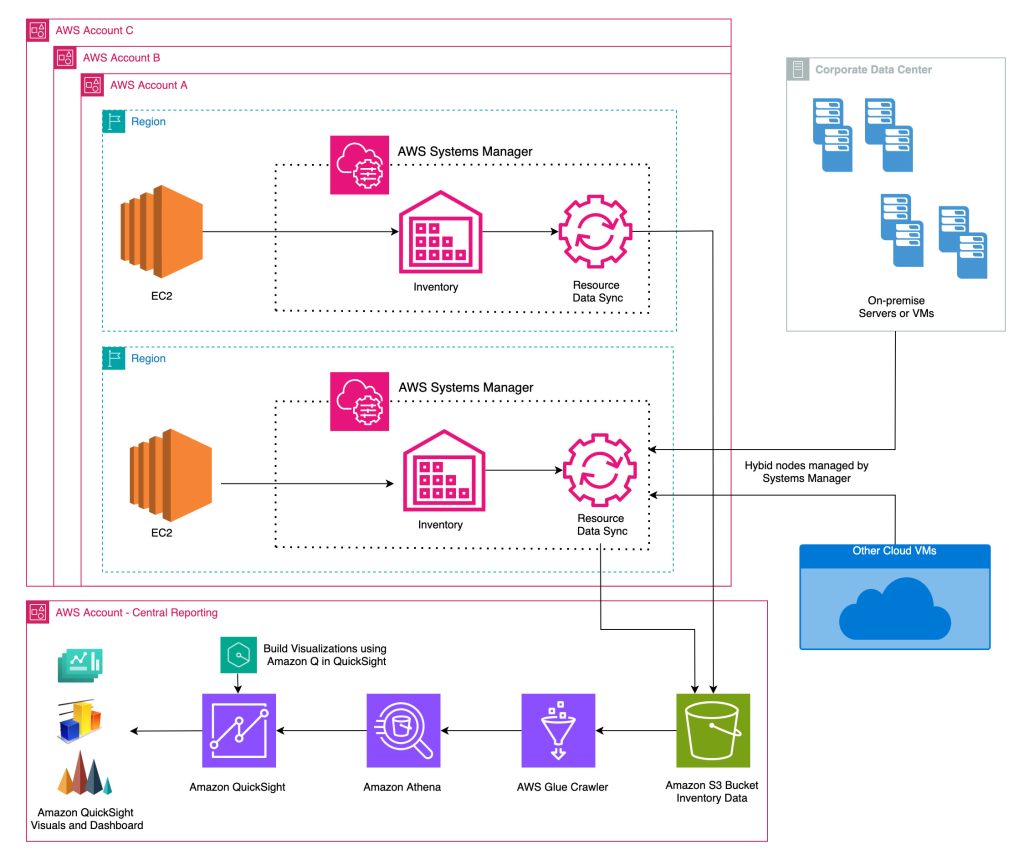
Figure 1 – Architecture diagram
The solution leverages several AWS services to automate the creation of datasets in QuickSight and utilize Amazon Q in QuickSight to visualize the data. A custom script is executed using AWS Systems Manager (SSM) association on each of the target managed nodes which gathers the required inventory information and places it in the custom inventory path. This information is collected with SSM inventory and Resource Data Sync from various AWS accounts in the Organization and saved on the central S3 bucket. This S3 bucket is then crawled with AWS Glue crawler and a Glue database is created. The data from this database is queried using Amazon Athena from QuickSight to create a dataset. Amazon Q in QuickSight is utilized to visualize the data from the QuickSight dataset.
The solution is deployed using AWS CloudFormation stack to create the resources, like Amazon S3 bucket for data storage, AWS Glue database and crawler for data cataloging, AWS CloudFormation StackSet to manage Systems Manager Association, resource data sync and Amazon QuickSight datasets and analysis dashboards. The solution operates on two primary automated schedules: Systems Manager Association executes custom inventory collection every 7 days, and AWS Glue crawler performs data synchronization with Amazon Athena database every 12 hours. Both scheduling intervals can be modified to align with specific organizational requirements.
SSM custom association collects metadata from all managed nodes across cloud providers and on-premises systems to provide the following infrastructure insights:
- Cloud_provider – Information on cloud provider such as AWS or on-premise VMware etc.
- Total_diskspace – Total disk space provisioned
- Free_diskspace – Amount of free disk space available
- Free_space_percent – Percentage of free space available
- Diskspace_status – Disk space status if it is less than 10%
Additionally, it utilizes instance metadata and custom scripts to gather the following information specific to EC2 managed nodes:
- EC2_type – EC2 hypervisor type such xen or nitro-based instances
- Instance_type – Instance type such as on-demand or spot etc.
- NVMe_version – NVMe driver version installed
- ENA_version – ENA driver version installed
- License_type – Licensing information associated with the instance such as Windows License included or BYOL
This information is saved on the custom inventory path on each managed node. The SSM inventory association captures this custom data along with the standard inventory metadata. Resource data sync on each account syncs the inventory metadata to the central S3 bucket.
Prerequisites
For this walkthrough, you must have the following:
- Systems Manager Managed nodes (either Amazon EC2 instance or hybrid nodes to capture custom inventory information).
- Systems Manager Inventory enabled on the accounts.
- Systems Manager patch scan or install operation to patch the managed nodes.
- Amazon QuickSight user account with Admin pro or Author pro
- Required permissions for creating CloudFormation StackSets.
- AWS Organization ID
Walkthrough
We will deploy the solution using AWS CloudFormation Stack to create the required resources. The CloudFormation Stack can be deployed from Organization Management account or StackSet delegated administrator account. The central S3 bucket, QuickSight dashboard and other resources would be created in the stack deployment account and region.
After the deployment, I will walkthrough on creating visuals using Amazon Q in QuickSight.
- Download the CloudFormation template from the GitHub respository and deploy the Stack.
- In the parameters area, enter the following parameters:
- Under the section: SSM Resource Data Sync and Custom inventory configuration
- Amazon S3 bucket: Name of the Amazon S3 bucket used for AWS Systems Manager resource data sync
- Target type: Target type for custom inventory association. Specify ALL for all instances, TAG for tag-based targets and enter the tag key and value in next parameter
- Tag key for targeting instances
- Tag value for targeting instances
- Under the section: AWS Accounts Options:
- AWS Organization ID: AWS Organization root ID (r-xxx) or Organization Unit ID (ou-xxx).
- AWS Account IDs: List of AWS Accounts IDs to be deployed in the Organization or OU. (Accounts must be member of the specified Org/OU). Leave empty to deploy to all accounts in the Organization or OU.
- AWS Account Regions: List of AWS Regions
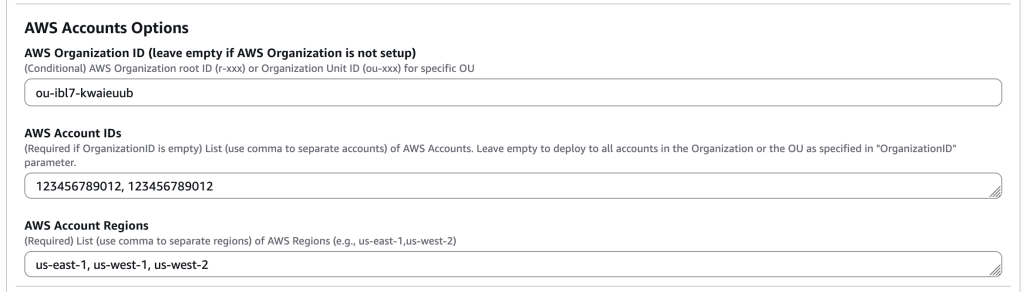
Figure 2 – AWS CloudFormation parameters – Organization deployment
To deploy to accounts without Organization setup:
- AWS Organization ID: Leave the field empty
- AWS Account IDs: List of AWS Accounts IDs to be deployed (Accounts must not be part of any Organization)
- AWS Account Regions: List of AWS Regions
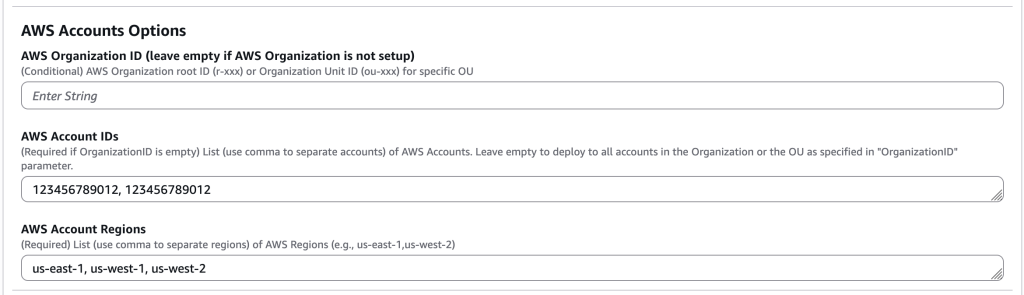
Figure 3 – AWS CloudFormation parameters for accounts not part of Organization
- Under the section: Amazon Athena
- Amazon Athena Database Name: Amazon Athena Database name for AWS Systems Manager resource data sync
- Under the section: Amazon QuickSight
- Amazon QuickSight user: Enter the Amazon QuickSight username.
- Under the section: SSM Resource Data Sync and Custom inventory configuration
- Navigate to Resources tab to view the resources created by the CloudFormation Stack.
After the CloudFormation deployment completes, wait for the SSM Inventory Association on the accounts to complete the execution. By default, Inventory association runs every 30 minutes. Once the inventory execution is complete, follow the steps to run the Glue Crawler:
- Navigate to AWS Glue Crawlers console
- Choose the crawler which starts with “SSM-GlueCrawler-*”
- Choose Run to run the crawler.
The Glue Crawler will crawl the Inventory data from central S3 bucket and updates on the Glue database ssm_datasync_resources.
Validate QuickSight user and permissions
QuickSight User Role:
- Navigate to Amazon QuickSight console and sign in
- Choose the user icon on top right and Manage QuickSight
- Choose Manage users and choose the role Admin Pro for the QuickSight user
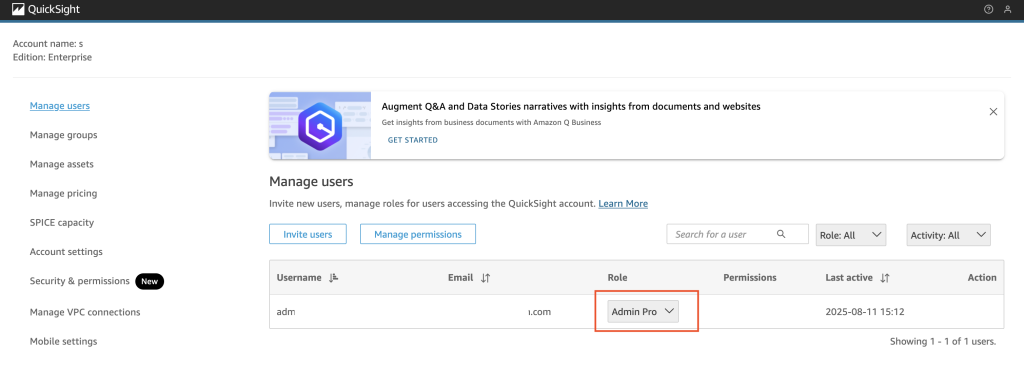
Figure 4 – Amazon QuickSight user permissions
QuickSight permissions:
- On the same page, choose Security & Permissions
- Under QuickSight access to AWS services, choose Manage
- Choose Amazon Athena and Amazon S3. Under Select S3 buckets, select the S3 bucket created by the CloudFormation template deployed earlier for Systems Manager inventory and patching data.
- Choose Save.
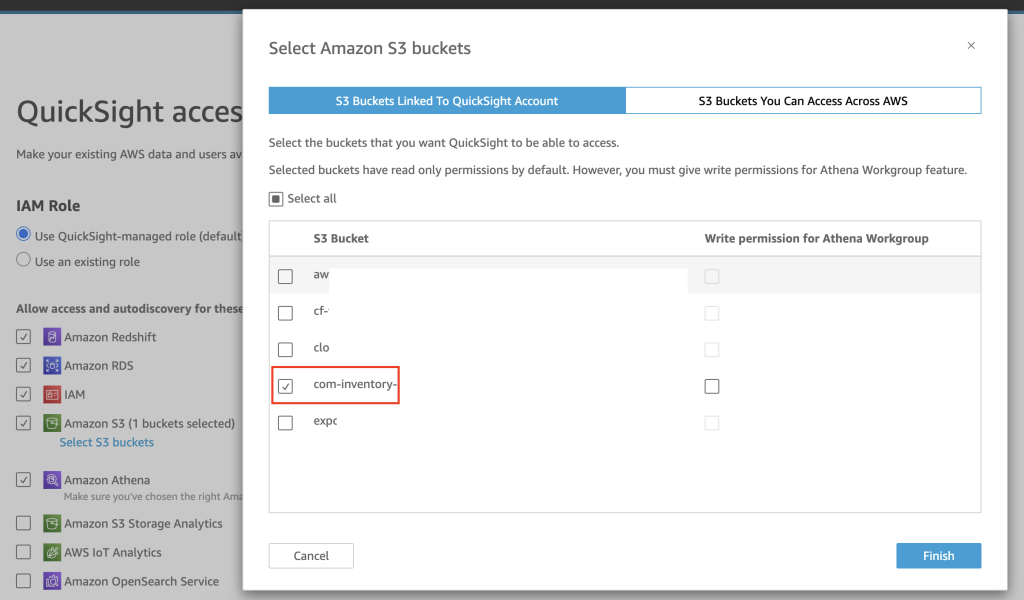
Figure 5 – QuickSight role permissions to S3 bucket
Create Visuals using Amazon Q
- In the QuickSight Analysis, choose Build Visual icon on the top center of the page. This opens a side panel to enter the query for Amazon Q to build the visual.
- Following are the example prompts to generate the visuals. You can consider customizing the prompts and visuals as required.
Managed node by Provider
These visual displays the number of managed nodes deployed across different cloud providers and on-premise infrastructure, giving insights into the distribution of workloads across platforms.
- Enter the prompt as “Create a pie chart for count of resourceid by provider” and choose BUILD.
- Alternatively, you can enter the prompt as “Create a visual for count of resourceid by provider” to let Amazon Q decide on the visual type.
- Amazon Q in QuickSight will generate the visual. Choose Add to Analysis and resize the visual as per the requirement.
- Double-click on the heading to edit and update to “Managed Node by Provider”
Figure 6 – Build visual using Amazon Q in QuickSight
Managed node by Status
- Enter the prompt as “Create a donut chart for count of resourceid by instancestatus” and choose BUILD.
- Choose Add to Analysis and resize the visual as per the requirement. Update the visual heading.
- Follow the same steps for the other visuals as described below with different prompts to generate visuals.
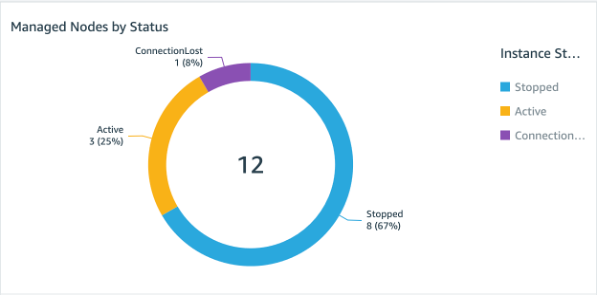
Figure 7 – Managed node by status
Managed node by OS
Prompt “Create a donut chart for count of resourceid by platformname”
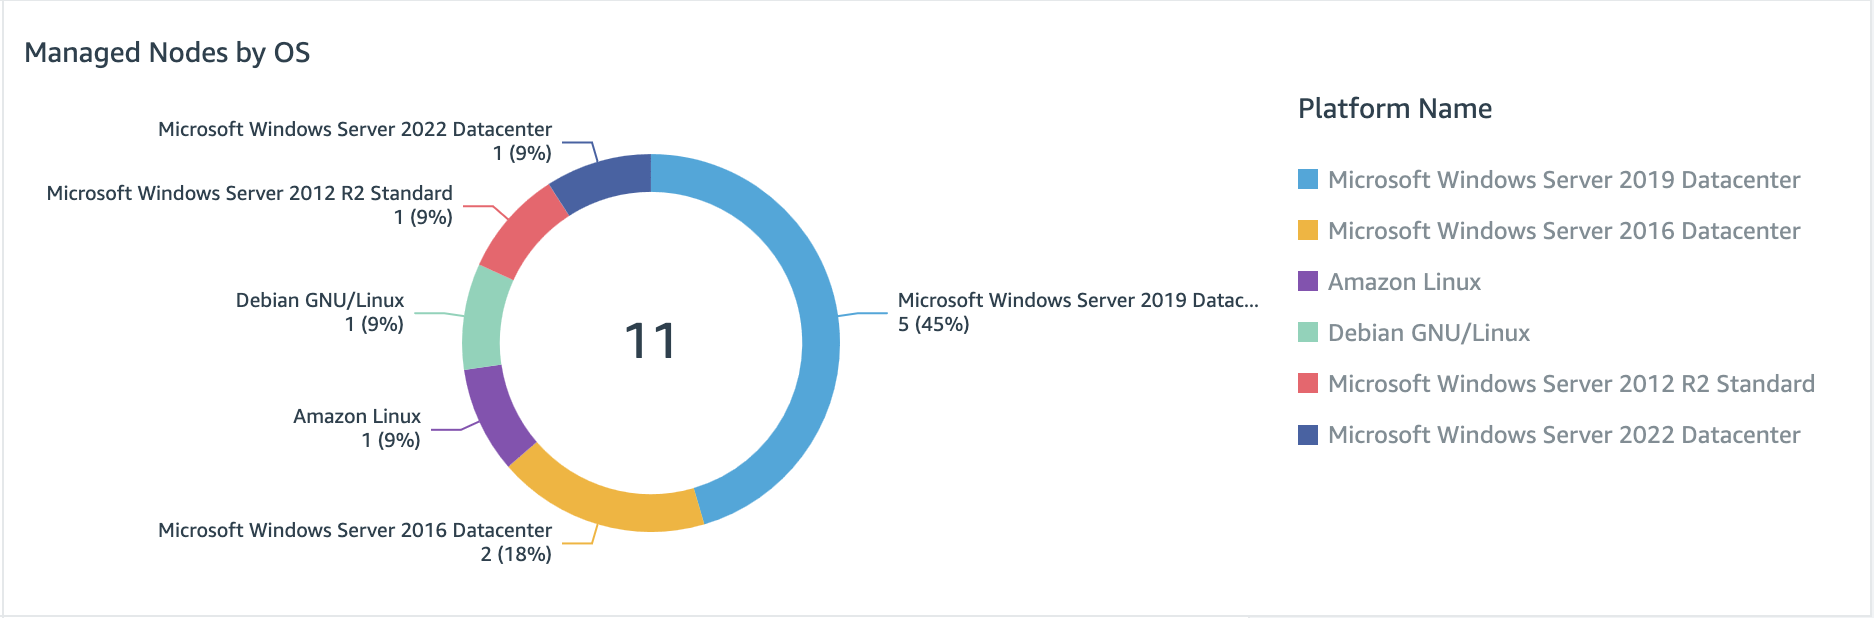
Figure 8 – Managed node by OS
Managed node by Platform
Prompt “Create a donut chart for count of resourceid by platformtype”
SSM Agent version
Prompt “Create a visual for count of resourceid by version and application name equals Amazon SSM Agent”
Disk space status
Prompt “Create a visual for count of resourceid by diskspacestatus”
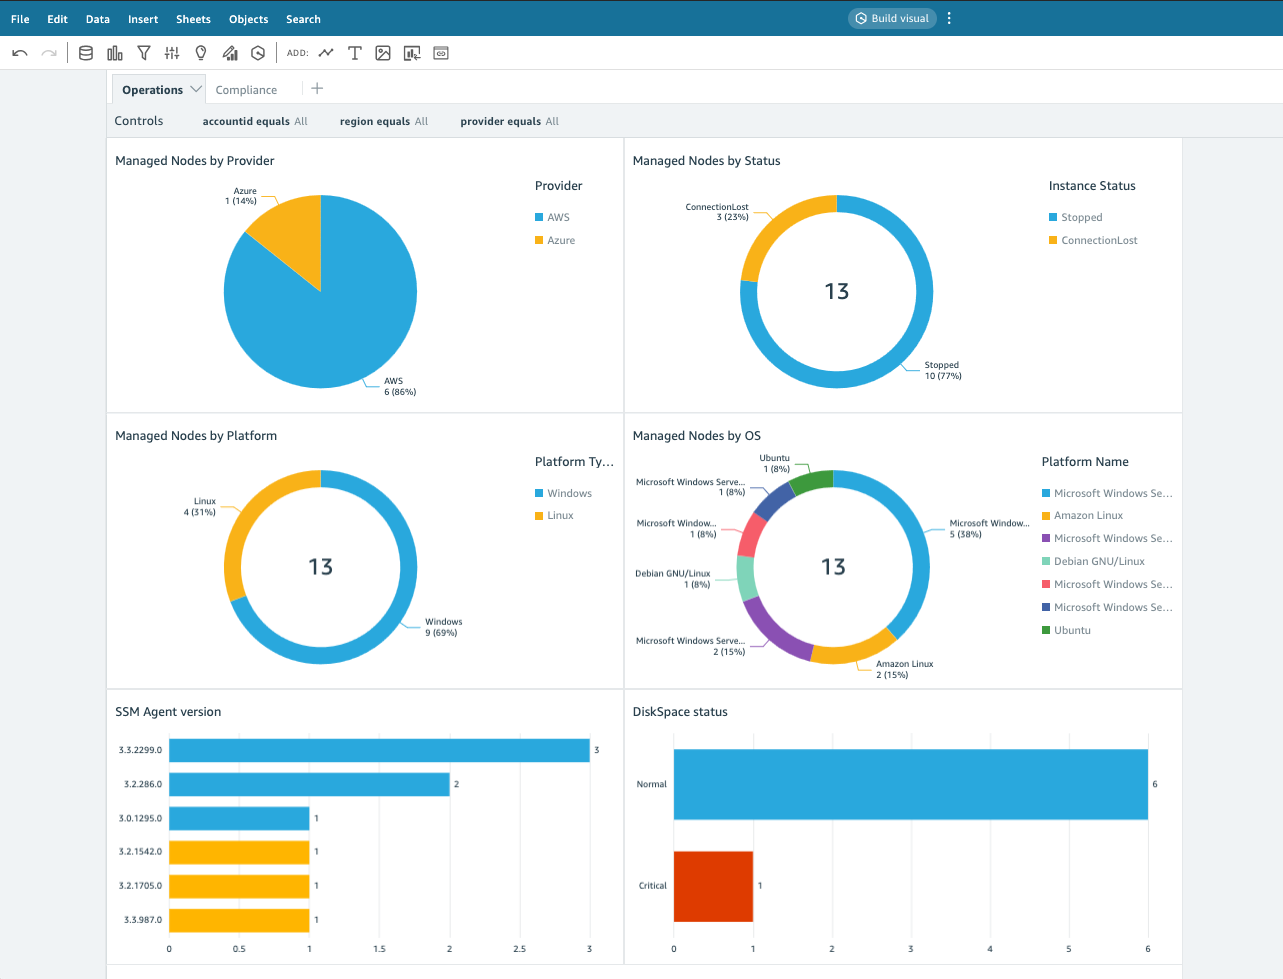
Figure 9 – Operations Dashboard
Amazon EC2 instances specific visuals
The following visuals showcase detailed information about Amazon EC2 instances, derived from SSM custom inventory association, providing valuable insights into various AWS-specific components and resource configurations.
Following are the prompts to create the visuals:
AWS PV Driver versions
- Prompt “Create a visual for count of resourceid by application version and application name equals AWS PV Drivers”
- Choose null or empty data from the visual and choose Exclude null. Choose Add to Analysis to add the visual to the analysis. This is to exclude the null/empty values from other providers (such as on-prem or hybrid nodes) which are not applicable for this visual.
- To add a text heading in the dashboard, choose Add Text icon from the top of the pane and edit to AWS Dashboard.
Amazon EC2 ENA Driver versions
Prompt “Create a visual for count of resourceid by enaversion”.
AWS NVMe Driver versions
Prompt “Create a visual for count of resourceid by nvmeversion”.
Amazon EC2 Instances by License Type
Prompt “Create a pie chart for count of resourceid by licensetype”.
Amazon EC2 Instances by Instance type
Prompt “Create a pie chart for count of resourceid by instancetype”.
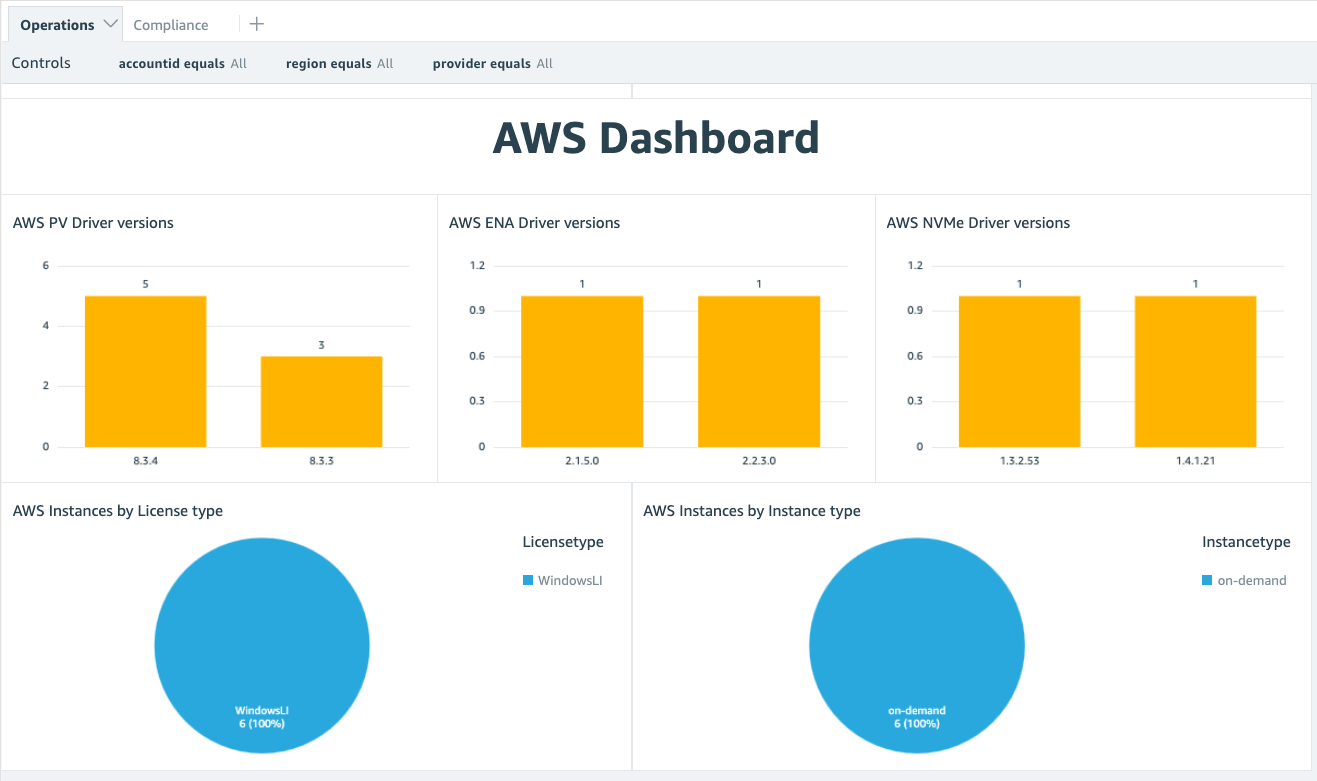
Figure 10 – AWS EC2 metrics dashboard
Compliance Sheet
The compliance sheet is utilized to create compliance specific visualizations, particularly focusing on patch and association compliance. In this case, we are generating visuals that highlight non-compliant patches and also provide comprehensive list of missing patches, offering a clear overview of the system’s security posture.
- From the top of the sheet, choose Compliance sheet
- Following are the prompt examples for compliance specific visuals.
Managed Nodes by Patch Compliance
Prompt “create a pie chart for count of resourceid by compliance status for compliancetype equals Patch”
Managed Nodes by Association Compliance
Prompt “create a pie chart for count of resourceid by compliance status for compliancetype equals Association”
Patch Compliant Managed Nodes by Provider
Prompt “create a donut chart for count of resourceid by provider for compliancetype equals Patch and compliance status equal COMPLIANT”
Patch Non-Compliant Managed Nodes by Provider
Prompt “create a donut chart for count of resourceid by provider for compliancetype equals Patch and compliance status equal NON_COMPLIANT”
Patch Compliant Managed Nodes by OS
Prompt “create a visual for count of resourceid by platformname for compliancetype equals Patch and compliance status equal COMPLIANT”
Patch Non-Compliant Managed Nodes by OS
Prompt “create a visual for count of resourceid by platformname for compliancetype equals Patch and compliance status equal NON_COMPLIANT”
Missing patches
Prompt “create a pivot table with provider, accountid, region, platformname, resourceid, patch title for compliancetype equals Patch and compliance status equal NON_COMPLIANT and patch status equal Missing”
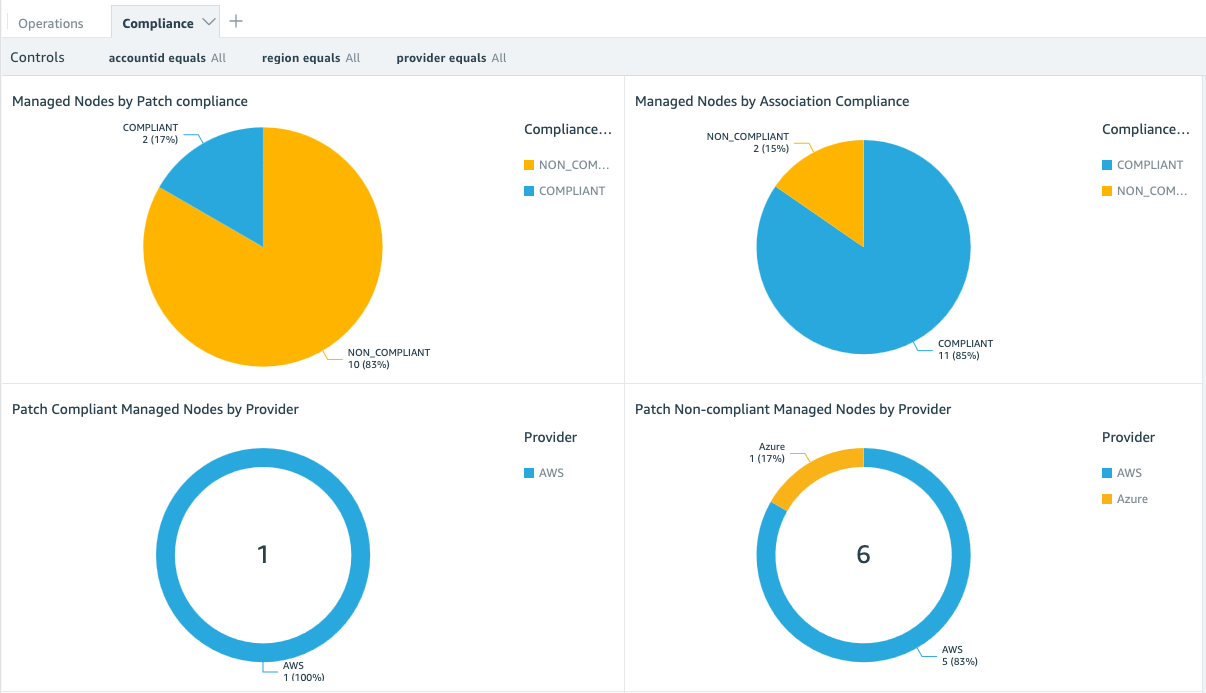
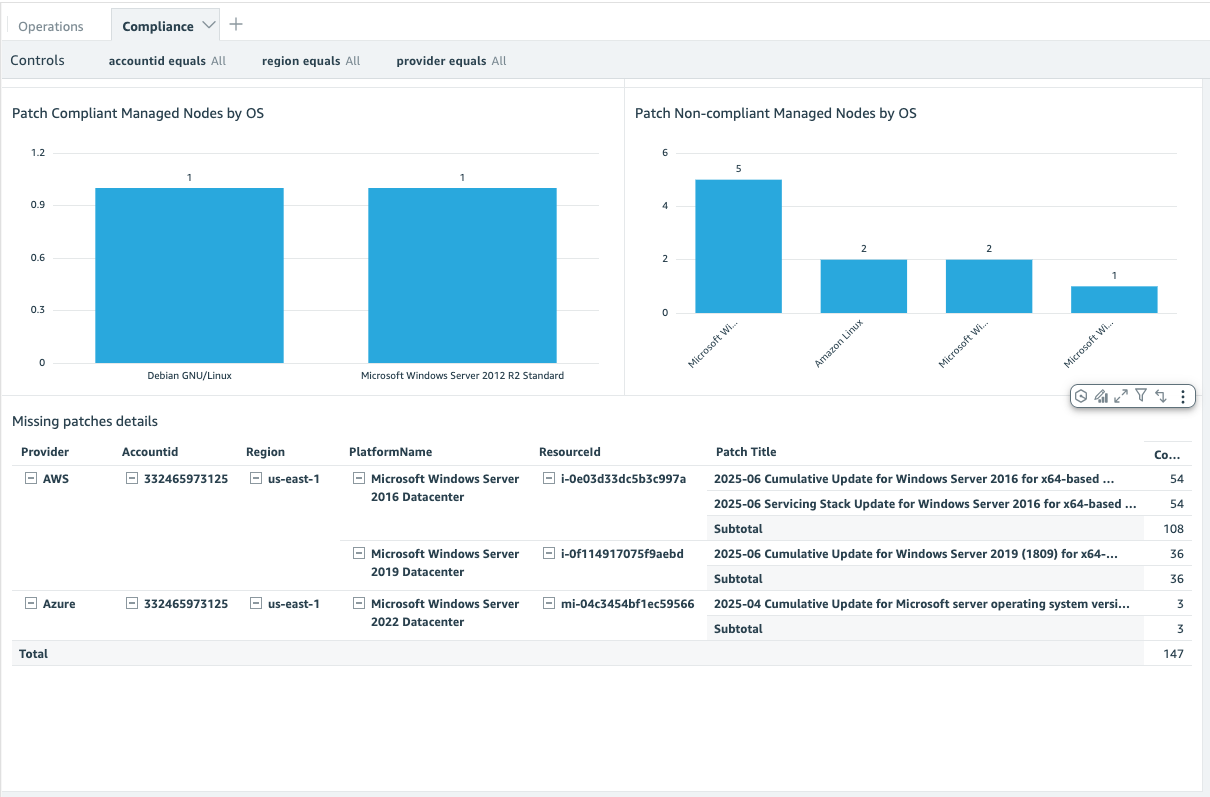
Figure 11 – Compliance Dashboard
Once the visuals are created, choose Publish to publish the dashboard. Additionally, you can also leverage Amazon Q in QuickSight to get the detailed information or to interact with the dashboard to get answers for any questions. For example, to get the list of managed nodes with critical disk space, the prompt “List of resourceid by diskspacestatus equal Critical” can get the answer.
Cleanup
To delete the resources:
- Navigate to the AWS CloudFormation console
- Choose Stacks and choose stack named ssm-inventory-patching-dashboard.
- Choose Delete and Delete stack.
- Navigate to Amazon QuickSight console
- Delete the Dashboard, Analyses and the Dataset.
Conclusion
In this blog post, we demonstrated how Amazon Q in QuickSight simplifies the creation of Systems Manager patching and inventory dashboards. By leveraging natural language interactions, what was once a complex, multi-step process has been transformed into simple, intuitive prompts that generate comprehensive visualizations. This solution saves valuable time and also provides real-time insights into patching compliance, inventory status, and infrastructure distribution across cloud and on-premises environments.
Furthermore, Amazon Q in QuickSight enables interactive querying of your dashboard data through natural language prompts, allowing you to quickly retrieve specific information. The combination of AWS services, including Systems Manager, QuickSight, and Amazon Q, enables organizations to maintain better control over their hybrid infrastructure while simplifying the monitoring and reporting process. Whether you’re managing patch compliance, tracking inventory, or monitoring AWS-specific components, this solution offers a streamlined approach to infrastructure visualization and management. Transform your infrastructure monitoring today by downloading our CloudFormation template and implementing AI-powered visualizations in minutes.
To learn more about AWS Systems Manager patching capabilities, visit our AWS Systems Manager Patch Manager documentation.