AWS Cloud Operations Blog
How Amazon Achieved Full Stack Observability Across 400 Offices with Amazon OpenSearch Serverless
Summary
Amazon Corporate Infrastructure Services (CIS) supports 330,000+ employees across 400 offices in 50+ countries. Every day, these employees depend on critical services including video conferencing (Zoom, Webex, Teams), collaboration tools (Slack, Microsoft M365), audiovisual systems, guest Wi-Fi, and ServiceNow for seamless productivity. Before we implemented the Full Stack Observability (FSO) platform, individual teams had built domain-specific monitoring solutions optimized for their needs. This approach worked at the team level. However, it created significant operational challenges:
- Fragmented visibility across domains
- Correlating signals across systems required manual effort and incomplete knowledge
- Issues were detected only after users reported problems
- Mean Time to Detect (MTTD) and Mean Time to Resolve (MTTR) suffered due to data silos
As Amazon’s global workforce, network, and supported applications grew, the complexity of monitoring increased.
To address these challenges, Amazon CIS built a comprehensive Full Stack Observability (FSO) platform using Amazon OpenSearch Serverless, integrated that with external and internal systems for visibility, including Cisco ThousandEyes for network monitoring, Zoom for meeting experience, and internal change management systems, to name a few. The impact includes thousands of engineering hours saved annually through automated monitoring and correlation, a 5-minute target MTTD enabling proactive issue detection before user impact, 99.9% platform uptime ensuring continuous visibility into critical infrastructure, and 500+ active users accelerating their investigations with data. This post shares the technical architecture, implementation approach, and lessons learned from building enterprise-scale observability on AWS.
The Challenge
Amazon’s rapid growth created several observability challenges that directly affected workforce productivity and IT operational efficiency. There were data silos across domains. Audio/Visual (AV) hardware teams monitored Cisco Codecs and conferencing equipment, network teams tracked WiFi, VPN, and circuit health, application teams monitored M365, Zoom, Webex, Teams, and Slack, while ServiceNow tracked incidents but lacked infrastructure context. For example, when a conference room codec repeatedly failed to join Zoom meetings, ServiceNow surfaced the symptom. However, it had no visibility into the upstream network access point experiencing packet loss from a recent QoS policy change, nor could it correlate the five other meeting-failure tickets from the same floor that shared the same root cause. If you’ve ever had to check 8–12 different dashboards to correlate a single incident, you know the pain. Our engineers were manually correlating timestamps and events, contacting multiple teams to gather context, and piecing together the root cause across disconnected tools. Monitoring was reactive. Issues were only caught when users filed tickets, not before impact. There were no predictive analytics to detect degrading services, and no established baselines for proactive alerting. Each new office required manual configuration across multiple tools with a lack of standardized deployment model for monitoring agents, creating a growing operational overhead with each site addition. These challenges resulted in high support ticket volumes, extended incident resolution times affecting employee experience, reactive firefighting instead of strategic service improvements, and low customer satisfaction (CSAT) scores. This scenario required a fundamental architectural shift to centralized, full-stack observability.
Solution Overview: The Full Stack Observability Platform Architecture
The FSO solution was built on six core design principles:
- Secure by Design (protect Amazon infrastructure, users, and data)
- AWS First (use AWS managed services wherever possible)
- Buy, Borrow, then Build (accelerate time-to-market)
- Simplicity (minimize components and dependencies)
- Frugality (maximize business value while minimizing technology)
- Open Standards (use open standards and open-source components for flexibility).
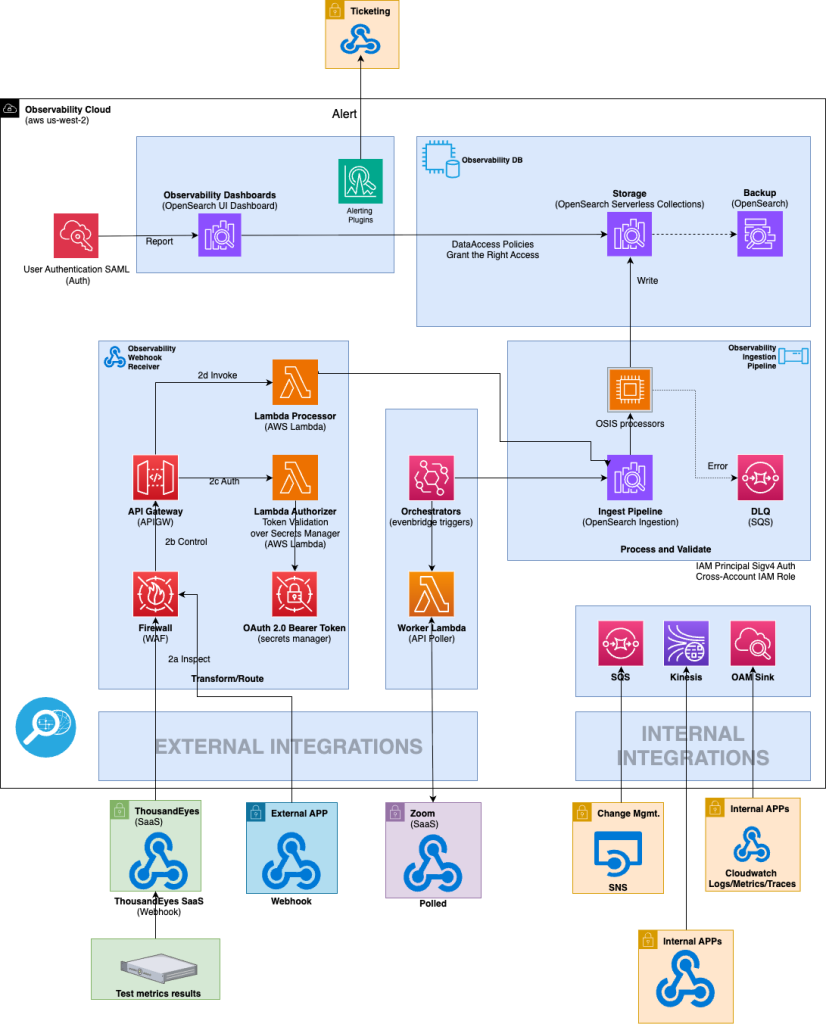
Because we chose AWS managed services, we focused on creating repeatable patterns for onboarding new data sources instead of managing infrastructure. The platform consists of three logical layers:
Data Sources (Integrations Layer): Multiple telemetry sources feed into the platform through generalized interfaces offering clients the ability to choose from webhooks to event streaming to even CloudWatch logs to send data across to FSO.
Data Processing & Storage (Platform Layer): Amazon OpenSearch Serverless eliminates operational complexity in this layer. The FSO Pipeline, built on Amazon OpenSearch Ingestion (OSIS), handles all data normalization, transformation, enrichment, and routing. OSIS processors normalize input data formats, apply transformations, and handle data quality issues. You don’t manage servers or scaling logic.
Amazon OpenSearch Serverless collections provide the core storage and analytics engine. The platform uses time-series collection types optimized for metrics data, with automatic indexing and search compute scaling based on workload. Amazon OpenSearch Serverless handles the operational complexity, including:
- Multi-AZ replication for high availability
- Automatic backup to Amazon Simple Storage Service (Amazon S3)
- Storage tiering (hot/warm/cold)
- Index lifecycle management
- Capacity scaling
You never provision clusters, tune for performance, or manage upgrades.
Error handling is built into the architecture with Dead Letter Queues (DLQ) on Amazon Simple Queue Service (SQS) capturing failed messages for retry and investigation. CloudWatch complements this by providing granular operational visibility. For example, custom metrics track message processing latency and DLQ depth over time, while CloudWatch Alarms trigger automated notifications when failed message counts exceed defined thresholds. CloudWatch Logs Insights enables teams to query and correlate log data across distributed components, accelerating root cause analysis when failures occur.
Amazon OpenSearch Serverless also allows for fine grained access control along with targeted data access policies, ensuring principles of least privilege where needed.
Insights & Alerting (Consumption Layer): FSO Dashboards, powered by the native OpenSearch UI Dashboard, provide rich, interactive visualizations without requiring separate visualization infrastructure. Users authenticate through Security Assertion Markup Language (SAML) and immediately access pre-built dashboards showing network health, application performance, and service availability across all monitored sites. The OpenSearch Dashboards alerting engine monitors thresholds and triggers notifications automatically.
For teams that prefer Grafana, you can use AWS Managed Grafana with Amazon OpenSearch Serverless as a data source. This provides an alternative visualization layer with the same underlying data.
The Key Advantage: Focus on Patterns, Not Plumbing. Amazon OpenSearch Ingestion manages pipelines, data transformations, storage redundancy, backup, security, and scaling automatically. This frees you to focus entirely on creating repeatable ingestion patterns. This pattern-based approach enabled rapid expansion from 3 pilot sites to 24 sites in Phase 1, with a clear path to 400 sites globally, all using the same foundational architecture.
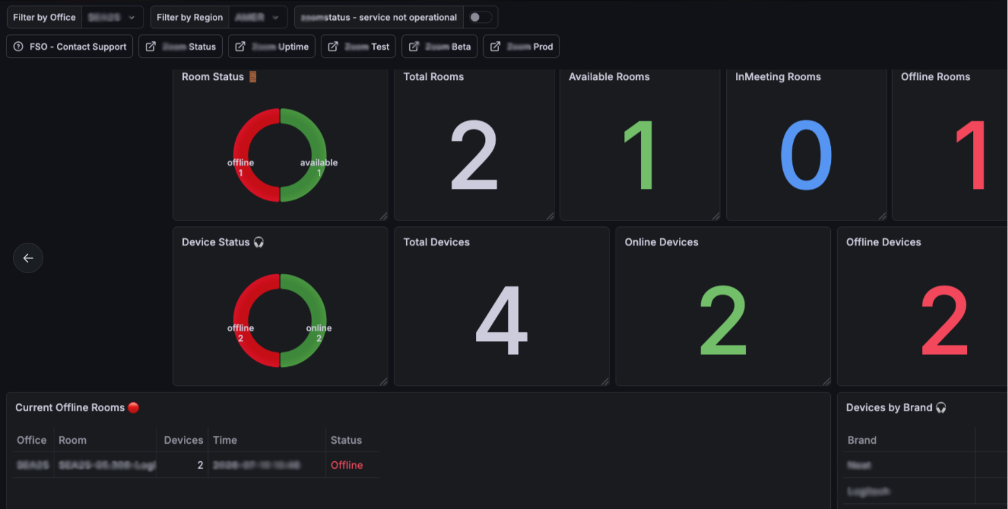
The Final Product: The screenshot below shows a view of a dashboard, monitoring availability for critical AV engineering teams, weaving data from multiple offices and vendor platforms into a single pane.
Key Lessons Learned: From Pilot to Enterprise Scale
Amazon’s FSO journey from 3 pilot sites to 400 global offices revealed critical insights that can guide other organizations building similar enterprise observability platforms. These lessons combine strategic principles with practical implementation guidance.
Lesson 1: Start with Clear Business Outcomes
Don’t build observability for observability’s sake. Tie metrics to business impact (MTTD, MTTR, CSAT, cost savings) and get executive sponsorship with clear ROI targets.
The Journey: Before building anything, the FSO team spent time assessing the current state. They evaluated existing tools, measured baseline MTTD (30-60 minutes-depending on the source, signal mechanism, and cost to probe) and MTTR, identified data silos across network, application, and infrastructure teams, and documented it. We captured:
- Baseline support ticket volume by service
- Time spent on manual correlation (hundreds of hours monthly)
- The number of dashboards operators had to check (8–12 different tools)
- Current monitoring costs
- Service availability metrics
This assessment created the business case. We projected a 220% annual Return On Investment (ROI) through engineering time and customer productivity savings alone, which justified the initial platform investment.
Lesson 2: Embrace Open Standards
OpenTelemetry’s open standards ensure flexibility and long-term adaptability for any observability solution. Avoid vendor lock-in with proprietary formats and make it easier to integrate new data sources over time.
The Journey: We standardized on OpenTelemetry from day one. Each new data source integration became faster. What took weeks for the first integration took hours by the tenth.
Lesson 3: Design for Scale from Day One
Don’t optimize prematurely, but plan for growth. Use managed services that auto-scale (API Gateway, Lambda) and build automation from the start (Infrastructure as Code, CI/CD).
The Journey: When choosing the technology stack, we evaluated on these criteria:
- Managed vs. self-managed operational overhead — fully managed won
- Open standards support — OpenTelemetry was non-negotiable
- Native AWS integration — service-to-service communication without custom glue
- Scalability and performance — must handle 400+ sites without re-architecture
- Cost model — consumption-based pricing preferred over per-host licensing
- Feature completeness — dashboards, alerts, and ML capabilities built in
Infrastructure as Code (AWS Cloud Development Kit (CDK)) makes expansion repeatable and consistent.
Lesson 4: Start Small, Think Big
Pilot with representative sites, prove the model, then scale incrementally based on lessons learned.
The Journey: We followed a disciplined pilot approach:
- Selected 3 representative sites across different regions
- Chose 3–4 critical services to monitor
- Deployed in 30–60 days with Minimum Viable Product (MVP) features (basic ingestion, dashboards, alerting)
- Measured results against baseline (achieved 83% MTTD reduction in pilot)
- Iterated based on feedback from operations teams
- Expanded incrementally
This approach de-risked the investment. If the pilot failed; the cost was minimal. When it succeeded, the business case for expansion was undeniable.
Lesson 5: Invest in Data Quality
Normalize data at ingestion time, enrich with business context (site, region, service owner), and validate and cleanse to prevent “garbage in, garbage out.”
The Journey: Every data source went through the same quality pipeline including validate schema, normalizing timestamps, enriching context, and route to appropriate collection. Because we invested in data quality up front, dashboards were immediately useful. Teams didn’t have to wade through inconsistent or incomplete data.
Lesson 6: Balance Alerting and Noise
Make dashboards self-service, add conservative alert thresholds then tune, implement intelligent correlation and suppression, iterate based on operator feedback, aim for zero false positives, make dashboards self-service.
The Journey: Initial alert thresholds were intentionally conservative to avoid alert fatigue. Real world tuning resulted in high operator trust. When an FSO alert fired, teams knew it was real.
Lesson 7: Enable Self-Service
Give operations teams direct dashboard access, provide training and documentation, build templates for common queries, and empower teams to answer their own questions.
The Journey: Rather than creating a centralized “observability team” that answered all questions, we built self-service capabilities. Operations teams got direct dashboard access with role-based permissions through the fine-grained access controls built into Amazon OpenSearch Serverless.
Conclusion
The FSO platform, anchored by Amazon OpenSearch Serverless and guided by clear design principles, transformed CIS operations from reactive firefighting to proactive detection and remediation. Equally important are the lessons this journey reinforced.
If you’re facing similar observability fragmentation at scale, the CIS FSO journey offers a replicable model:
- Start with business outcomes
- Build on managed services and open standards
- Prove value quickly through focused pilots
- Scale through repeatable patterns
Ready to get started? Explore the Amazon OpenSearch Serverless documentation or learn more about Amazon OpenSearch Ingestion to build your own observability platform.