AWS Cloud Operations Blog
How to monitor hybrid environments with AWS services
As enterprises start migrating to the cloud, one challenge they will face is framing and implementing a holistic monitoring strategy for the hybrid environment. In our experience, there are three main reasons for this. First and foremost, an enterprise generally has multiple monitoring tools in place, but when the enterprises start moving to the cloud, they quickly realize that those tools cannot meet the requirements of cloud-native applications and workloads. Second, the cost and licensing of supporting multiple tools forces enterprises to step back, investigate their monitoring ecosystem, and consolidate. Third, enterprises are unaware that AWS tools and services can be utilized to monitor hybrid and on-premises environments.
There’s a misconception that AWS tools can only monitor AWS environments, and that they cannot support hybrid and on-premises workloads monitoring. This exacerbates the pain points mentioned in the first two points above, as AWS monitoring tools can help enterprises define their monitoring strategy, and in some cases even complement the existing tools and technologies. This post will describe how enterprises can leverage AWS tools and services to monitor their hybrid environment.
Monitoring scenario
In this post, we’ll demonstrate the following:
- Setup required to enable monitoring in a hybrid environment.
- Monitor an application in an on-premises VM (Linux based).
- Send the logs and metrics from on-premises environment to AWS.
- Consolidate the on-premises metrics and logs with AWS data in order to provide a single pane of glass for monitoring.
This post does not show all of the possible use-cases for hybrid monitoring. Instead, we will showcase the capability of AWS services for monitoring a hybrid and/or on-premises environment so that you can get familiar with these capabilities and utilize them as you define your monitoring strategy.
Overview of AWS Monitoring tools and services
The key services for monitoring on-premise environments are as follows:
Amazon CloudWatch
Amazon CloudWatch is a service that lets you monitor AWS and on-premises environments in real time, including resources and applications. Utilize Amazon CloudWatch to collect and track metrics, collect and monitor log files, set alarms, and create dashboards. Get more details about the service here.
AWS X-Ray
AWS X-Ray complements Amazon CloudWatch by helping developers analyze and debug distributed applications, such as those built with a microservices architecture. AWS X-Ray provides insights into how your application and its underlying services are performing in order to identify and troubleshoot the root cause of performance issues and errors. AWS X-Ray provides an end-to-end view of requests as they travel through your application, as well as a map of your application’s underlying components. For more information about AWS X-Ray, refer here.
AWS Systems Manager (SSM)
AWS Systems Manager acts as the operational hub for your hybrid environment. It lets you manage servers in your environment across AWS (EC2 instances), as well as on-premises. Utilize SSM to install and update agents, such as the CloudWatch agent, across your entire server fleet without having to do so individually per server. Read about AWS Systems Manager here.
Environment Setup
This section describes the steps you must take to enable monitoring.
Configuring SSM agent and the CloudWatch agent
These are the steps you must follow in order to install and configure SSM and the CloudWatch agents in your on-premises environment:
- Create an IAM role named SSMServiceRole with ‘AmazonSSMManagedInstanceCore‘ and ‘CloudWatchFullAccess‘ AWS managed policies, as well as the following trust policy:
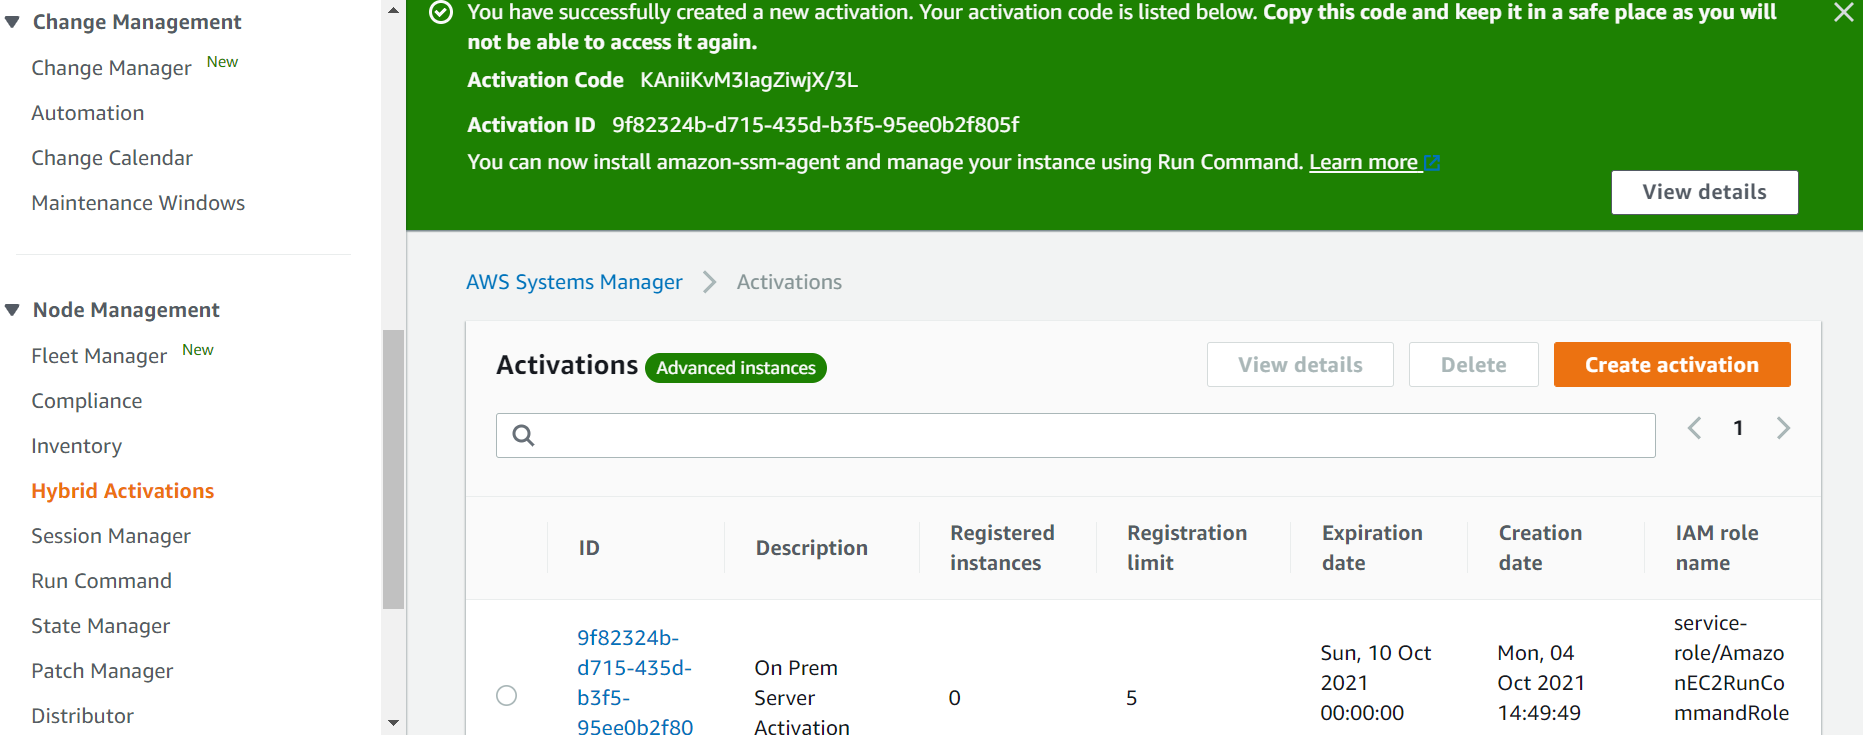
- Create a new Hybrid Activation using SSM Manager, which provides you with the Activation Key and Activation code (see image below). Either use the role created above or the default role that SSM creates for you (AmazonEC2RunCommandRoleForManagedInstances).
- Install and run SSM agent on on-premises servers. Register the server with SSM, and start the agent, by using the following commands:
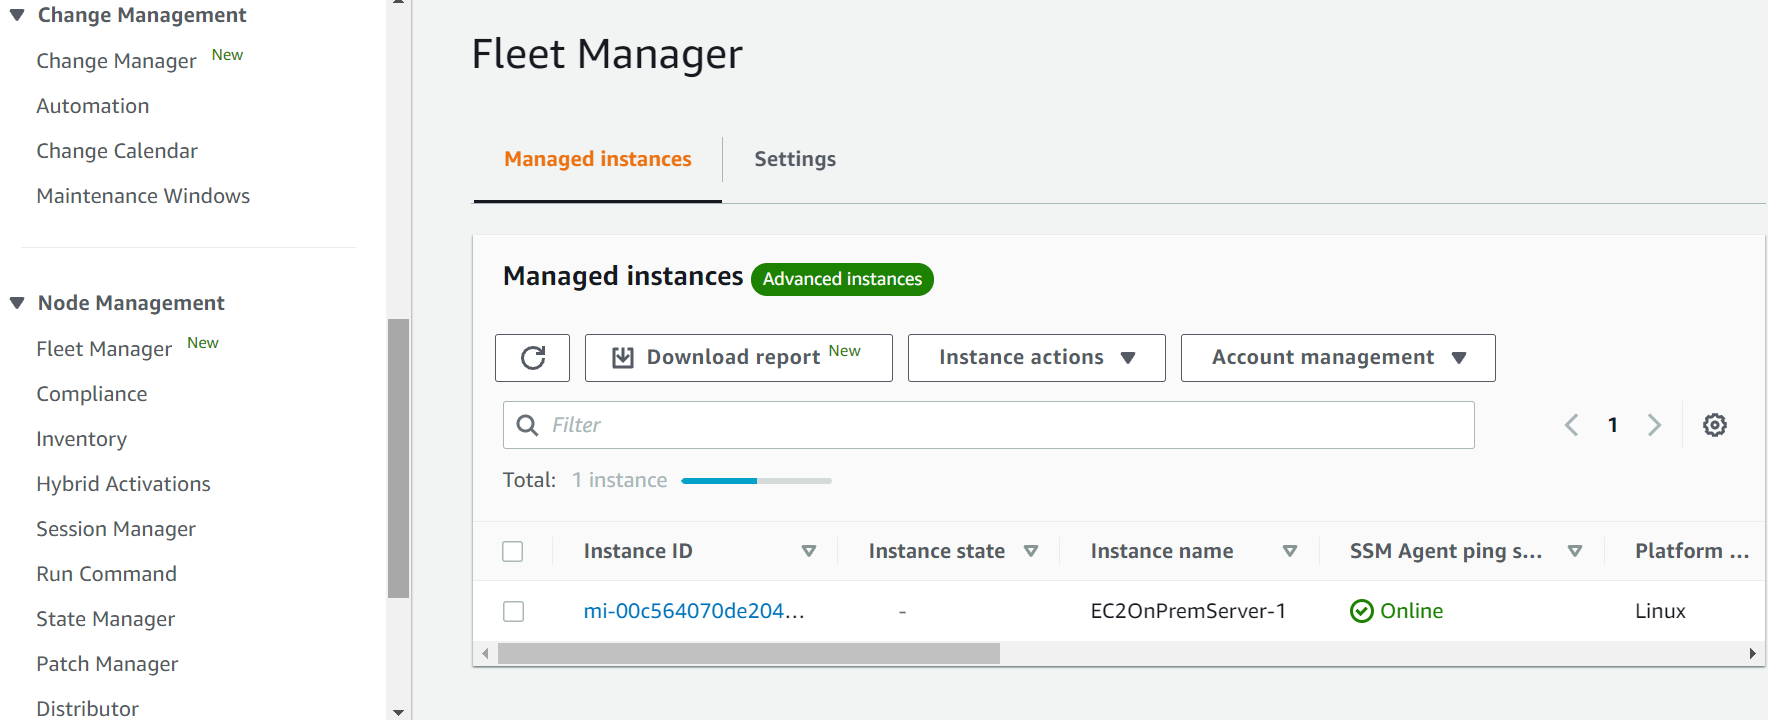
- Once the SSM agent is started, you should see the on-premises server(s) in the Systems Manager console by going to the ‘Fleet Manager’ section of the panel under Node Management as shown below.
- Install the CloudWatch agent on the on-premises server(s) by using AWS Systems Manager’s Run command, and then selecting AWS-ConfigureAWSPackage Configure the CloudWatch agent by using a configuration file or configuration wizard.
- Configure on-premises servers that use SSM Agent and the unified CloudWatch agent to use AWS credentials. See the following link on how to do so:https://aws.amazon.com/premiumsupport/knowledge-center/cloudwatch-on-premises-temp-credentials/
- Set up CloudWatch log groups and log streams for CloudWatch in AWS to send logs to AWS, and then start the CloudWatch agent on the servers by using the following command:
Configuring AWS X-Ray
In this section, we discuss the steps to enable AWS X-Ray for on-premises servers. To send segments to AWS X-Ray directly, utilize PutTraceSegments, or through the X-Ray daemon. This post utilizes the AWS X-Ray daemon approach to send the traces back to AWS X-ray service.
We recommend utilizing AWS X-Ray daemon to emit data into AWS X-Ray, as this ensures the application will not need to spend time and resources formatting and emitting data to the AWS X-Ray API. Use of a local AWS X-Ray daemon lets your applications send telemetry locally on your network in real-time over UDP port 2000. This places the transmission burden on a purpose-built system that is solely responsible for doing so. Moreover, this follows the principal of least privilege, as well as a strong separation of concerns between your applications and the systems that analyze telemetry.
Run the AWS X-Ray daemon on-premises on Linux, MacOS, Windows, or in a Docker container, and relay trace data back to AWS X-Ray. When running outside of AWS Cloud, the daemon can read credentials from an Amazon SDK credentials file (.aws/credentials in your user directory) or from environment variables.
Find the AWS X-Ray daemon configurations below.
AWS X-Ray daemon configurations:
- Download and install the AWS X-Ray agent on the on-premises server by using the following command. The command will vary depending on the OS. Find more information depending upon the different operating systems using this link. Also, define an SSM Document to install the daemon by using AWS Systems Manager.
- Provide AWS credentials in the credentials file located in ~/.aws/credentials on Ubuntu server. For other OS, see the location here. You must create a user in AWS and download the ‘AWS Access Key Id’, and ‘AWS Secret Access Key’, which must be provided in the credentials file as follows:
- Check the AWS Identity by using the following command, and you should find the appropriate userid, account, and role information:
aws sts get-caller-identity
- It is very important to check that you have configured the AWS profile of the target account before running the AWS X-Ray daemon. The AWS X-Ray agent will fail to send the messages if you are using an incorrect access key or secret access key.
- If you cannot see the traces going back to AWS X-Ray, run the env command and check the AWS Profile set. You should see something like what is shown below, and it should be the correct profile.
- Configure the AWS X-ray agent by providing a config yaml file or providing the appropriate parameters while starting the AWS X-Ray daemon as follows:
/xray-daemon$ ./xray -o -n <region> -f <log file location> -l <log level> &
- Run the AWS X-Ray daemon in the background, or use any other mechanisms as per your company policies to run it.
Send AWS X-Ray traces:
- For this blog, we have used a simple python – Flask based web application. To generate a segment based on incoming requests, you must instantiate the AWS X-Ray middleware for flask by using the below libraries:
- If you are using any other language or framework, you can always refer to the AWS X-Ray developer guide for detailed information.
- Furthermore, in order to instrument downstream calls, use the AWS X-Ray SDK for Python to patch the libraries that your application uses. The AWS X-Ray SDK for Python can patch the libraries available in this link. When you use a patched library, the AWS X-Ray SDK for Python creates a subsegment for the call and records information from the request and response. A small code snippet is available below:
- There are other detailed options available to send granular data, but for the initial set up you can utilize this simple piece of code shown above. For a detailed set up, refer to this documentation. There are similar references available for other languages as well.
- As you use your application, you will see the traces sent to the AWS X-Ray service immediately and should be able to see the required graphs in your application.
End-to-end observability in AWS
This section demonstrates how enterprises can monitor hybrid environments holistically. End-to-end monitoring covers on-premises and AWS environments, and it provides a single pane of glass for monitoring.
CloudWatch Console Screenshots
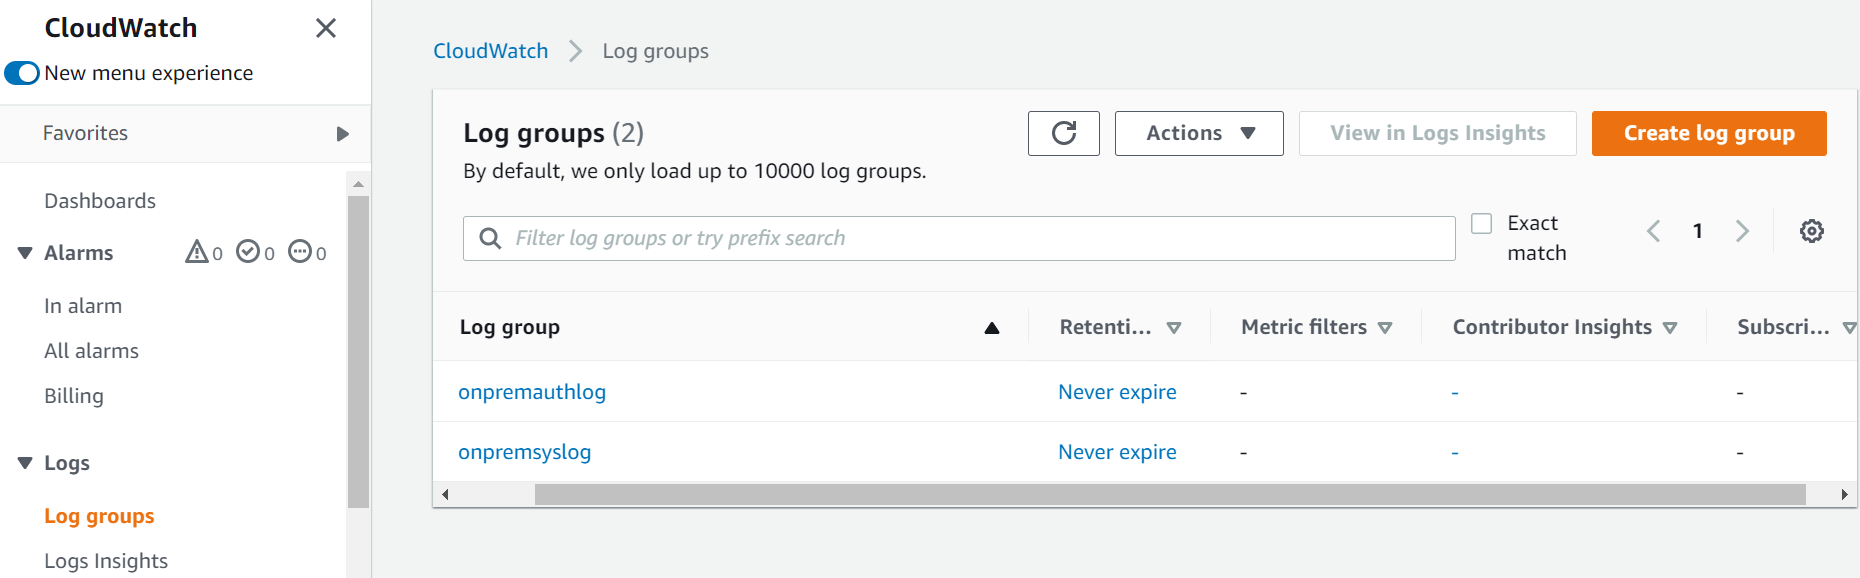
Here’s a view of CloudWatch log group created to ingest logs from on-premises servers:
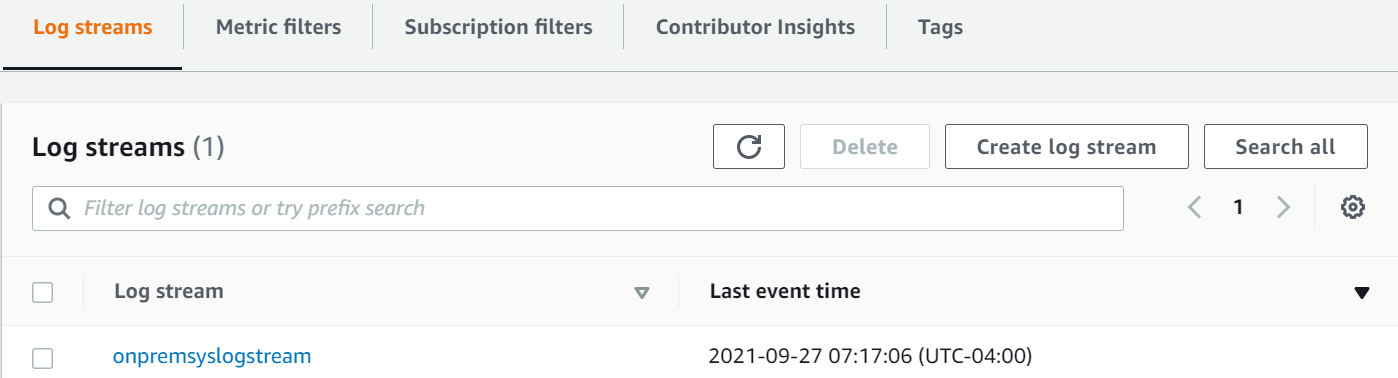
The following image shows the CloudWatch log stream created in the log group (onpremsyslog) to capture CloudWatch logs:
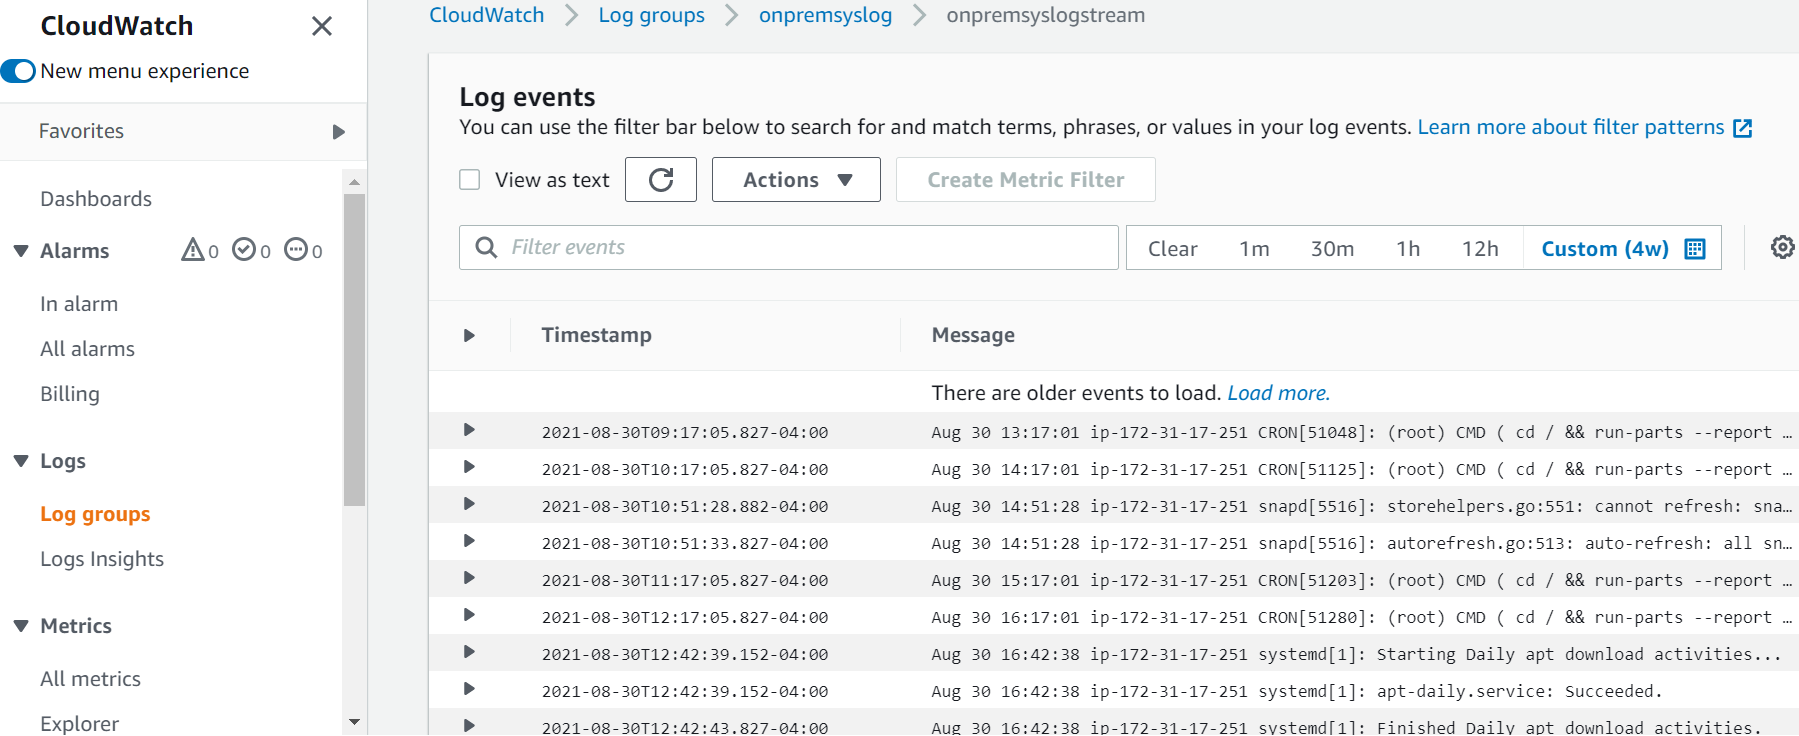
And the image below shows logs pushed from on-premises servers:
AWS X-Ray Screenshots
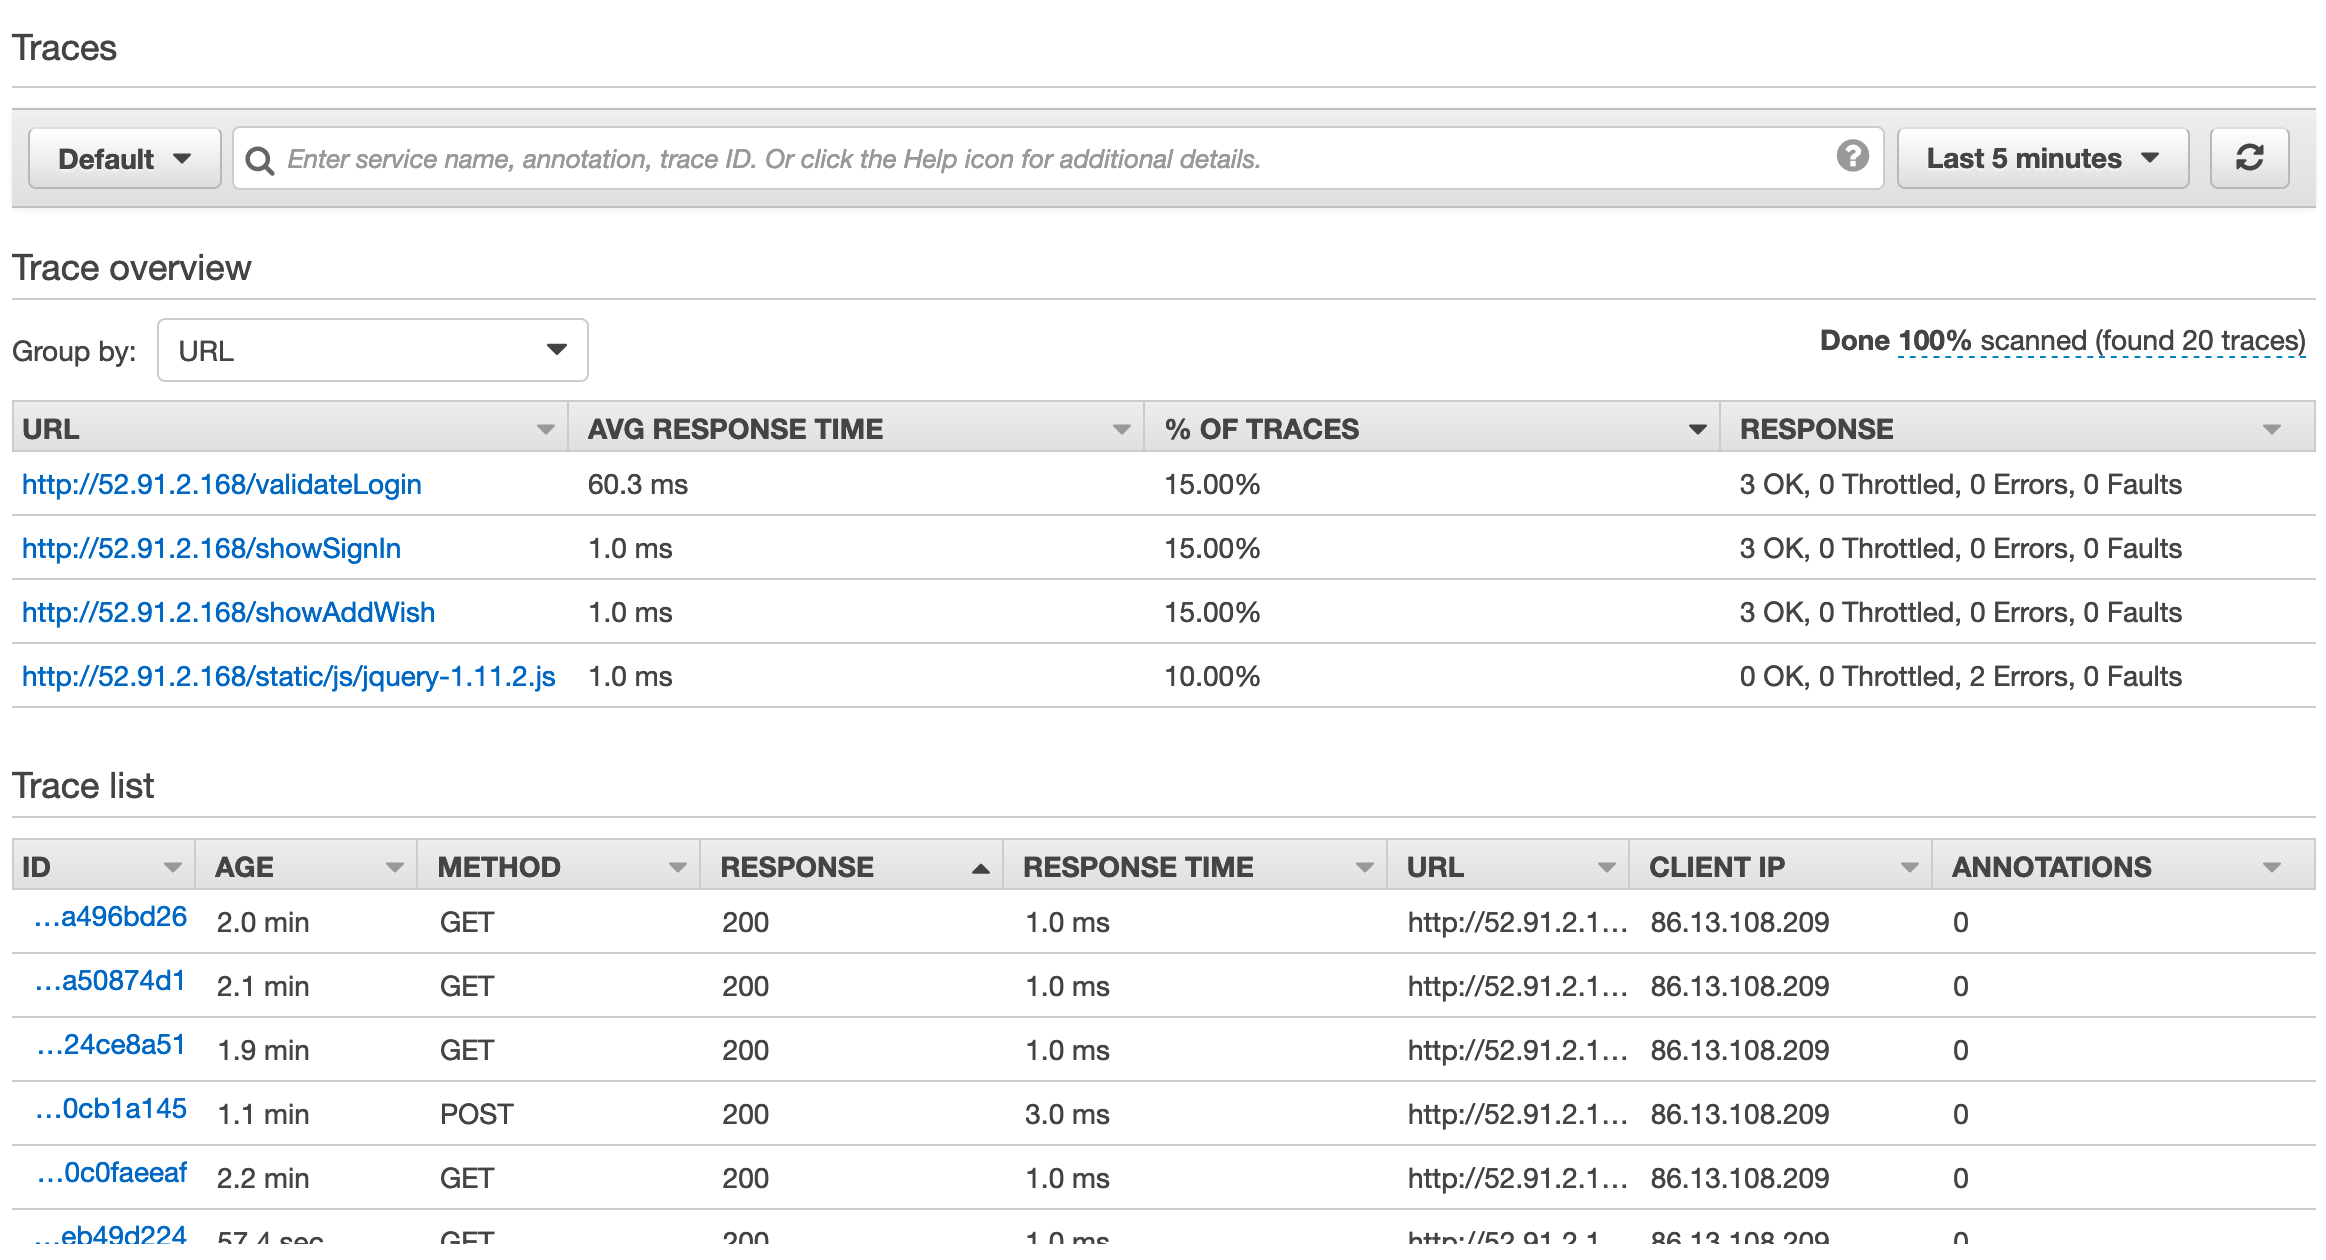
Find the traces overview in your AWS X-Ray application, which you can group by URL, status code, user, etc. It lets you drill down to individual trace from the Trace list and get a detailed view.
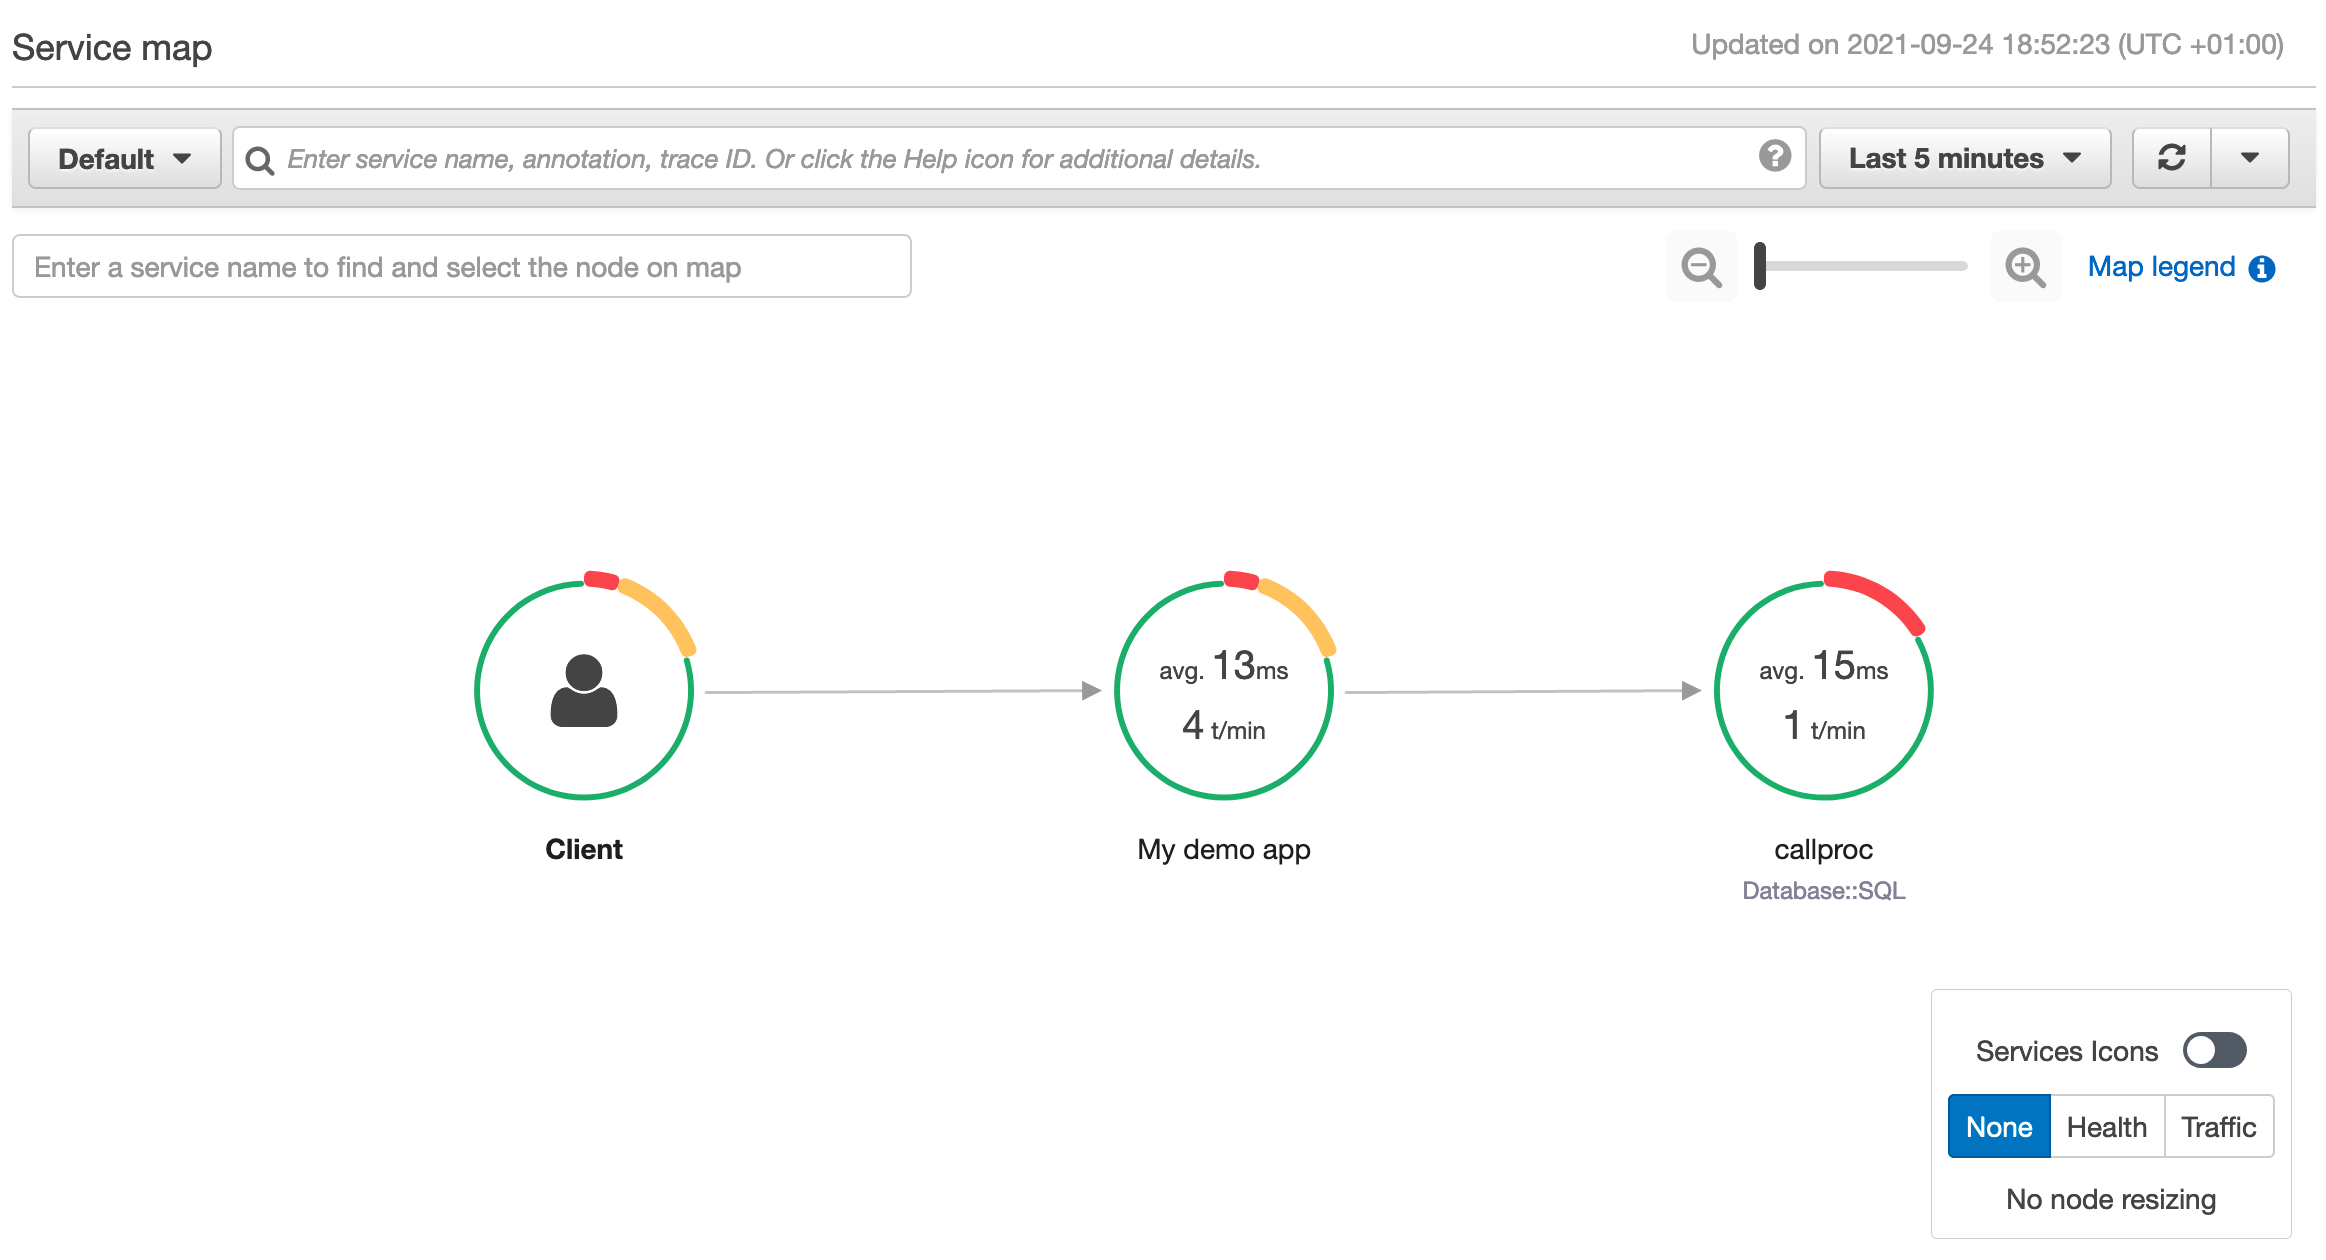
You can go to AWS X-Ray service maps that show information about your API and all of its downstream services. For example, in this scenario, we are seeing calls made to database server.
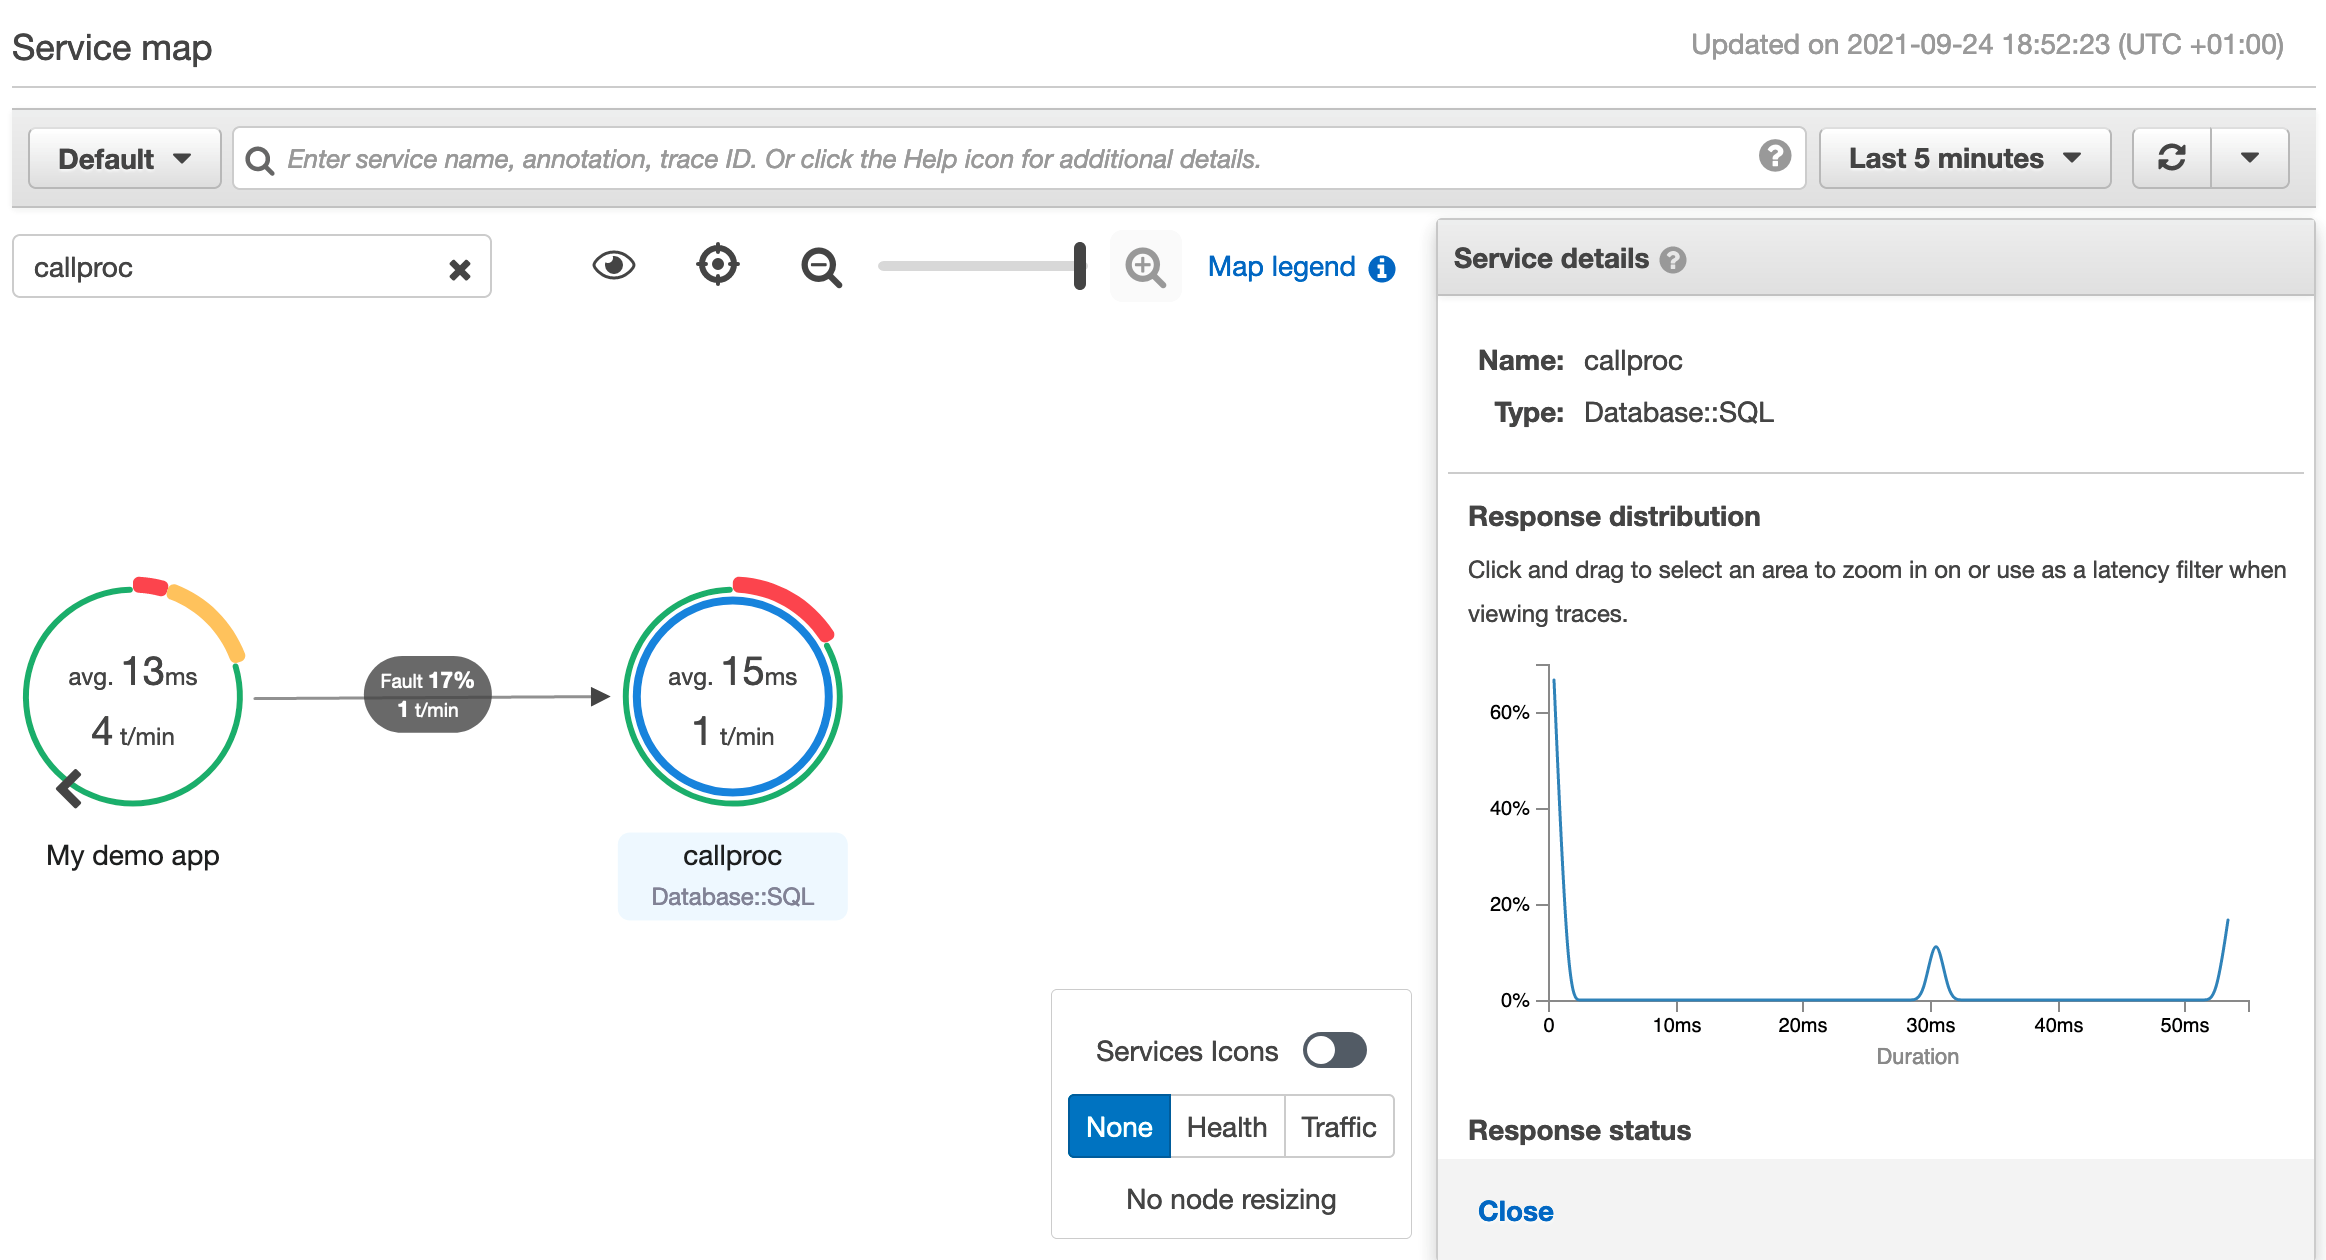
If you choose a node or edge on an AWS X-Ray service map, the AWS X-Ray console shows a latency distribution histogram. Utilize a latency histogram to see how long it takes for a service to complete its requests.
Essentially, by just following a couple simple steps, you can enable end-to-end monitoring for your on-premises application. Furthermore, it can be extended to a range of applications hosted in an on-premises or hybrid environment, which will let you build a single monitoring view on AWS Cloud.
Considerations for implementing Monitoring strategy
So far, we’ve shown how to utilize AWS tools to complement an enterprise’s monitoring strategy. These tools and services can support strategic long-term monitoring objectives, or they can be used tactically to bridge gap(s) until the long-term monitoring strategy is finalized. Based on our experience, no single solution will work for every organization. Here are some considerations that should help select the appropriate tool, and help with the monitoring strategy.
- Existing toolset: What are the current monitoring tools in place? If the current tools meet your organization’s monitoring requirements and can meet future workload requirements, then you should continue using them.
- Monitoring capabilities: Is the tool(s) in consideration capable of monitoring cloud-native workloads that you intend to use moving forward? For example, if the enterprise direction is to use serverless technologies (or say containers – ECS/EKS), will the tool(s) be able to monitor the workloads effectively? Also, do the tool(s) cover every aspect of monitoring requirements — infrastructure, network, application, etc.?
- SMEs and knowledge: Do you have the skill set and know-how to use a monitoring tool? We’ve seen numerous monitoring initiatives fail due to lack of expertise. It is imperative that enterprises have the requisite knowledge and skill-set to work with the tool.
- Cost: Look at the costs holistically. Factor in support costs, integration/development costs, and not just the licensing costs (present and future) of the tool(s) under consideration. Some monitoring tools are not cheap, and in some cases enterprises will be better off using their existing toolsets/licenses. Explore BYOL (Bring Your Own License) or AWS Marketplace/private pricing offerings, as they may help lower costs.
- Integration: See how the tool(s) integrate with your workloads, AWS services, and SIEM platform in general. In some cases, low licensing costs may be offset by high integration costs.
- Reliability: Does the tool(s), and its deployment, meet the HA requirements, as well as support RTO and RPO objectives of the organization?
- Security: Does the tool(s) meet the security and controls requirements of the enterprise, and does it support integration with security tools and services?
- Open source vs Proprietary: From the technological perspective, one criteria you must determine is whether you want an open source monitoring toolset (e.g., ELK – ElasticSearch/Logstash/Kibana, or Prometheus/Grafana), or a proprietary vendor product. The toolset you opt for depends on the enterprise culture, i.e., does the enterprise have a mature technology team, and are they experienced working with open source tools and technologies (e.g., Kubernetes)? Or, is the organization more comfortable using a tool backed by a vendor (from the support perspective)? This decision also depends on the risk profile of the enterprise, as some organizations have a policy in place not to implement a technology stack that is unsupported by a vendor.
- User Experience: Last, but not least, are end users—business and technical—comfortable with the user experience that the tool offers? User experience is one of the most underrated factors in terms of monitoring tool selection, and it is a key reason for the lack of adoption of the tool within organizations.
Best Practices
Below we’ve listed some of the best practices for monitoring based on our experience.
- Don’t boil the ocean
As the enterprise starts migrating to the cloud, add any additional tool(s) in order to address gaps existing in the current state monitoring environment. Don’t try to boil the ocean and replace the current monitoring tool(s) with the “latest and greatest”. Chances are that your organization already has monitoring tools in place. The key is determining whether the tool can meet your future requirements and if it is a good fit for monitoring cloud-native workloads. If not, then complement the tool with additional tools instead of utilizing a blanket replacement. Over time, as workloads migrate to the cloud, use the strangler pattern in order to organically reduce the legacy monitoring tool(s) footprint. - Implement a POC (proof of concept)
One of the most tested approaches when introducing a new technology is trying out a “proof of concept“. This is especially true for a cloud environment, where cost barriers to implement a POC are significantly lower. You don’t need to set up servers, procure hardware, and spend months preparing the POC environment. Identify the key workloads and/or scenarios for monitoring, including the KPIS/metrics that the tool should monitor and report on. Moreover, POC lends enterprises a great opportunity to see how easy, or difficult, it is to setup and configure monitoring. The effort spent implementing a POC will be well worth it, as you don’t want to know the tool isn’t as user-friendly and flexible as you thought when you reviewed the presentations! - Change Management
No matter what tool you opt for, or what the monitoring strategy is, ensure that the enterprise is well equipped and trained to utilize the tool. This holds true for both business and technical users of the tool. We’ve seen some enterprises cut corners on training and change the management aspect of the tool. This ultimately resulted in higher costs for the enterprise in the longer run. - Define KPIs/metrics
One of the main reasons we see enterprises struggle with their monitoring strategy is that they never defined the success criteria for monitoring. They never defined a business outcome from which to work backward. As a result, they had a monitoring “solution” in place, but not the end result they desired. A big part of the monitoring strategy is understanding “What” and “Why”. In other words, what do you intend to monitor, and why? In some cases, determining the monitoring KPIs and metrics led to a realization that the enterprise was actually looking for business process metrics and needed an analytics solution in order to complement their monitoring strategy. It’s always nice to know “what good looks like” before defining an enterprise monitoring strategy.
Conclusion
This post demonstrated how AWS tools and services can help enterprises monitor hybrid and on-premises environments, and how AWS can provide a single pane of glass for a holistic monitoring view. We walked through the steps for setting up hybrid environment monitoring, and described a common hybrid scenario for monitoring on-premises and AWS workloads. Furthermore, we discussed some key considerations for selecting the monitoring technology and toolset. And finally, we touched upon the best practices to follow when defining a monitoring strategy for your enterprise.