UPDATE: This blog post has been published to include information about the recently added support for KEDA with the Amazon Managed Service for Prometheus (AMP).”
Orchestration platforms such as Amazon EKS and Amazon ECS have simplified the process of building, securing, operating, and maintaining container-based applications, thereby helping organizations focus on building applications. We simplified this further with the launch of AWS Fargate, where customers no longer have to manage Amazon Elastic Compute Cloud (EC2) instances for their Amazon EKS/ECS clusters. Customers have started adopting event-driven deployment, which is the ability to activate a Kubernetes deployment (i.e., no pods to a single pod) and subsequently to more pods based on events from various event sources.
By implementing eventdriven deployment andautoscaling, customers can achieve cost savings by providing on-demand compute and autoscale efficiently based on application logic. Kubernetes supports cluster level autoscaling using cluster autoscaler and application level autoscaling using Horizontal Pod Autoscaler and Vertical Pod Autoscaler. Horizontal Pod Autoscaler (HPA) and Vertical Pod Autoscaler can scale pods based on observed CPU utilization and memory usage. For complex scenarios like eventdriven autoscaling, customers rely on metrics related to application logic.
KEDA (Kubernetes-based Event Driven Autoscaler) lets you drive the autoscaling of Kubernetes workloads based on the number of events, such as a custom metric scraped breaching a specified threshold or when there is a message in the Kafka queue. KEDA is a single-purpose and lightweight component that can be added into any Kubernetes cluster. It works alongside standard Kubernetes components, such as the Horizontal Pod Autoscaler, and can extend functionality without overwriting or duplication. KEDA lets you explicitly map the apps you want to use event-driven scale, while other apps continuing to function. This makes KEDA a flexible and safe option to run alongside any number of other Kubernetes applications or frameworks.
Amazon Managed Service for Prometheus is a serverless, Prometheus-compatible monitoring service for container metrics that makes it easier to securely monitor container environments at scale. Amazon Managed Service for Prometheus lets you use the same opensource Prometheus data model and query language that you use today to monitor the performance of your containerized workloads, and also enjoy improved scalability, availability, and security without having to manage the underlying infrastructure.
In this post, we will show you how you can use KEDA to autoscale Amazon EKS Pods by querying the metrics stored in Amazon Managed Service for Prometheus
Prerequisites
You will need the following to complete the steps in this post:
The following diagram shows the complete setup that we will walk through in this blog post
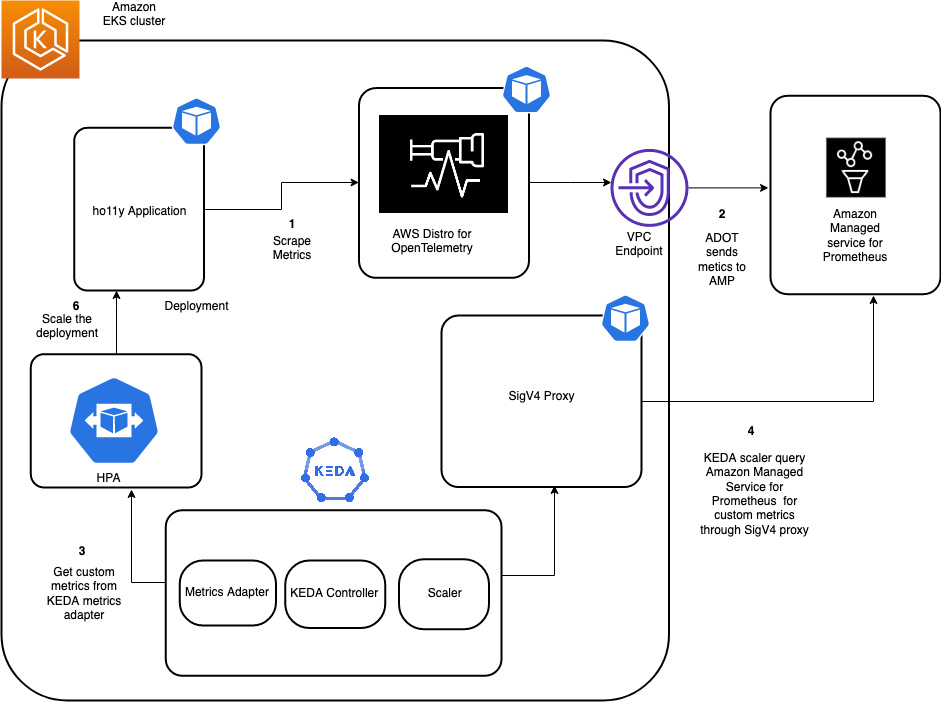
Figure 1: Architecture diagram
Step 1: Create an Amazon EKS Cluster and KEDA operator
First, create an Amazon EKS cluster for running the sample application and the KEDA operator. The eksctl CLI tool will deploy the cluster using the eks-cluster-config.yaml file:
export AMP_KEDA_CLUSTER=AMP-KEDA-CLUSTER
export AMP_ACCOUNT_ID=<Your Account id>
export AWS_REGION=<Your Region>

cat << EOF > eks-cluster-config.yaml
---
apiVersion: eksctl.io/v1alpha5
kind: ClusterConfig
metadata:
  name: $AMP_KEDA_CLUSTER
  region: $AWS_REGION
  version: '1.20'
iam:
  withOIDC: true
  serviceAccounts:
  - metadata:
      name: keda-operator
      namespace: keda
      labels: {aws-usage: "application"}
    attachPolicyARNs:
    - "arn:aws:iam::aws:policy/AmazonPrometheusQueryAccess"
managedNodeGroups:
- name: default-ng
  minSize: 1
  maxSize: 3
  desiredCapacity: 2
  labels: {role: mngworker}
  iam:
    withAddonPolicies:
      certManager: true
      cloudWatch: true
cloudWatch:
  clusterLogging:
    enableTypes: ["*"]
EOF
Execute the following command to create the EKS cluster:
eksctl create cluster -f eks-cluster-config.yaml
This creates an Amazon EKS cluster named AMP-KEDA-CLUSTER and a service account named keda-operator that the KEDA scaler will use.
KEDA performs two key roles within Kubernetes: The Agent activates and deactivates Kubernetes Deployments to scale to and from zero on no events. This is one of the primary roles of the keda-operator container that runs when you install KEDA. KEDA also acts as a Kubernetes metrics server that exposes rich event data, such as queue length or any custom metric to the Horizontal Pod Autoscaler to drive scale out. It is up to the Deployment to consume the events directly from the source. This preserves rich event integration and enables gestures like completing or abandoning queue messages to work out of the box. The metric serving is the primary role of the keda-operator-metrics-apiserver container that runs when you install KEDA.
Next, use the following commands to install the keda operator in the Keda namespace:
helm repo add kedacore https://kedacore.github.io/charts
We will create the values.yaml for the KEDA operator to set the right security context:
cat << EOF > values.yaml
operator:
  name: keda-operator
podSecurityContext:
  fsGroup: 1001
securityContext:
  runAsGroup: 1001
  runAsUser: 1001
serviceAccount:
  create: false
  name: keda-operator
EOF

helm install keda kedacore/keda --namespace keda -f values.yaml
We can describe the pods in the Keda namespace to verify:
Admin:~/environment $ kubectl get pods -n keda
NAME                                              READY   STATUS    RESTARTS   AGE
keda-operator-6d74df9577-vc6gs                    1/1     Running   0          48s
keda-operator-metrics-apiserver-fc6df469f-vlf9r   1/1     Running   0          48s
Step 2: Create an Amazon Managed Service for Prometheus workspace
The Amazon Managed Service for Prometheus workspace ingests the Prometheus metrics collected from envoy. A workspace is a logical and isolated Prometheus server dedicated to Prometheus resources such as metrics. A workspace supports fine-grained access control for authorizing its management, such as update, list, describe, and delete, as well as ingesting and querying metrics.
aws amp create-workspace --alias AMP-KEDA --region $AWS_REGION
Next, optionally create an interface VPC endpoint to securely access the managed service from resources deployed in your VPC. This makes sure that data ingested by the managed service won’t leave your AWS account VPC. Utilize the AWS CLI as shown here. Replace the placeholder strings, such as VPC_ID, AWS_REGION, with your values.
export VPC_ID=<Your EKS Cluster VPC Id> aws ec2 create-vpc-endpoint \ --vpc-id $VPC_ID \ --service-name com.amazonaws.<$AWS_REGION>.aps-workspaces \ --security-group-ids <SECURITY_GROUP_IDS> \ --vpc-endpoint-type Interface \ --subnet-ids <SUBNET_IDS>
Step 3: Deploy sample application and scrape metrics using AWS Distro for OpenTelemetry
In this post, we will use a sample application called ho11y, which is a synthetic signal generator letting you test observability solutions for microservices. It emits logs, metrics, and traces in a configurable manner.
To install the application, execute the following commands:
git clone https://github.com/aws-observability/aws-o11y-recipes.git

cd ./aws-o11y-recipes/sandbox/ho11y/
docker build . -t "$AMP_ACCOUNT_ID.dkr.ecr.$AWS_REGION.amazonaws.com/ho11y:latest
aws ecr get-login-password --region $AWS_REGION | docker login --username AWS --password-stdin  "$ACCOUNT_ID.dkr.ecr.$AWS_REGION.amazonaws.com"
aws ecr create-repository --repository-name ho11y

docker push "$ACCOUNT_ID.dkr.ecr.$AWS_REGION.amazonaws.com/ho11y:latest"
kubectl create namespace ho11y
cat << EOF > holly.yaml
---
apiVersion: apps/v1
kind: Deployment
metadata:
  name: frontend
spec:
  selector:
    matchLabels:
      app: frontend
  replicas: 1
  template:
    metadata:
      labels:
        app: frontend
    spec:
      containers:
      - name: ho11y
        image: "$ACCOUNT_ID.dkr.ecr.$AWS_REGION.amazonaws.com/ho11y:latest"
        ports:
        - containerPort: 8765
        env:
        - name: DISABLE_OM
          value: "on"
        - name: HO11Y_LOG_DEST
          value: "stdout"
        - name: OTEL_RESOURCE_ATTRIB
          value: "frontend"
        - name: OTEL_EXPORTER_OTLP_ENDPOINT
          value: "adot:4317"
        - name: HO11Y_INJECT_FAILURE
          value: "enabled"
        - name: DOWNSTREAM0
          value: "http://downstream0"
        - name: DOWNSTREAM1
          value: "http://downstream1"
        imagePullPolicy: Always
---
apiVersion: apps/v1
kind: Deployment
metadata:
  name: downstream0
spec:
  selector:
    matchLabels:
      app: downstream0
  replicas: 1
  template:
    metadata:
      labels:
        app: downstream0
    spec:
      containers:
      - name: ho11y
        image: public.ecr.aws/mhausenblas/ho11y:stable
        ports:
        - containerPort: 8765
        env:
        - name: DISABLE_OM
          value: "on"
        - name: HO11Y_LOG_DEST
          value: "stdout"
        - name: OTEL_RESOURCE_ATTRIB
          value: "downstream0"
        - name: OTEL_EXPORTER_OTLP_ENDPOINT
          value: "adot:4317"
        - name: DOWNSTREAM0
          value: "https://mhausenblas.info/"
        imagePullPolicy: Always
---
apiVersion: apps/v1
kind: Deployment
metadata:
  name: downstream1
spec:
  selector:
    matchLabels:
      app: downstream1
  replicas: 1
  template:
    metadata:
      labels:
        app: downstream1
    spec:
      containers:
      - name: ho11y
        image: public.ecr.aws/mhausenblas/ho11y:stable
        ports:
        - containerPort: 8765
        env:
        - name: DISABLE_OM
          value: "on"
        - name: HO11Y_LOG_DEST
          value: "stdout"
        - name: OTEL_RESOURCE_ATTRIB
          value: "downstream1"
        - name: OTEL_EXPORTER_OTLP_ENDPOINT
          value: "adot:4317"
        - name: DOWNSTREAM0
          value: "https://o11y.news/2021-03-01/"
        - name: DOWNSTREAM1
          value: "DUMMY:187kB:42ms"
        - name: DOWNSTREAM2
          value: "DUMMY:13kB:2ms"
        imagePullPolicy: Always
---
apiVersion: v1
kind: Service
metadata:
  name: frontend
spec:
  ports:
  - port: 80
    targetPort: 8765
  selector:
    app: frontend
---
apiVersion: v1
kind: Service
metadata:
  name: downstream0
spec:
  ports:
  - port: 80
    targetPort: 8765
  selector:
    app: downstream0
---
apiVersion: v1
kind: Service
metadata:
  name: downstream1
spec:
  ports:
  - port: 80
    targetPort: 8765
  selector:
    app: downstream1
---
EOF


kubectl apply -f holly.yaml -n ho11y
This will create three deployments: frontend, downstream0, and downstream1 and 3 services for each deployment.
Admin:~/environment $ kubectl get deployments -n ho11y
NAME          READY   UP-TO-DATE   AVAILABLE   AGE
downstream0   2/2     2            2           4d2h
downstream1   1/1     1            1           4d2h
frontend      1/1     1            1           4d2h

Admin:~/environment $ kubectl get svc -n ho11y
NAME          TYPE        CLUSTER-IP     EXTERNAL-IP   PORT(S)   AGE
downstream0   ClusterIP   10.100.6.63    <none>        80/TCP    4d2h
downstream1   ClusterIP   10.100.8.55    <none>        80/TCP    4d2h
frontend      ClusterIP   10.100.83.92   <none>        80/TCP    4d2h
Next, we will have to deploy a collector that can scrape the application metrics emitted by ho11y. Amazon Managed Service for Prometheus does not directly scrape operational metrics from containerized workloads in a Kubernetes cluster. You must deploy and manage a Prometheus server or an OpenTelemetry agent, such as the AWS Distro for OpenTelemetry Collector (ADOT) or the Grafana Agent to perform this task. The ADOT-AMP pipeline lets us use the ADOT Collector to scrape a Prometheus-instrumented application, and then send the scraped metrics to Amazon Managed Service for Prometheus.
This post will also walk you through the steps to configure an AWS Identity and Access Management (IAM) role to send Prometheus metrics to Amazon Managed Service for Prometheus. We install the ADOT collector on the Amazon EKS cluster and forward metrics to Amazon Managed Service for Prometheus.
Configure permissions
We will be deploying the ADOT collector to run under the identity of a Kubernetes service account “amp-iamproxy-service-account”. IAM roles for service accounts (IRSA) lets you associate the AmazonPrometheusRemoteWriteAccess role with a Kubernetes service account, thereby providing IAM permissions to any pod utilizing the service account to ingest the metrics to Amazon Managed Service for Prometheus.
You need kubectl and eksctl CLI tools to run the script. They must be configured to access your Amazon EKS cluster.
eksctl create iamserviceaccount --name adot-collector --namespace ho11y --cluster $AMP_KEDA_CLUSTER --attach-policy-arn arn:aws:iam::aws:policy/AmazonPrometheusRemoteWriteAccess --approve
export WORKSPACE=$(aws amp list-workspaces | jq -r '.workspaces[] | select(.alias=="AMP-KEDA").workspaceId')
export REGION=$AWS_REGION
export REMOTE_WRITE_URL="https://aps-workspaces.$REGION.amazonaws.com/workspaces/$WORKSPACE/api/v1/remote_write"
Now create a manifest file, amp-eks-adot-prometheus-daemonset.yaml, with the scrape configuration to extract envoy metrics and deploy the ADOT collector. This example deploys a deployment named adot. The adot deployment collects metrics from pods on the cluster.
cat << EOF > amp-eks-adot-prometheus-daemonset.yaml
---
apiVersion: v1
kind: ConfigMap
metadata:
  name: adot-collector
  labels:
    app: aws-adot
    component: adot-collector
data:
  adot-collector-config: |
    receivers:
      otlp:
        protocols:
          grpc:
            endpoint: 0.0.0.0:4317
          http:
            endpoint: 0.0.0.0:55681
      awsxray:
        endpoint: 0.0.0.0:2000
        transport: udp
      prometheus:
        config:
          global:
            scrape_interval: 15s
            scrape_timeout: 10s
          scrape_configs:
          - job_name: kubernetes-service-endpoints
            kubernetes_sd_configs:
            - role: endpoints
            relabel_configs:
            - action: keep
              regex: true
              source_labels: [__meta_kubernetes_service_annotation_prometheus_io_scrape]
            - action: replace
              regex: (https?)
              source_labels: [__meta_kubernetes_service_annotation_prometheus_io_scheme]
              target_label: __scheme__
            - action: replace
              regex: (.+)
              source_labels: [__meta_kubernetes_service_annotation_prometheus_io_path]
              target_label: __metrics_path__
            - action: replace
              regex: ([^:]+)(?::\d+)?;(\d+)
              replacement: $$1:$$2
              source_labels:
              - __address__
              - __meta_kubernetes_service_annotation_prometheus_io_port
              target_label: __address__
            - action: labelmap
              regex: __meta_kubernetes_service_label_(.+)
            - action: replace
              source_labels: [__meta_kubernetes_namespace]
              target_label: k8s_namespace
            - action: replace
              source_labels: [__meta_kubernetes_service_name]
              target_label: k8s_service
            - action: replace
              source_labels: [__meta_kubernetes_pod_node_name]
              target_label: k8s_node
            - action: replace
              source_labels: [__meta_kubernetes_pod_name]
              target_label: k8s_pod
            - action: replace
              source_labels: [__meta_kubernetes_pod_container_name]
              target_label: k8s_container
          - job_name: adot
            kubernetes_sd_configs:
            - role: pod
            relabel_configs:
            - action: replace
              regex: ([^:]+)(?::\d+)?
              replacement: $${1}:8888
              source_labels: [__address__]
              target_label: __address__
            - action: replace
              source_labels: [__meta_kubernetes_namespace]
              target_label: k8s_namespace
            - action: replace
              source_labels: [__meta_kubernetes_pod_name]
              target_label: k8s_pod
            - action: keep
              source_labels: [__meta_kubernetes_pod_label_app]
              regex: adot
          - job_name: ho11y
            kubernetes_sd_configs:
            - role: pod
            relabel_configs:
            - action: replace
              source_labels: [__meta_kubernetes_namespace]
              target_label: k8s_namespace
            - action: replace
              source_labels: [__meta_kubernetes_pod_name]
              target_label: k8s_pod
            - action: keep
              source_labels: [__meta_kubernetes_pod_label_app]
              regex: frontend|downstream(.*)
    processors:
      batch/traces:
        timeout: 1s
        send_batch_size: 20
      batch/metrics:
        timeout: 10s
    exporters:
      awsxray:
      awsemf:
      awsprometheusremotewrite:
        endpoint: "$REMOTE_WRITE_URL"
        aws_auth:
          region: "$REGION"
          service: "aps"
      logging:
        loglevel: debug
    extensions:
      health_check:
      pprof:
      zpages:
    service:
      extensions: [pprof, zpages, health_check]
      pipelines:
        traces:
          receivers: [otlp, awsxray]
          processors: [batch/traces]
          exporters: [awsxray]
        metrics:
          receivers: [prometheus]
          processors: [batch/metrics]
          exporters: [logging, awsprometheusremotewrite]
---
kind: ClusterRole
apiVersion: rbac.authorization.k8s.io/v1
metadata:
  name: adot-collector
rules:
  - apiGroups: [""]
    resources:
    - nodes
    - nodes/proxy
    - services
    - endpoints
    - pods
    verbs: ["get", "list", "watch"]
  - apiGroups:
    - extensions
    resources:
    - ingresses
    verbs: ["get", "list", "watch"]
  - nonResourceURLs: ["/metrics"]
    verbs: ["get"]
---
kind: ClusterRoleBinding
apiVersion: rbac.authorization.k8s.io/v1
metadata:
  name: adot-collector-binding
subjects:
  - kind: ServiceAccount
    name: adot-collector
    namespace: ho11y
roleRef:
  kind: ClusterRole
  name: adot-collector
  apiGroup: rbac.authorization.k8s.io
---
apiVersion: apps/v1
kind: Deployment
metadata:
  name: adot
  labels:
    app: aws-adot
    component: adot-collector
spec:
  selector:
    matchLabels:
      app: adot
  replicas: 1
  template:
    metadata:
      labels:
        app: adot
    spec:
      serviceAccountName: adot-collector
      containers:
      - name: adot-collector
        image: public.ecr.aws/aws-observability/aws-otel-collector:v0.11.0
        command:
        - "/awscollector"
        - "--config=/conf/adot-collector-config.yaml"
        - "--log-level=DEBUG"
        ports:
        - containerPort: 55681
        - containerPort: 55680
        - containerPort: 4317
        - containerPort: 8888
        env:
        - name: AWS_REGION
          value: "$REGION"
        volumeMounts:
        - name: adot-collector-config-vol
          mountPath: /conf
        livenessProbe:
          httpGet:
            path: /
            port: 13133
        readinessProbe:
          httpGet:
            path: /
            port: 13133
      volumes:
        - configMap:
            name: adot-collector
            items:
              - key: adot-collector-config
                path: adot-collector-config.yaml
          name: adot-collector-config-vol
---
apiVersion: v1
kind: Service
metadata:
  name: adot
  labels:
    app: aws-adot
    component: adot-collector
spec:
  ports:
  - name: receiver-http
    port: 55681
  - name: receiver-grpc-legacy
    port: 55680
  - name: receiver-grpc
    port: 4317
  - name: metrics
    port: 8888
  selector:
    app: adot
---
EOF
kubectl apply -f amp-eks-adot-prometheus-daemonset.yaml -n ho11y
After the ADOT collector is deployed, it will collect the metrics and ingest them into the specified Amazon Managed Service for Prometheus workspace. The scrape configuration is similar to that of a Prometheus server. We have added the necessary configuration for scraping the ho11y metrics.
Step 4: Configure sigv4 authentication for querying Amazon Managed Service for Prometheus and setup autoscaling using KEDA scaled object
AWS Signature Version 4 is a process to add authentication information to requests made to AWS APIs using HTTP. The AWS Command Line Interface (AWS CLI) and the AWS SDKs already use this protocol to make calls to the AWS APIs. Amazon Managed Service for Prometheus requires the API calls to have sigv4 authentication, and since KEDA doesn’t support sigv4, we will be deploying a sigv4 proxy service to act as a gateway for KEDA to access the query endpoint of the Amazon Managed Service for Prometheus.
Execute the following commands to deploy the sig-v4 proxy:
cat << EOF > keda-sigv4.yaml
---
apiVersion: apps/v1
kind: Deployment
metadata:
  labels:
    app: keda-sigv4
  name: keda-sigv4
  namespace: keda
spec:
  replicas: 1
  selector:
    matchLabels:
      app: keda-sigv4
  template:
    metadata:
      labels:
        app: keda-sigv4
      name: keda-sigv4
    spec:
      serviceAccountName: keda-operator
      containers:
      - name: aws-iamproxy
        image: public.ecr.aws/aws-observability/aws-sigv4-proxy:1.0
        args:
          - --name
          - aps
          - --region
          - $REGION
          - --host
          - aps-workspaces.us-east-1.amazonaws.com
        ports:
          - containerPort: 8080
---
apiVersion: v1
kind: Service
metadata:
  name: keda-sigv4
  namespace: keda
spec:
  ports:
  - port: 80
    targetPort: 8080
  selector:
    app: keda-sigv4
---
EOF
kubectl apply -f keda-sigv4.yaml
Let’s create the ScaledObject that will scale the deployment by querying the metrics stored in Amazon Managed Service for Prometheus.
A ScaledObject represents the desired mapping between an event source, such as a Prometheus metric and the Kubernetes Deployment, StatefulSet, or any Custom Resource that defines /scale subresource.
Behind the scenes, KEDA acts to monitor the event source and feed that data to Kubernetes and the HPA (Horizontal Pod Autoscaler) to drive the rapid scale of a resource. Each replica of a resource is actively pulling items from the event source.
KEDA also supports the scaling behavior that we configure in Horizontal Pod Autoscaler. This means that we can configure pollingInterval, cooldownPeriod, fallback configuration and make your scaling even more powerful.
The following commands will deploy the scaledobject named ho11y-hpa that will query the Amazon Managed Service for Prometheus query endpoint for a metric called holly_total.
holly_total metric represents the number of invokes of the application, and the threshold is specified as 1. Depending on the value over a period of one minute, you can scale in/out the downstream0 deployment between 1 and 10 pods.
cat << EOF > scaledobject.yaml
---
apiVersion: keda.sh/v1alpha1
kind: ScaledObject
metadata:
  name: ho11y-hpa
  namespace: ho11y
spec:
  scaleTargetRef:
    apiVersion: apps/v1
    kind: Deployment
    name: downstream0
  pollingInterval:  30
  cooldownPeriod:   300
  fallback:
    failureThreshold: 3
    replicas: 2
  minReplicaCount: 1        # Optional. Default: 0
  maxReplicaCount: 10       # Optional. Default: 100
  triggers:
    - type: prometheus
      metadata:
        serverAddress: http://keda-sigv4.keda.svc.cluster.local/workspaces/$WORKSPACE
        metricName: ho11y_total
        awsRegion: "us-east-1"
        identityOwner: operator
        threshold: '1'
        # Note: query must return a vector/scalar single element response
        query: rate(ho11y_total[1m])
---
EOF

kubectl apply -f scaledobject.yaml
Once we deploy the scaledobject, the KEDA will also create a HPA object in the ho11y namespace with the configuration specified in the scaledobject.yaml:
Admin:~/environment $ kubectl get hpa -n ho11y
NAME                 REFERENCE                TARGETS        MINPODS   MAXPODS   REPLICAS   AGE
keda-hpa-ho11y-hpa   Deployment/downstream0   0/1 (avg)   1         10        1          43m
Let’s put some load on the application by running the following command:
frontend_pod=`kubectl get pod -n ho11y --no-headers -l app=frontend  -o jsonpath='{.items[*].metadata.name}'`
loop_counter=0
while [ $loop_counter -le 300 ] ; do kubectl exec -n ho11y -it $frontend_pod  -- curl downstream0.ho11y.svc.cluster.local; echo ; loop_counter=$[$loop_counter+1];done
Describing the HPA should show something such as the following:
$ kubectl describe hpa -n ho11y
Name:                                                                                                                       keda-hpa-ho11y-hpa
Namespace:                                                                                                                  holly
Labels:                                                                                                                     app.kubernetes.io/managed-by=keda-operator
                                                                                                                            app.kubernetes.io/name=keda-hpa-ho11y-hpa
                                                                                                                            app.kubernetes.io/part-of=ho11y-hpa
                                                                                                                            app.kubernetes.io/version=2.4.0
                                                                                                                            scaledobject.keda.sh/name=ho11y-hpa
Annotations:                                                                                                                <none>
CreationTimestamp:                                                                                                          Fri, 12 Nov 2021 17:49:24 +0000
Reference:                                                                                                                  Deployment/downstream0

Events:
  Type     Reason                        Age                  From                       Message
  ----     ------                        ----                 ----                       -------
  Normal   SuccessfulRescale             40m                  horizontal-pod-autoscaler  New size: 2; reason: external metric prometheus-http---10-100-166-65-workspaces-ws-597472e4-0868-4752-a5d5-9b654b86b9a5-ho11y_total(&LabelSelector{MatchLabels:map[string]string{scaledobject.keda.sh/name: ho11y-hpa,},MatchExpressions:[]LabelSelectorRequirement{},}) above target
This confirms that the KEDA could successfully scale the application using the metrics ingested into Amazon Managed Service for Prometheus.
Clean-up
Use the following commands to delete resources created during this post:
aws amp delete-workspace --workspace-id $WORKSPACE
eksctl delete cluster $AMP_KEDA_CLUSTER
Conclusion
This post demonstrated how we can utilize KEDA operator to autoscale deployments based on some custom metrics stored in Amazon Managed Service for Prometheus. This helps customers provide on-demand compute by provisioning the pods only when they must have them. Amazon Managed Service for Prometheus lets you store the metrics reliably, and KEDA can monitor and scale the workloads out/in efficiently based on the events as they occur.
Further Reading
About the authors