AWS Cloud Operations Blog
Three questions to ask about AI inference in Amazon EKS, and how Amazon CloudWatch answers them
GPUs are expensive and scarce. On a cluster shared by several AI teams, an idle GPU costs you twice: once on the bill, and again as capacity a team is waiting for. Three questions follow: which workload holds each GPU, how well it uses it, and which workloads are affected when one GPU goes bad.
You can already see all three layers. Data Center GPU Manager (DCGM) reports GPU hardware metrics, Kubernetes reports pod and container metrics, and inference servers such as vLLM and SGLang report token throughput and queue depth. Lining them up is the hard part, because nothing carries the same labels: DCGM keys on each GPU’s hardware UUID, Kubernetes on pod and namespace. Answering any of the three questions means joining them yourself.
The Amazon CloudWatch Observability add-on can do that join for you, attaching Kubernetes pod and namespace labels to DCGM metrics as it collects them. In this post, we use the add-on to answer all three questions on an Amazon Elastic Kubernetes Service (Amazon EKS) cluster, through three CloudWatch features: CloudWatch accelerated compute insights for the GPU view, Amazon CloudWatch Omni for the application view, and Prometheus Query Language (PromQL) queries in Amazon CloudWatch Query Studio when you need a cut that neither one gives you.
Every figure and number in this post comes from one test cluster: two g5.2xlarge instances, each with a single A10G GPU, serving models with vLLM, monitored by version 7.0.0 of the add-on. Start with the first: which workload holds each GPU.
Who is using the GPUs, and what they cost
Both GPUs are allocated to vLLM pods in the inference namespace.
The fleet and its run-rate
Open the accelerated compute insights Overview, under GenAI Observability in the CloudWatch console. The Fleet Summary shows an estimated hourly run-rate for the accelerator fleet, with accelerators and inference workloads by status: two accelerators, both Active, and one workload, vllm, accounting for the whole run-rate.
The run-rate is an estimate for the instances, so it stays the same when the GPUs go quiet.
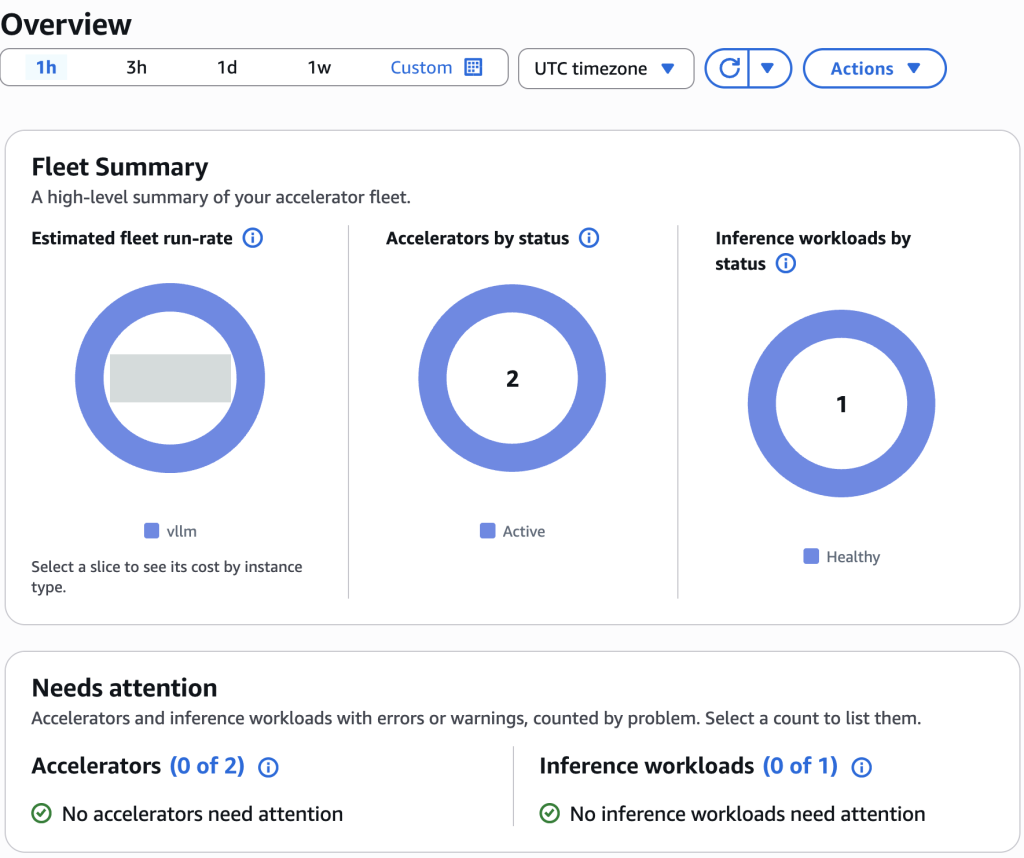
Figure 1: The accelerated compute insights Overview (estimated run-rate redacted).
Which workload holds which GPU
The Accelerators view draws one hexagon per GPU and lists each one with its instance, accelerator type, instance type, and cluster. Select a GPU for its utilization, temperature, memory, and power charts. Select the workload for the cluster, instances, and accelerators it runs on, plus its vLLM engine settings.
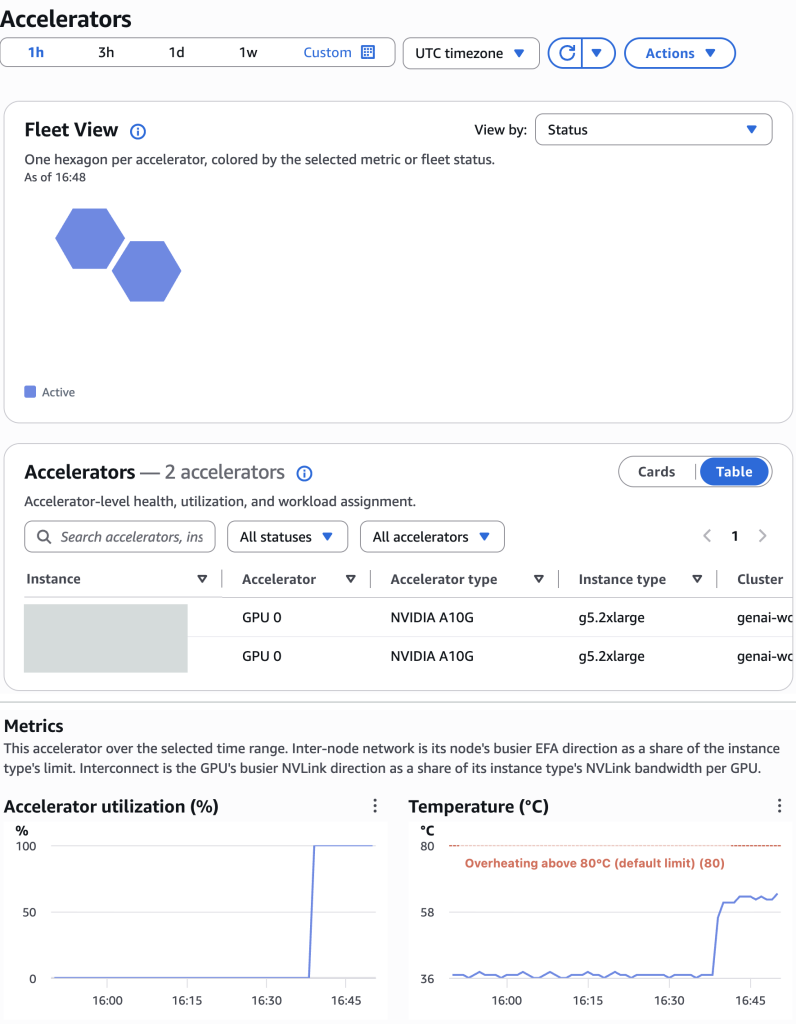
Figure 2: The Accelerators fleet view and table, above the charts for one GPU as a load test starts (instance IDs redacted).
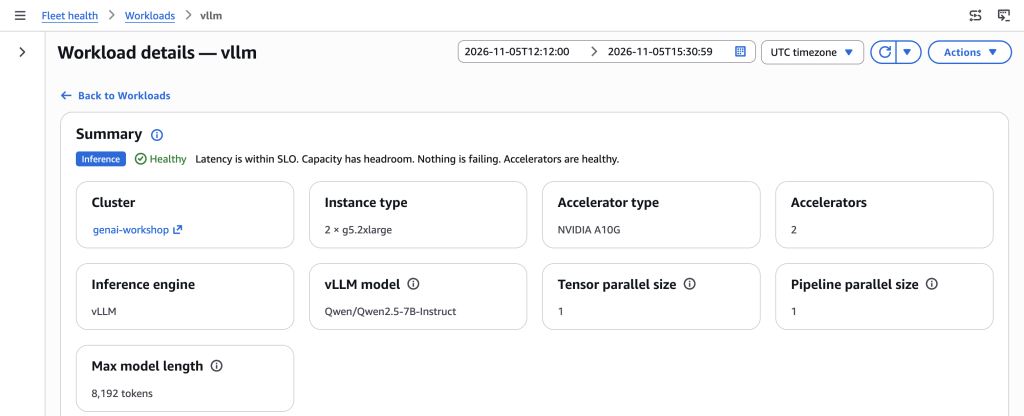
Figure 3: The vllm workload summary
To see which workload holds a given GPU, open its resource details.
Attribution by namespace
For an answer across the fleet, query the DCGM metrics in Query Studio. The add-on collects them with Kubernetes labels attached, so you don’t need a join. On these series, namespace and pod name the workload using the GPU, and the add-on also attaches it as resource attributes such as @resource.k8s.workload.name. Group by UUID as well, because gpu is a per-node index that repeats across nodes:
avg by ("@resource.k8s.node.name", UUID, namespace, pod) (
  DCGM_FI_DEV_GPU_UTIL{"@resource.k8s.cluster.name"="<cluster-name>"}
)
To find GPUs that are allocated and idle, count the same series below a utilization threshold:
count by (namespace) (
  DCGM_FI_DEV_GPU_UTIL{"@resource.k8s.cluster.name"="<cluster-name>", namespace!=""} < 5
)
Between load tests, this returns {namespace=”inference”} 2: both GPUs held, neither working, the run-rate unchanged.
Finding GPUs that cost money without doing work
A GPU can be expensive and idle at the same time. Between two of our test runs, a Mistral-7B-Instruct-v0.3 deployment held both GPUs for almost nine hours with its model loaded and no requests. Utilization read 0 percent. Memory did not move: each GPU still showed about 21,300 MiB in use, the same as under load, because vLLM reserves its share of GPU memory at startup; we set that share to 92 percent. Power fell only to 89 and 95 watts, about 37 percent of the load figure. A view based on memory or on pod allocation counts both GPUs as busy.
When a workload holds GPUs with no traffic, its card in accelerated compute insights shows No traffic and lists the idle instances with the estimated hourly cost you could save.
To find it in PromQL, group DCGM metrics by the workload holding the GPU:
sum by ("@resource.k8s.workload.name") (
  DCGM_FI_DEV_POWER_USAGE{"@resource.k8s.cluster.name"="<cluster-name>"}
)
On our cluster this returned one series for the idle Mistral deployment, about 184 watts across both GPUs, against roughly 500 watts when a model was serving a load test. Swap in DCGM_FI_DEV_GPU_UTIL with max for utilization per workload. Label names that start with @ need double quotes.
A GPU with no workload at all is the other kind of waste. Those series arrive with node labels and no pod or workload labels:
DCGM_FI_DEV_GPU_UTIL{"@resource.k8s.cluster.name"="<cluster-name>", "@resource.k8s.workload.name"=""}On our cluster it returned both GPUs, at 0 percent, for the few minutes before the first model started. We ran one workload at a time; on a cluster shared by several teams, the same grouping splits power, utilization, and memory by namespace and pod.
Is the workload using the GPUs well, and what changes with the model
Our first load test sent 128 concurrent completion requests to Qwen2.5-7B-Instruct for three hours, each generating exactly 512 tokens. Utilization went to 100 percent when the load started and stayed there. Temperature held near 60 degrees Celsius, under the 80-degree overheating line, and power near 265 watts. Memory read about 93 percent throughout, because vLLM reserves GPU memory at start; we set that share to 92 percent.
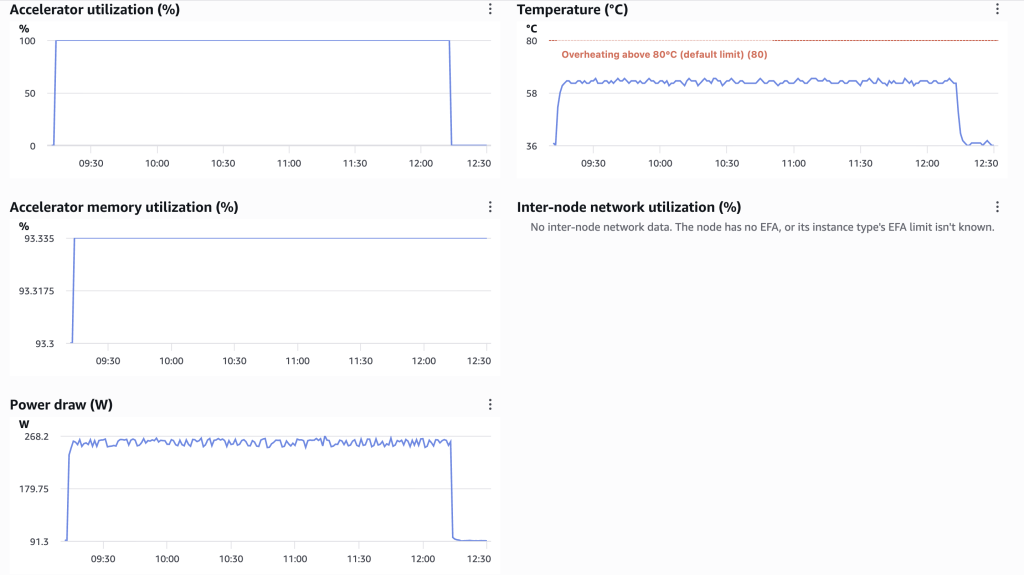
Figure 4: Accelerator charts for the vllm workload over the three-hour load test
Omni shows the application side of the same workload. Averaged over a window that includes a few idle minutes, its inference workloads inventory shows vllm serving 5.23 requests and about 2,676 tokens per second, with a P95 time to first token of 0.21 seconds and no faults.
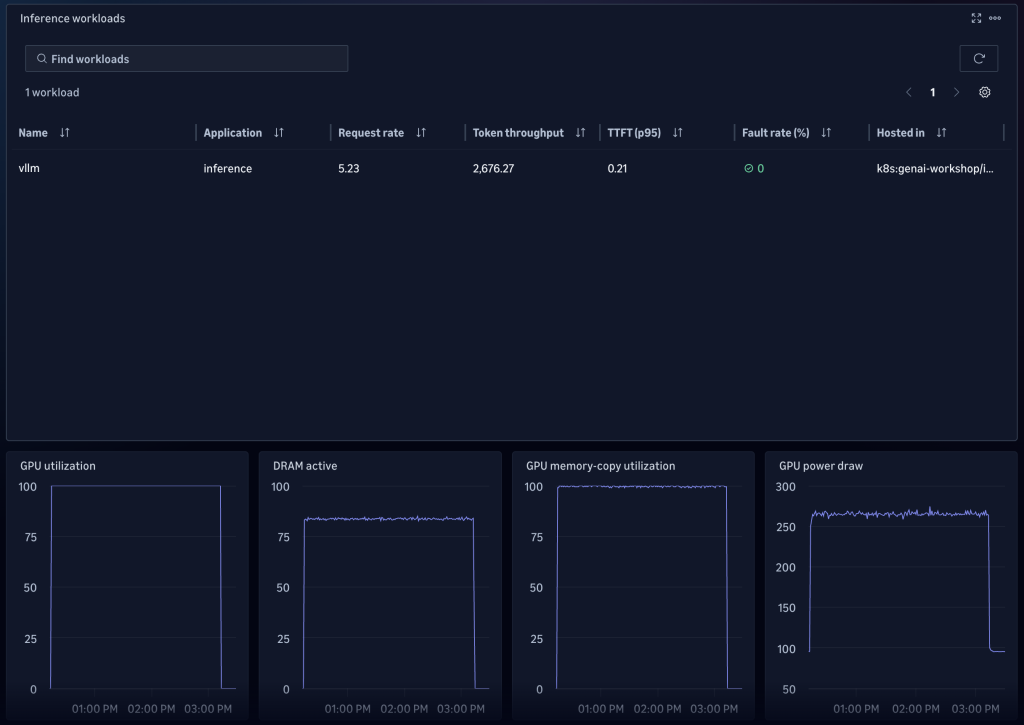
Figure 5: The Omni inference workloads inventory for vllm
Utilization alone can mislead for inference. It measures the share of time the GPU has work running, not how much of its compute that work uses. The workload Efficiency panel shows the difference: while utilization read 100 percent, estimated model compute utilization held near 24 percent and DRAM activity near 84 percent.
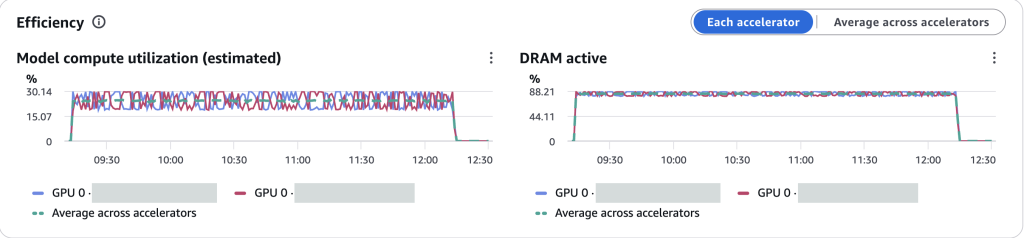
Figure 6: The Efficiency panel, for each GPU and the average across both (instance IDs redacted)
Memory was far busier than compute, which is typical for token generation: each new token reads the model weights and the key-value (KV) cache from GPU memory. DRAM activity is a DCGM hardware counter. Model compute is an estimate: if vLLM’s model FLOPs utilization (MFU) metrics are off, as in our test, it is two times the model’s active parameters times prompt and generated tokens per second, divided by the GPU’s peak FLOP/s.
Comparing two models on the same GPUs
The model you deploy changes how the GPU is used, so we ran the same load against two models, one after the other on the same two GPUs: 128 concurrent requests with 512 output tokens each, for one hour per model, first Mistral-7B-Instruct-v0.3 and then Qwen2.5-7B-Instruct. We used the same vLLM image and settings for both, including the 92 percent GPU memory budget and a maximum length of 8,192 tokens; only the model differed. We ran each model as its own Kubernetes Deployment, so each one got its own workload name in the PromQL labels and its own workload page in accelerated compute insights. The numbers below cover the steady part of each run.
| Measure | Mistral-7B-Instruct-v0.3 | Qwen2.5-7B-Instruct |
|---|---|---|
| Tokens per request, input and output | 12 and 512 | 10 and 512 |
| Output tokens per second | 2,869 | 2,942 |
| Median request latency | 22.8 seconds | 22.4 seconds |
| GPU energy per output token | 174 millijoules | 173 millijoules |
| KV cache capacity | 54,992 tokens | 104,304 tokens |
| KV cache in use, average and peak | 32.6 and 48.4 percent | 17.0 and 25.0 percent |
| vLLM container CPU, average | 1.07 cores | 1.23 cores |
| vLLM container memory, working set | About 2.1 GiB | 4.5 to 5.3 GiB |
| Requests waiting or preempted | None | None |
Request latency comes from a logging sidecar in front of vLLM; the other rows come from vLLM, DCGM, and container metrics.
At this load, the two models performed almost the same. Throughput differed by less than 3 percent, median latency by less than half a second, and GPU energy per output token by 1 millijoule. In accelerated compute insights, both showed 100 percent utilization and DRAM activity near 84 percent. Model compute read near 25 percent for both, as the estimate predicts for two similar-sized models at the same token rate. Both ran just above the console’s 50-millisecond target for p95 time per output token.
The workload around the GPU did change with the model. The same prompts came to 12 input tokens with Mistral and 10 with Qwen, because each model has its own tokenizer. Qwen’s vLLM container used about 15 percent more CPU and more than twice the memory on the host. Those are node resources that matter when you size instances or pack pods onto a node. Because both runs used the same instances, the estimated cost per million tokens in accelerated compute insights differed only as much as throughput did, by less than 3 percent.
The difference was headroom. Within its memory budget, vLLM gives the KV cache what is left after the model weights and working buffers, and the two models store different amounts per token: about 128 KiB for Mistral and 56 KiB for Qwen. Qwen’s cache held almost twice as many tokens. At startup, vLLM reported room for about 6.7 full-length requests of 8,192 tokens with Mistral and 12.7 with Qwen, and under load Mistral used about twice the share of its cache for the same requests. With more concurrent requests or longer prompts, Mistral would fill its cache first, and vLLM would start queuing or preempting requests. We didn’t test that load, so treat it as the signal to watch, not a measured limit. If two models meet your quality bar, compare them this way before you choose: throughput per GPU sets the cost per token, and KV cache headroom sets how much more load the same GPUs take before you add replicas. We didn’t measure output quality.
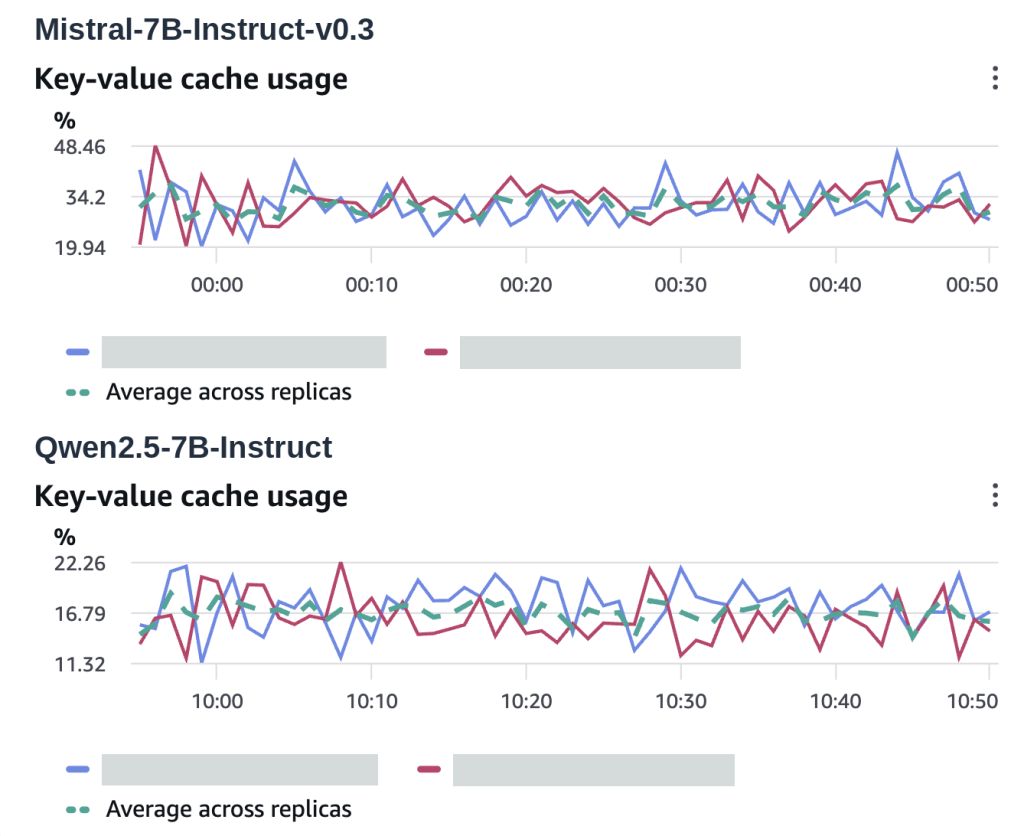
Figure 7: KV cache usage for each replica during the steady part of each run, Mistral above and Qwen below. The two charts use different scales (pod names redacted)
When a GPU misbehaves
Start with the hardware. The add-on’s DCGM exporter collects a health status for each GPU, a count of XID errors (error reports from the GPU driver), error-correcting code (ECC) counters, PCIe replay counts, and clock event reasons. None of these appear in the classic ContainerInsights namespace; they exist only in the PromQL store. This query returns each GPU with a health warning or failure:
max by (UUID, health_watch, health_error_code) (
  DCGM_EXP_GPU_HEALTH_STATUS{"@resource.k8s.cluster.name"="<cluster-name>"} != 0
)
DCGM evaluates eleven watches per GPU, including POWER, THERMAL, MEM, PCIE, and SM, so one unhealthy GPU can return several series. During our three-hour load test, one came back: a warning (value 10) on the POWER watch, with health_error_code DCGM_FR_CLOCK_THROTTLE_POWER, on one of the two GPUs. Both pods served about the same number of requests at about the same latency, but that GPU ran about 6 degrees Celsius warmer and drew up to 281 watts against its 300-watt power limit, compared with 268 watts on the other. Its slowdown counters stayed at 0, and DCGM’s guidance for this code is to monitor power conditions. The GPU can still run work.
Health series carry the same namespace, pod, and workload labels as the utilization metrics, so you can name the affected workload by adding them to the query:
max by (UUID, health_watch, health_error_code, namespace, pod) (
  DCGM_EXP_GPU_HEALTH_STATUS{"@resource.k8s.cluster.name"="<cluster-name>"} != 0
)
The console shows the same link. Open the GPU’s resource details in accelerated compute insights. Workloads it serves lists the workloads on that GPU and their status. What it runs on lists the accelerator type, driver, memory, instance type, Amazon EKS node group, and cluster, with links to the Amazon Elastic Compute Cloud (Amazon EC2) instance and the Kubernetes node.
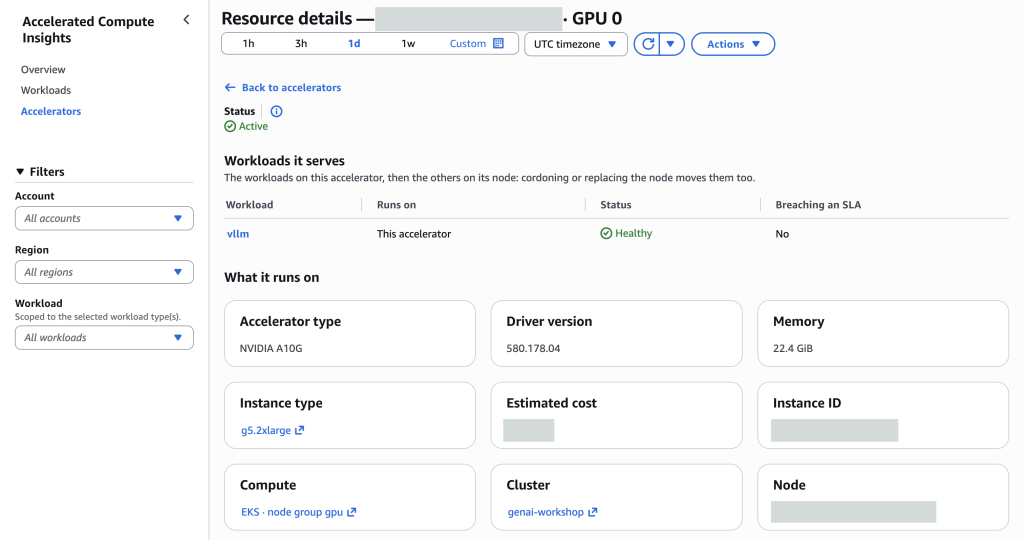
Figure 8: Resource details for one GPU (instance ID, node name, and estimated cost redacted)
XID errors show up in two places. The GPU driver writes each XID message to the node’s kernel log, and the add-on sends node logs, including kernel messages, to the /aws/containerinsights/<cluster-name>/host log group in CloudWatch Logs. The DCGM exporter also counts them, and this query returns each GPU that reported an XID error in the exporter’s count window:
max by ("@resource.host.id", "gpu", "@resource.k8s.pod.name") (
  DCGM_EXP_XID_ERRORS_COUNT{"@resource.cloud.resource_id"="arn:aws:eks:<region>:<account-id>:cluster/<cluster-name>"}
) > 0
During the three-hour load test, our GPUs reported no XID errors in either source.
To get notified, use these queries as the condition of a CloudWatch alarm that evaluates PromQL. Keep the host, GPU, and pod labels in the query, and the alarm tracks each returned series as a separate contributor. A contributor moves to ALARM after it stays in the results for the pending period and back to OK after the recovery period, and the alarm stays in ALARM while any contributor is. We tested the pattern with an alarm on GPU utilization above 80 percent, evaluated every 60 seconds with a 60-second pending period and a 300-second recovery period:
max by ("@resource.host.id", "gpu", "@resource.k8s.pod.name") (
  DCGM_FI_DEV_GPU_UTIL{"@resource.cloud.resource_id"="arn:aws:eks:<region>:<account-id>:cluster/<cluster-name>"}
) > 80
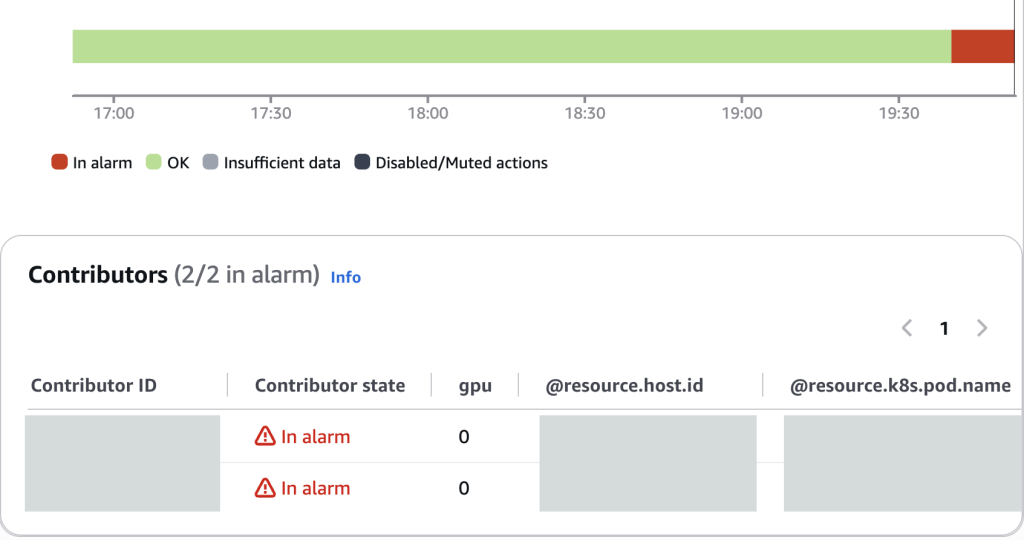
Figure 9: The alarm state timeline and its Contributors table, one row for each GPU with its host and pod (contributor IDs, hosts, and pod names redacted)
We pushed the GPUs past the threshold on purpose, and the Contributors table read 2 of 2 in alarm, one vllm pod on each host. In a real incident, the same labels point at the pod to open first. Add @resource.k8s.workload.name to the by clause and each contributor also names its workload. We ran the health and XID queries in Query Studio but didn’t create alarms on them.
Our test cluster had one GPU on each node, so this post doesn’t cover GPU-to-GPU interconnect errors or network problems between nodes in distributed inference.
Set it up on your cluster
Important: The sample code and configurations in this post are provided for illustration purposes and are not intended for use in production environments without thorough review, testing, and validation. Adapt these examples to meet your organization’s specific security, compliance, and operational requirements.
We started from the sample-genai-on-eks repository in aws-samples, an Amazon EKS cluster serving vLLM on GPU instances. Everything in this post comes from the Amazon CloudWatch Observability add-on for Amazon EKS, which deploys two DaemonSets: the CloudWatch agent on all Linux nodes and the DCGM exporter on GPU nodes.
Install the add-on
Check which versions your cluster supports before you pin one:
aws eks describe-addon-versions \
  --addon-name amazon-cloudwatch-observability \
  --kubernetes-version 1.36
At the time of writing, v7.0.1-eksbuild.1 is the default version; we checked Amazon EKS 1.29, 1.36, and 1.37. We ran our tests on v7.0.0-eksbuild.1, the default at the time, and the settings below have the same defaults in both. The add-on has its own configuration schema, which is not the same as the Helm chart keys. Retrieve the schema for the version you’re installing, with every default:
aws eks describe-addon-configuration \
  --addon-name amazon-cloudwatch-observability \
  --addon-version v7.0.1-eksbuild.1
Our cluster ran this configuration:
{
  "containerInsights": {"enabled": true},
  "containerLogs": {"enabled": true},
  "dcgmExporter": {"enabled": true},
  "otelContainerInsights": {
    "enabled": true,
    "solutions": {"vllm": {"enabled": true}}
  }
}
otelContainerInsights.enabled is the setting that matters here. It defaults to false, and it is the pipeline behind the PromQL series in this post: the DCGM series we queried carry @instrumentation.cloudwatch.solution set to k8s-otel-container-insights. The vllm solution already defaults to true; we set it so the dependency is visible, since it scrapes KServe InferenceService predictor pods and any container running a vLLM image, which is how the vllm:* metrics arrive with no application changes.
Legacy Container Insights (containerInsights.enabled) defaults to true, and we left it on, so the add-on also published GPU metrics to the classic ContainerInsights namespace. That helps you validate the new pipeline before you migrate, but you publish the same metrics twice. If you don’t need the classic metrics, consider turning it off and checking that your views still work; we didn’t test that.
The DCGM exporter (dcgmExporter.enabled, default true) is where DCGM_FI_DEV_GPU_UTIL and the health metrics come from. It schedules onto GPU instance types through a node affinity rule in the schema that lists them.
Container logs (containerLogs.enabled) are also on by default, and they do two things worth knowing about. They collect your container logs into /aws/containerinsights/<cluster-name>/application, which is ingest and storage you pay for alongside the GPUs. They also collect node logs, including kernel messages, into /aws/containerinsights/<cluster-name>/host, which is where the GPU driver writes the detail behind an XID error. Set “containerLogs”: {“enabled”: false} if you don’t want either. Confirm the collector pods are running:
kubectl get pods -n amazon-cloudwatchClean up
To avoid ongoing charges, remove what you deployed: delete any second model Deployment you created for the comparison, delete the CloudWatch alarms, remove the Amazon CloudWatch Observability add-on from your cluster, and, if you created a cluster for this walkthrough, delete it along with its Amazon Virtual Private Cloud (Amazon VPC) resources. Its log groups under /aws/containerinsights/<cluster-name>/ remain afterward with no retention period, so delete them or set one. If you keep the add-on running, standard Amazon CloudWatch pricing applies; see the Amazon CloudWatch pricing page for current rates.
Conclusion
The three questions from the start of this post have answers in one place. To see who uses the GPUs and what sits idle, group GPU metrics by workload, and look for GPUs that hold memory with 0 percent utilization or carry no workload label. To see whether a workload uses its GPUs well, compare utilization with the model compute estimate and KV cache headroom, and compare models on the same load before you pick one. To troubleshoot, alarm on PromQL queries that keep the GPU, host, and pod labels, and add XID and health-status queries for hardware faults.
We tested on g5.2xlarge instances with A10G GPUs, one GPU per node. We didn’t test other instance families or multi-node inference, so validate the configuration on the instance types you run. To get started, install the add-on on your Amazon EKS cluster and run the queries in this post.