AWS Open Source Blog
Set an Alert in Open Distro for Elasticsearch
中文版 – One of Elasticsearch’s primary use cases is log analytics: you collect logs from your infrastructure, transform each log line into JSON documents, and send those documents to Elasticsearch’s _bulk API. A transformed log line contains many fields, each containing values. For instance, an Apache Web Log line has a source IP address field, a request URL field, and a status code field (among others). When you use Elasticsearch for log analytics, you use Kibana’s visualizations to graph the values in these fields, or query them directly. A common use case is to build dashboards to monitor your infrastructure. For example, you can graph the count of HTTP 5xx status codes, watch, and react to changes in the graph. If you see a sudden jump in 5xx codes, you likely have an issue with one of your servers.
Of course, it’s a manual process to monitor Kibana directly. Open Distro for Elasticsearch’s Alerting plugin lets you monitor the data in your Elasticsearch indexes automatically. You work with Monitors — scheduled jobs — that have Triggers — conditions — that you set for when the monitor should send an alert. An Alert is a notification that the trigger’s conditions have been met. When a trigger fires, the monitor takes an Action (sends a message to your Destination).
This post uses a simulated IoT device farm to generate and send data to Open Distro for Elasticsearch. Devices have sensors on them which simulate different patterns of floating-point values. We’ll use a MonotonicSensor, whose value constantly increases, to force a breach in an alert that I’ll set up. If you’re interested in following along, you can download the simulator on GitHub (and please contribute! I’m excited to build on this basic starting point).
Simulator Overview
Sensors
The core class for the simulator is the Sensor. Sensors have a report method. When called, this method updates and returns the value of the sensor. There are several subclasses for Sensor:
- SineSensor: Produces a sine wave, based on the current timestamp.
- ConstSensor: Produces a constant value. The class includes a random “fuzz” factor to drift around a particular value.
- DriftingSensor: Allows continuous, random drift with a starting value
- MonotonicSensor: Increments its value by a constant delta, with random fuzz.
All sensors have a value name, a value, and a UUID. The report function includes a timestamp, the value name, the UUID of the sensor, and the sensor’s value.
Devices
For this post, I’ll create a collection of devices, simulating IoT devices in a field, measuring the temperature and humidity, and sending the CPU of the device. Devices are collections of sensors. They have a report method that recursively calls the report methods for all of their sensors, returning a collection of the sensor reports.
I’ve set the CPU sensor of one device to drift constantly upward, simulating a problem in the device. You can see the intended “bad behavior” in the following line graph:

In the coming sections, we’ll set up for an alert to occur at 90% CPU.
Set Up Your Destination
When you create alerts in Open Distro for Elasticsearch, you create one or many monitors and one or many Destinations. You can use your Slack channel or Amazon Chime as your destination. Or, you can set up a custom webhook (a URL) to receive messages. If you choose a custom webhook, you will set up headers and a message body, and the plugin will POST its message to the destination URL.
I’m using Slack to receive alerts from my Open Distro for Elasticsearch cluster (also see the Chime documentation for instructions on how to create a chat room and get its webhook URL, if you prefer Chime.)
Note: You should set up your destination before you create your monitors.
This post assumes that you already have Open Distro for Elasticsearch deployed, with data in it to form the basis of your monitors and alerts. (If you don’t, see getting up and running with Open Distro for Elasticsearch.) Open Kibana in your browser and click the Alerting tab. At the top of the window, click Destinations, then click Add Destination.

In the Add Destination dialog, give your destination a Name, choose the Type of destination, and set the Webhook URL. Click Create. You can set as many destinations as you like to facilitate the distribution of alerts to all interested parties.

Set Up a Monitor
Monitors in Open Distro for Elasticsearch allow you to specify a value that you want to monitor. You can select the value either graphically or by specifying an Elasticsearch query. You define a monitor first and then define triggers for the value that you are monitoring.
Click the Monitors tab and then Create Monitor.

Give your monitor a Name. I named my monitor Device CPUs. You can set the frequency to one of the predefined intervals, or use a cron expression for more fine-grained control. I chose Every 1 minute.
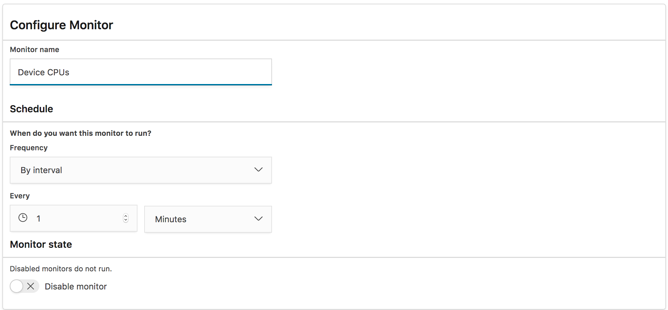
In the Define Monitor section of the page, you specify the value that you want to monitor. I’ve chosen the logs-* index and will monitor the max value of the CPU field. This doesn’t create a trigger yet, we’ll do that in the next step.

Click Create. This will bring you to the Define Trigger page.
Create a Trigger
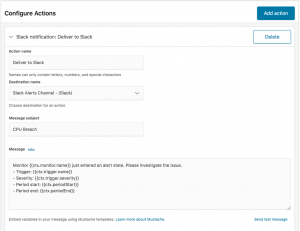
When you create a trigger, you specify the threshold value for the field you’re monitoring. When the value of the field exceeds the threshold, the Monitor enters the Active state. I created a trigger called “CPU Too High,” with a threshold value of 90, and a severity level of 1.

Once you’ve set the trigger conditions, you set the action or actions that the alerting plugin performs.
Scroll down the page to add actions. I added one action, to send a message to my Slack destination, including the monitor name, trigger, severity, and the period over which the alarm has been active. You can use Mustache templates to create a template for the message you’ll receive.
Scroll down and click Create at the bottom of the page:
Results
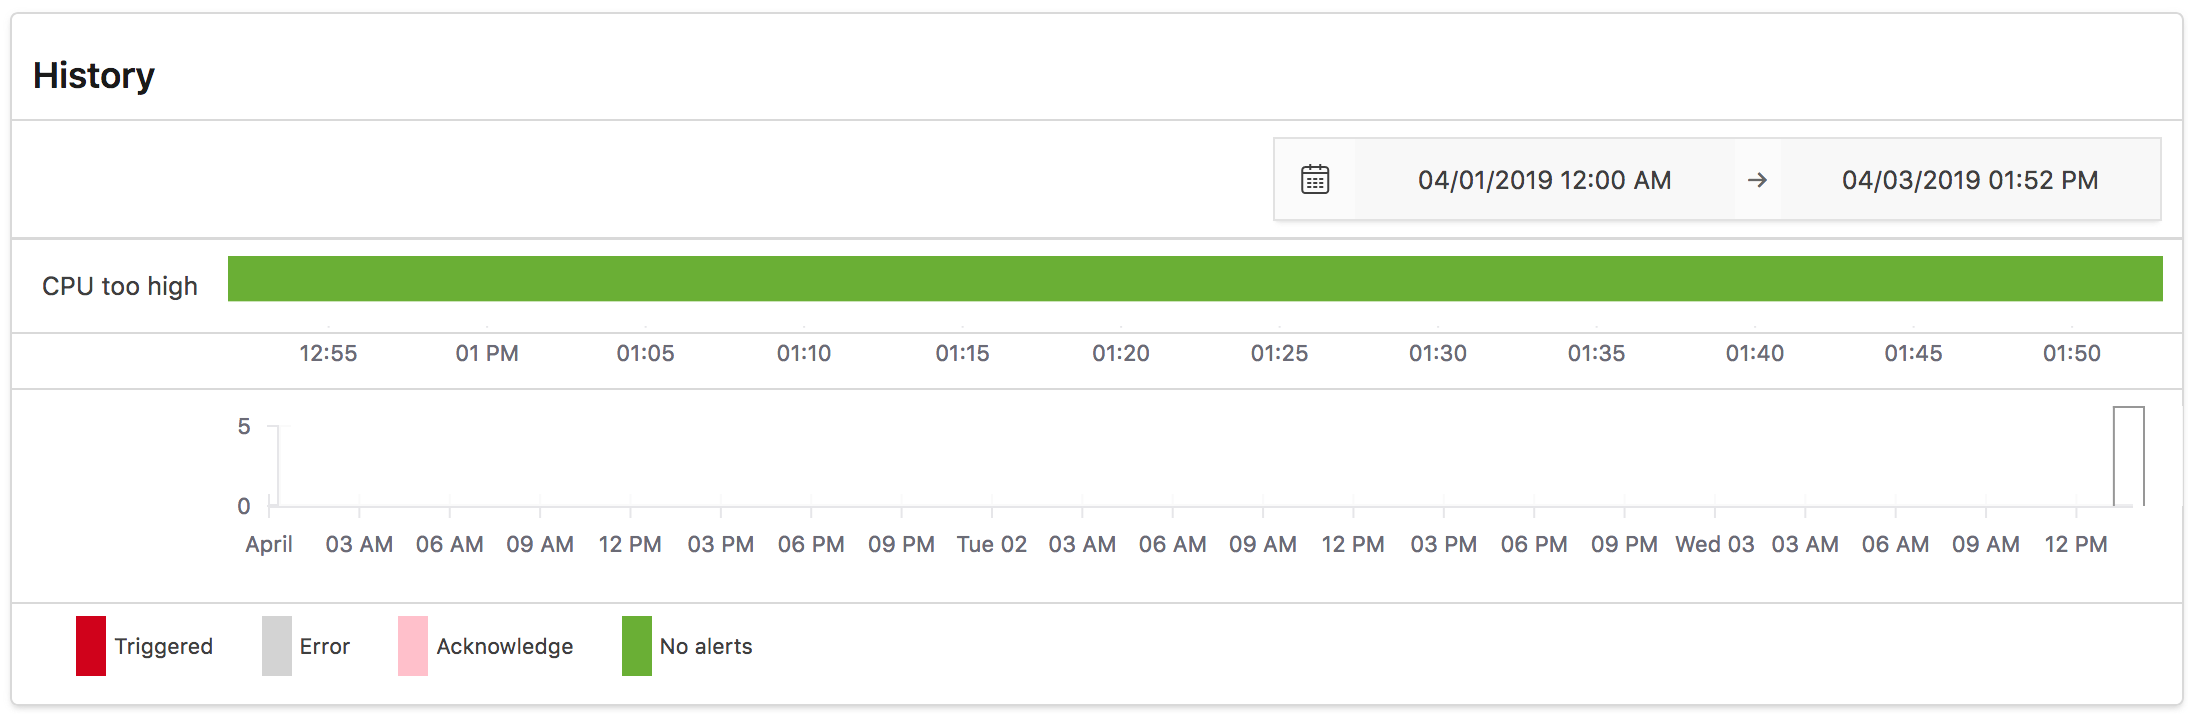
When you return to the Alerting Dashboard, you will see your alert in the “Enabled” state. Alerts can be in a variety of states. “Enabled” signals that the monitor query is successful, and that the trigger is not engaged. There’s also a useful timeline display showing your monitor’s alerting history:
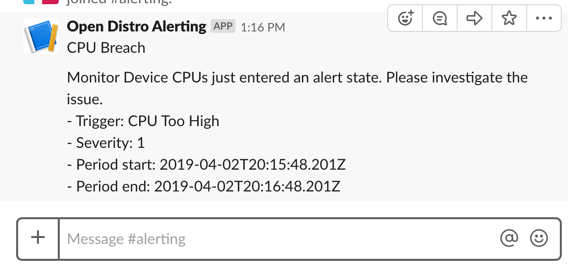
To send the alert into the “Active” state, I sent simulated sensor data for a failing device whose CPU ramped up from 50% to 100%. When it hit 90%, I received the following message in Chime:
Open Distro for Elasticsearch’s Alerting plugin lets you monitor the critical data in your log files so that you can respond quickly when things start to go wrong. By identifying KPIs, setting thresholds, and distributing alerts to your first responders, you can improve your response time for critical issues.
Have an issue or question? Want to contribute? You can get help and discuss Open Distro for Elasticsearch on our forums. You can file issues here.