AWS News Blog
Amazon Managed Service for Prometheus Is Now Generally Available with Alert Manager and Ruler

|
At AWS re:Invent 2020, we introduced the preview of Amazon Managed Service for Prometheus, an open source Prometheus-compatible monitoring service that makes it easy to monitor containerized applications at scale. With Amazon Managed Service for Prometheus, you can use the Prometheus query language (PromQL) to monitor the performance of containerized workloads without having to manage the underlying infrastructure required to scale and secure the ingestion, storage, alert, and querying of operational metrics.
Amazon Managed Service for Prometheus automatically scales as your monitoring needs grow. It is a highly available service deployed across multiple Availability Zones (AZs) that integrates AWS security and compliance capabilities. The service offers native support for PromQL as well as the ability to ingest Prometheus metrics from over 150 Prometheus exporters maintained by the open source community.
With Amazon Managed Service for Prometheus, you can collect Prometheus metrics from Amazon Elastic Compute Cloud (Amazon EC2), Amazon Elastic Container Service (Amazon ECS), and Amazon Elastic Kubernetes Service (Amazon EKS) environments using AWS Distro for OpenTelemetry (ADOT) or Prometheus servers as collection agents.
During the preview, we contributed the high-availability alert manager to the open source Cortex project, a project providing horizontally scalable, highly available, multi-tenant, long-term store for Prometheus. Also, we reduced the price of metric samples ingested by up to 84 percent, and supported collection of metrics for AWS Lambda applications by ADOT.
Today, I am happy to announce the general availability of Amazon Managed Service for Prometheus with new features such as alert manager and ruler that support Amazon Simple Notification Service (Amazon SNS) as a receiver destination for notifications from Alert Manager. You can integrate Amazon SNS with destinations such as email, webhook, Slack, PagerDuty, OpsGenie, or VictorOps with Amazon SNS.
Getting Started with Alert Manager and Ruler
To get started in the AWS Management Console, you can simply create a workspace, a logical space dedicated to the storage, alerting, and querying of metrics from one or more Prometheus servers. You can set up the ingestion of Prometheus metrics to this workspace using Helm and query those metrics. To learn more, see Getting started in the Amazon Managed Service for Prometheus User Guide.

At general availability, we added new alert manager and rules management features. The service supports two types of rules: recording rules and alerting rules. These rules files are the same YAML format as standalone Prometheus, which may be configured and then evaluated at regular intervals.
To configure your workspace with a set of rules, choose Add namespace in Rules management and select a YAML format rules file.
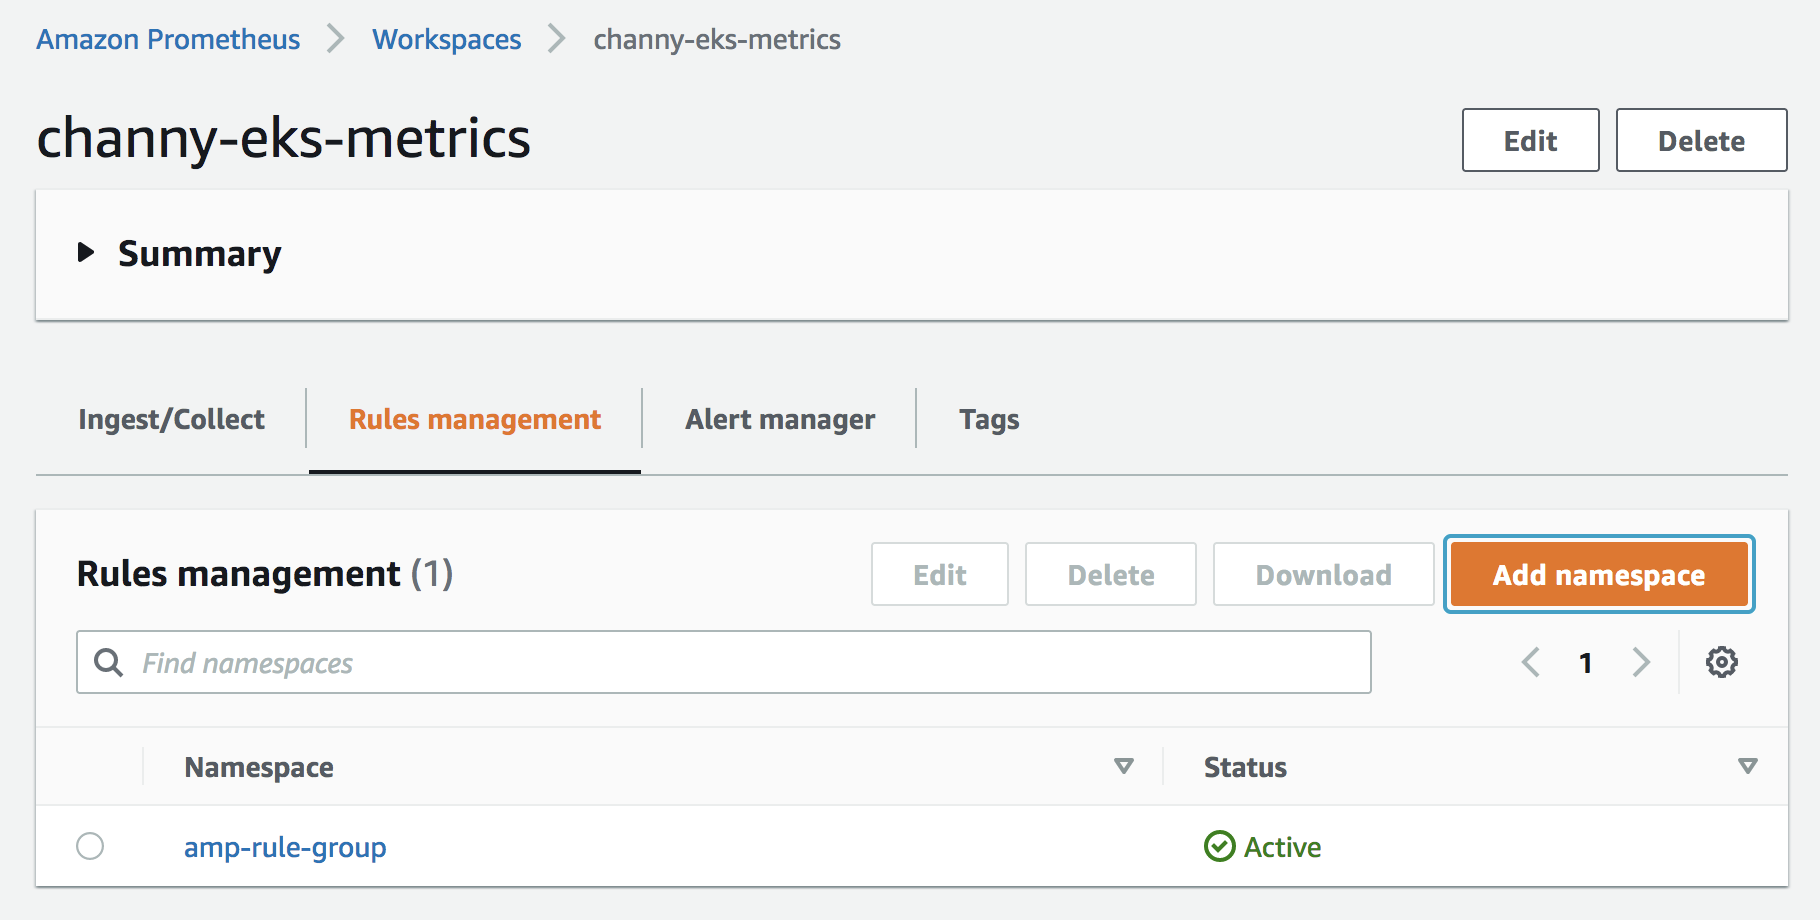
An example rules file would record CPU usage metrics in container workloads and triggers an alert if CPU usage is high for five minutes.

Next, you can create a new Amazon SNS topic or reuse an existing SNS topic where it will route the alerts. The alertmanager routes the alerts to SNS and SNS routes to downstream locations. Configured alerting rules will fire alerts to the Alert Manager, which deduplicate, group, and route alerts to Amazon SNS via the SNS receiver. If you’d like to receive email notifications for your alerts, configure an email subscription for the SNS topic you had.

To give Amazon Managed Service for Prometheus permission to send messages to your SNS topic, select the topic you plan to send to, and add the access policy block:
{
    "Sid": "Allow_Publish_Alarms",
    "Effect": "Allow",
    "Principal": {
        "Service": "aps.amazonaws.com"
    },
    "Action": [
        "sns:Publish",
        "sns:GetTopicAttributes"
    ],
    "Resource": "arn:aws:sns:us-east-1:123456789012:Notifyme"
}
If you have a topic to get alerts, you can configure this SNS receiver in the alert manager configuration. An example config file is the same format as Prometheus, but you have to provide the config underneath an alertmanager_config: block in for the service’s Alert Manager. For more information about the Alert Manager config, visit Alerting Configuration in Prometheus guide.
alertmanager_config:
  route:
    receiver: default
    repeat_interval: 5m
  receivers:
    name: default
    sns_configs:
      topic_arn: "arn:aws:sns:us-east-1:123456789012:Notifyme"
      sigv4:
        region: us-west-2
      attributes:
        key: severity
        value: "warning"
You can replace the topic_arn for the topic that you create while setting up the SNS connection. To learn more about the SNS receiver in the alert manager config, visit Prometheus SNS receiver on the Prometheus Github page.
To configure the Alert Manager, open the Alert Manager and choose Add definition, then select a YAML format alert config file.

When an alert is created by Prometheus and sent to the Alert Manager, it can be queried by hitting the ListAlerts endpoint to see all the active alerts in the system. After hitting the endpoint, you can see alerts in the list of actively firing alerts.
$ curl https://aps-workspaces.us-east-1.amazonaws.com/workspaces/ws-0123456/alertmanager/api/v2/alerts
GET /workspaces/ws-0123456/alertmanager/api/v2/alerts HTTP/1.1
Host: aps-workspaces.us-east-1.amazonaws.com
X-Amz-Date: 20210628T171924Z
...
[
    "receivers": [
      {
        "name": "default"
      }
    ],
    "startsAt": "2021-09-24T01:37:42.393Z",
    "updatedAt": "2021-09-24T01:37:42.393Z",
    "endsAt": "2021-09-24T01:37:42.393Z",
    "status": {
      "state": "unprocessed",
    },
    "labels": {
      "severity": "warning"
    }
  }
]
A successful notification will result in an email received from your SNS topic with the alert details. Also, you can output messages in JSON format to be easily processed downstream of SNS by AWS Lambda or other APIs and webhook receiving endpoints. For example, you can connect SNS with a Lambda function for message transformation or triggering automation. To learn more, visit Configuring Alertmanager to output JSON to SNS in the Amazon Managed Service for Prometheus User Guide.
Sending from Amazon SNS to Other Notification Destinations
You can connect Amazon SNS to a variety of outbound destinations such as email, webhook (HTTP), Slack, PageDuty, and OpsGenie.
- Webhook – To configure a preexisting SNS topic to output messages to a webhook endpoint, first create a subscription to an existing topic. Once active, your HTTP endpoint should receive SNS notifications.
- Slack – You can either integrate with Slack’s email-to-channel integration where Slack has the ability to accept an email and forward it to a Slack channel, or you can utilize a Lambda function to rewrite the SNS notification to Slack. To learn more, see How to integrate Amazon Managed Service for Prometheus with Slack.
- PagerDuty – To customize the payload sent to PagerDuty, customize the template that is used in generating the message sent to SNS by adjusting or updating
template_filesblock in your alertmanager definition. To learn more, see Using Amazon Managed Service for Prometheus Alert Manager to receive alerts with PagerDuty.
Available Now
Amazon Managed Service for Prometheus is available today in nine AWS Regions: US East (N. Virginia), US East (Ohio), US West (Oregon), Europe (Frankfurt), Europe (Ireland), Europe (Stockholm), Asia Pacific (Singapore), Asia Pacific (Sydney), and Asia Pacific (Tokyo).
You pay only for what you use, based on metrics ingested, queried, and stored. As part of the AWS Free Tier, you can get started with Amazon Managed Service for Prometheus for 40 million metric samples ingested and 10 GB metrics stored per month. To learn more, visit the pricing page.
If you want to learn about AWS observability on AWS, visit One Observability Workshop which provides a hands-on experience for you on the wide variety of toolsets AWS offers to set up monitoring and observability on your applications.
Please send feedback to the AWS forum for Amazon Managed Service for Prometheus or through your usual AWS support contacts.
Learn More
To learn more and see Amazon Managed Service for Prometheus in action, register for our webinar and join us on October 6, 2021 at 9:30am PST.
– Channy