AWS News Blog
Join the Preview – Amazon Managed Service for Prometheus (AMP)

|
Observability is an essential aspect of running cloud infrastructure at scale. You need to know that your resources are healthy and performing as expected, and that your system is delivering the desired level of performance to your customers.
A lot of challenges arise when monitoring container-based applications. First, because container resources are transient and there are lots of metrics to watch, the monitoring data has strikingly high cardinality. In plain language this means that there are lots of unique values, which can make it harder to define a space-efficient storage model and to create queries that return meaningful results. Second, because a well-architected container-based system is composed using a large number of moving parts, ingesting, processing, and storing the monitoring data can become an infrastructure challenge of its own.
Prometheus is a leading open-source monitoring solution with an active developer and user community. It has a multi-dimensional data model that is a great fit for time series data collected from containers.
Introducing Amazon Managed Service for Prometheus (AMP)
Today we are launching a preview of Amazon Managed Service for Prometheus (AMP). This fully-managed service is 100% compatible with Prometheus. It supports the same metrics, the same PromQL queries, and can also make use of the 150+ Prometheus exporters. AMP runs across multiple Availability Zones for high availability, and is powered by CNCF Cortex for horizontal scalability. AMP will easily scale to ingest, store, and query millions of time series metrics.
The preview includes support for Amazon Elastic Kubernetes Service (Amazon EKS) and Amazon Elastic Container Service (Amazon ECS). It can also be used to monitor your self-managed Kubernetes clusters that are running in the cloud or on-premises.
Getting Started with Amazon Managed Service for Prometheus (AMP)
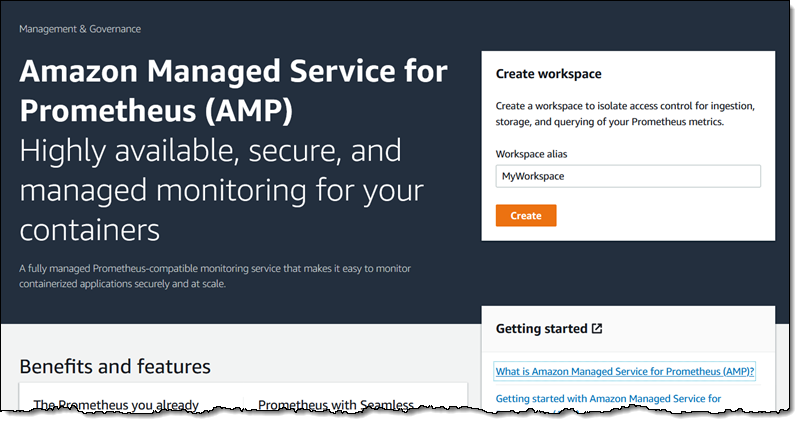
After joining the preview, I open the AMP Console, enter a name for my AMP workspace, and click Create to get started (API and CLI support is also available):
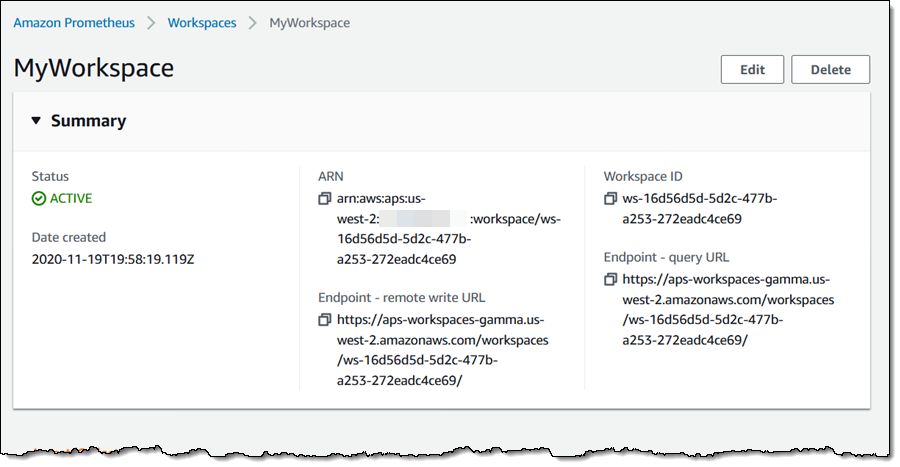
My workspace is active within a minute or so. The console provides me with the endpoints that I can use to write data to my workspace, and to issue queries:
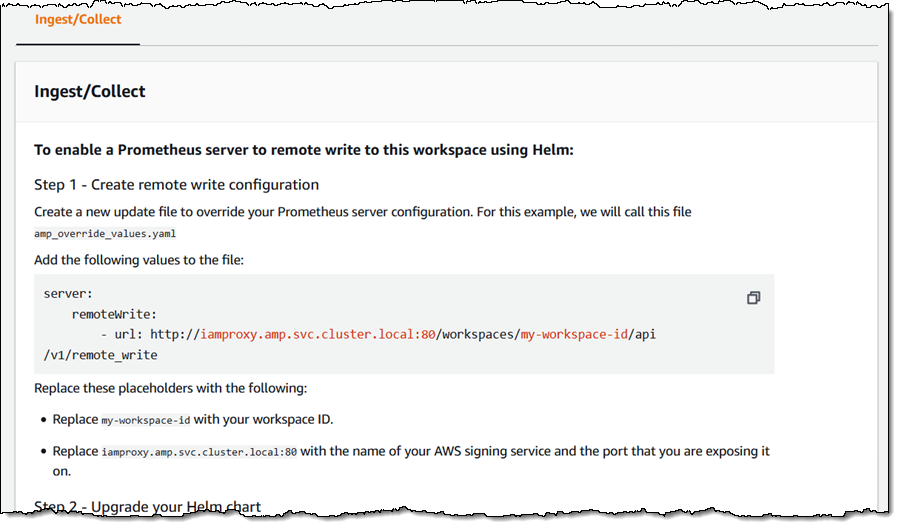
It also provides guidance on how to configure an existing Prometheus server to send metrics to the AMP workspace:
I can also use AWS Distro for OpenTelemetry to scrape Prometheus metrics and send them to my AMP workspace.
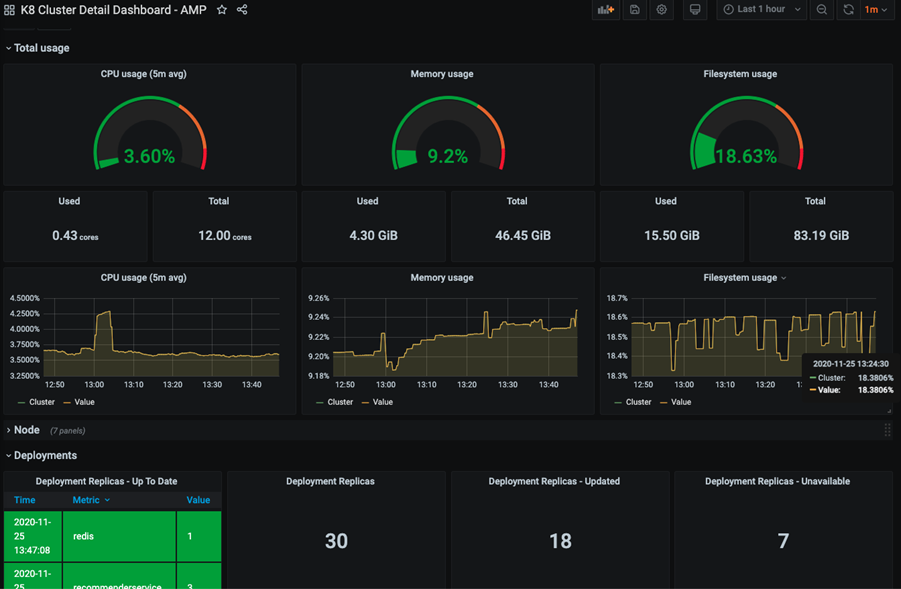
Once I have stored some metrics in my workspace, I can run PromQL queries and I can use Grafana to create dashboards and other visualizations. Here’s a sample Grafana dashboard:
Join the Preview
As noted earlier, we’re launching Amazon Managed Service for Prometheus (AMP) in preview form and you are welcome to try it out today.
We’ll have more info (and a more detailed blog post) at launch time.
— Jeff;