AWS Cloud Operations Blog
AWS Systems Manager Incident Manager integration with Amazon CloudWatch
This is the second post in a two-part series about AWS Systems Manager Incident Manager. In the first post, we covered onboarding steps like creating contacts, an escalation plan, and a response plan in Incident Manager. In this post, we discuss the integration between Incident Manager and Amazon CloudWatch and how Incident Manager components manage an incident. We also show you how to do post-incident analysis.
Many customers use Amazon CloudWatch to monitor their AWS environments. Incident Manager integrates with Amazon CloudWatch to start an incident when an alarm reaches a defined threshold. Start by creating an alarm.
- From the left navigation pane of the Amazon CloudWatch console, choose Alarms, and then choose Create alarm.
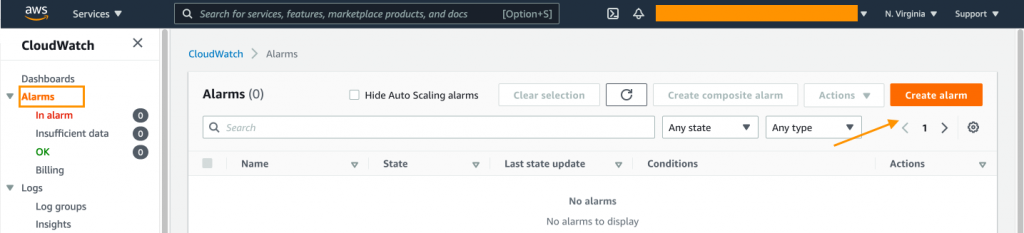
Figure 1: Alarms page
- You will be directed to a page to specify metrics and conditions. Choose Select metric to display a list of metrics you can monitor. Choose EC2, and then choose Per-Instance Metrics.

Figure 2: Select metric
- Find the instance you created for part 1 of this series, choose the CPUUtilization metric, and then choose Select metric. For Period, enter a custom value of 120 seconds.

Figure 3: CPUUtilization metric
- You can now specify the condition of this CloudWatch alarm. Under Conditions, define a threshold value of 85 and then choose Next.
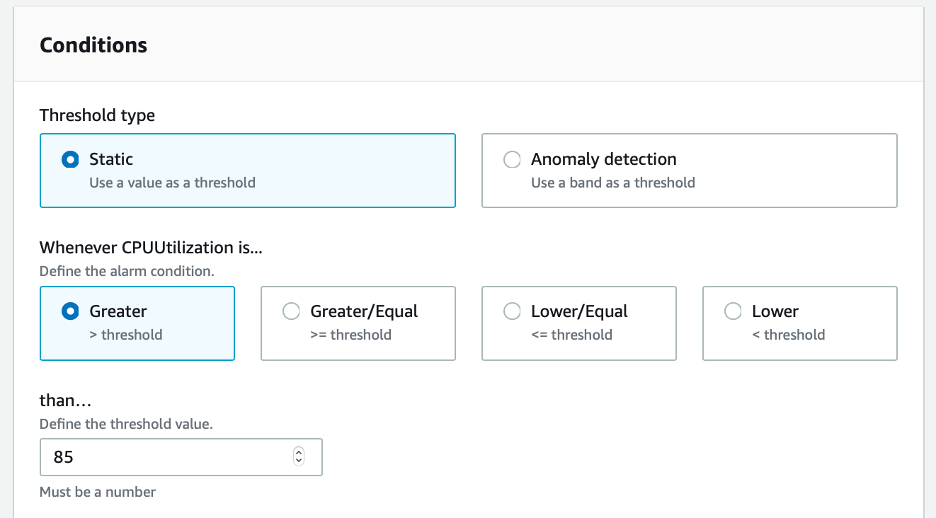
Figure 4: Conditions
- Now configure what happens when the alarm is triggered. Under Systems Manager action, choose Create incident. In the Response Plan search field, enter
EC2HighCPU. Choose Next.

Figure 5: Systems Manager action
- Enter a name for the alarm, choose Next, and then choose Create alarm.
You have now finished setting up a CloudWatch alarm that will trigger an incident.
Incident management with Incident Manager
To simulate the incident of high CPU utilization, use the stress command. Connect to your EC2 instance and use the following commands to install stress:
sudo amazon-linux-extras install epel -y
sudo yum install stress -y
Now use the following command to impose some stress on your EC2 instance. It runs three CPU stressors for 300 seconds.
sudo stress --cpu 3 --timeout 300
When the CPU utilization hits 85%, you will find a new incident on the Incident Manager page of the Systems Manager console. At this time, the primary responder you added in the Contacts section will receive a message about the incident. If you created a chat channel, it will receive an incident notification.
![The cpu-incident-1 page shows the incident has an impact of Medium and a duration of 1 minute. It includes a CPUUtilization graph.]](https://d2908q01vomqb2.cloudfront.net/972a67c48192728a34979d9a35164c1295401b71/2021/05/11/Screen-Shot-2021-05-11-at-5.08.58-AM-1024x537.png)
Figure 6: cpu-incident-1
When your responder gets engaged, they can view the metrics and runbook related to the incident. Because you created a manual runbook, you can choose Resume after you complete each step.

Figure 7: ec2-cpu-util-runbook
After you have finished all the steps in the runbook and have confirmed that the incident has been mitigated, you can choose Resolve incident. The Timeline tab displays the events related to the incident.
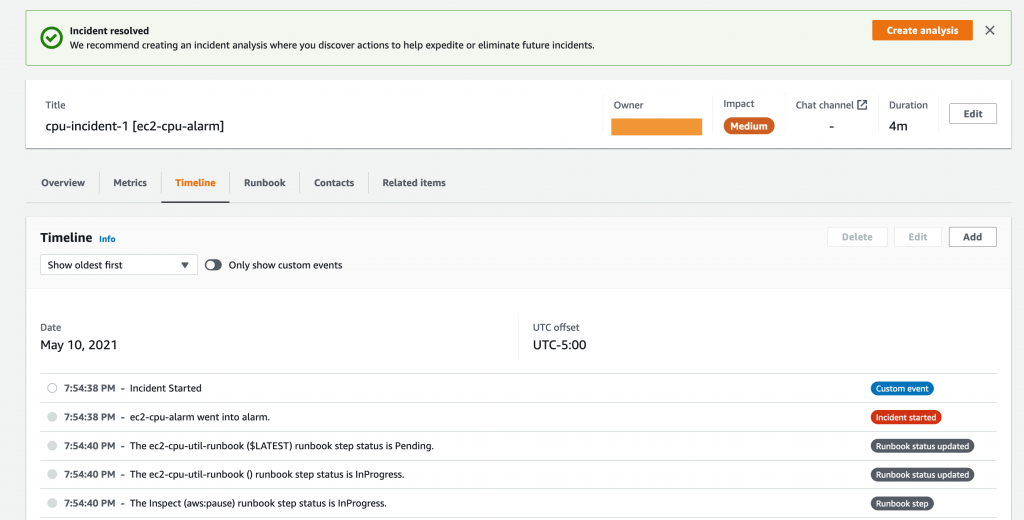
Figure 8: Timeline tab
Post-incident analysis
It helps to see every incident as an opportunity to learn and improve your processes. Your team becomes stronger by thinking through the issue, identifying its root cause, assessing how it could have been prevented, and assigning clear follow-up action items. Root cause analysis requires you to ask the right questions and carefully note any assumptions. If an incident involves multiple teams, it’s a good practice to use post-incident analysis to coordinate among the teams rather than allowing each (decentralized) team to focus on their own services.
Incident Manager provides a feature you can use to document the post-incident analysis. When you resolve the incident, a banner shown in Figure 8 displays a Create analysis button.

Figure 9: Create analysis
For Template, choose AWSIncidents-PostIncidentAnalysisTemplate, and then choose Create.
You will be prompted to answer a list of questions related to the detection, diagnosis, and mitigation of this incident. This step can be extremely valuable for teams, to help them reflect on what went well and what could be improved for incident prevention and mitigation.

Figure 10: Post-incident analysis for cpu-incident-1
Incident Manager integrates with AWS Systems Manager OpsCenter to help you track incidents and post-incident action items from a central place. It also synchronizes with popular third-party incident management tools such as Jira Service Desk and ServiceNow.
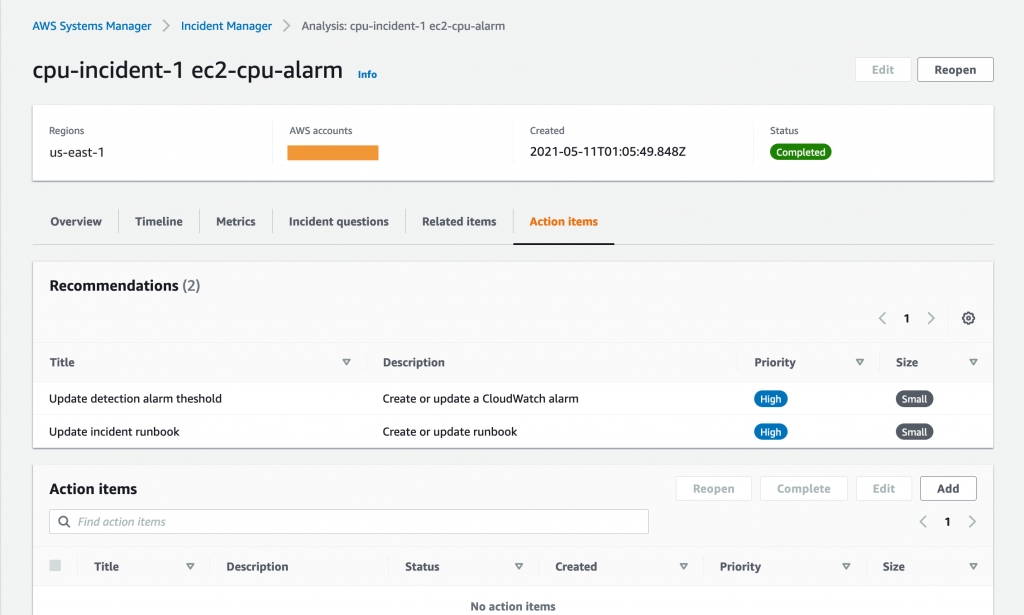
Figure 11: Action items
Cleaning up
To avoid ongoing charges in your AWS account, clean up the resources you created in this walkthrough. To delete the CloudWatch alarm, select the alarm you created, choose Actions, and then choose Delete. To terminate an EC2 instance, select the EC2 instance, choose Instance state, and then choose Terminate instance.
To delete the resources created from Part 1 of this series, including contacts, response plan and escalation plan, please refer to Incident Manager User Guide.
Conclusion
In this blog post, we showed you how to use Incident Manager with Amazon CloudWatch to prepare for and mitigate incidents. Post-incident analysis is key to successful incident management. Incident Manager allows you to perform this analysis by providing templates and mechanisms to help your team reflect on the wins and growth areas after incidents occur. For more information about Incident Manager, see the AWS Systems Manager User Guide.