AWS Partner Network (APN) Blog
Tuning Your Amazon FreeRTOS Application for Maximum Performance
 |
 |
 |
By Shawn Prestridge, Senior FAE at IAR Systems
What we have seen as a trend over the last several years is a relatively sharp increase of companies needing to integrate their embedded applications with the cloud.
When companies build embedded applications that work with Amazon Web Services (AWS), and possibly leveraging Amazon FreeRTOS, they look to IAR Systems to provide highly-optimized development tools.
IAR Systems is an AWS Partner Network (APN) Standard Technology Partner that supplies software tools and services for embedded development, enabling companies to create the products of today and the innovations of tomorrow.
In this post, we discuss how IAR Systems provides not only the tools but the insights to help customers deliver optimized products faster.
Optimization Made Easy
By their very nature, embedded applications have to be very tightly written because the microcontrollers used in embedded designs are very resource-constrained. Traditionally, engineers have tried to hand-optimize their code, which is similar to making the engineer do not only their job, but also the compiler’s job.
However, project schedules seem to get tighter every year, so we need to rely on the compiler to effectively optimize the code. In the case of most compilers, this leaves you with only two choices: optimizing for size or for speed.
Interestingly enough, these two optimizations are often antipodal—fast code tends to be rather bloated in size, and small code tends to be a bit poky in execution. Why is this? The short answer is the cost of branch instructions.
The branch instruction is one of the most expensive operations that a microcontroller can perform, both in terms of the number of cycles needed to execute the instruction and, parenthetically, the amount of power needed to complete the instruction. This creates a bit of a problem in the embedded world: we need to fit our code on our selected microcontroller while being very responsive to external stimuli.
How do we address this problem to get fast execution speed, but also not have to spend money on a massive microcontroller or external flash? The answer is in how we structure the application.
Your application’s source code files can generally be classified into three categories: tuned program files, generic program files, and driver library files. We’ll start by defining what each of them is, and you will be able to decide very quickly into which category each of your source files belongs.
Tuned program files are any pieces of source for which speed is paramount; this could be communications protocols, it could be GUI code to respond to user inputs, or anything where you need a really snappy response from your application. Obviously, you want to optimize these files for speed so that you get maximum performance.
Generic program files would be source that does pretty much everything else: system housekeeping, monitoring a battery, etc. Generic program files really don’t care about the speed of execution; they just need to execute at some point to provide some functionality to your application. Since we don’t care how fast these functions execute, we want to optimize the files for size so we can get the size of our overall application to a point that it will fit in our selected device.
Before we talk about the last category, let’s look at an overall picture of how we are structuring the application.

Figure 1 – Separate your performance-sensitive code and optimize for speed. Everything else can be optimized for size.
What About Peripheral Driver Libraries?
What can we do about these device driver files? Well, that’s a great question and like all questions in engineering, the answer is “It depends.” These driver libraries are generally provided by the semiconductor company to make a simple, easy-to-use API for accessing core functionality of the microcontroller.
The problem is the intellectual property (IP) of these libraries isn’t your own, and although you have full access to the source of these functions, you would have to invest quite a bit of time becoming familiar enough with this code to safely make changes to it. This is where things get a bit dicey.
Before I explain why, let’s address a common misperception and then you’ll see why that has a great deal of bearing on optimizing driver code. Some developers refuse to use compiler optimizations because they believe that doing so introduces bugs in their code. However, we like to say that only correct code is optimized correctly.
When you crank up the optimization, the compiler gets very picky about the C and C++ language semantics in your code. Therefore, when you use clever C and C++ constructions, the compiler has to assume that you know all the implications of using that construction and it optimizes accordingly. However, if you don’t fully understand all the “dark corners” of the C language, you can wind up with code that works fine at low optimization but seems to misbehave at higher optimization.
If you run into this situation, you can try lowering the optimization on groups of files until you find the offending group, and then drill into that group by lowering the optimization on individual files until you find the file causing the problem. You can then use pragmas to lower the optimization level on individual functions until you hone in on the one causing the problem.
If your toolchain has a great support network, you can send disassemblies of your code with optimization on and off to the support folks to see what the problem is. More often than not, it will be one of these subtle language rules reaching up to bite you, but the support folks can suggest how to rework that section so it compiles the way you expect.
So what does this have to do with driver code?
Some driver libraries are written in a very clean and disciplined style that adheres tightly to good coding practices. If you’re fortunate enough to be using one of these, you can crank up the optimization on the driver library because such code is less likely to have issues running at high optimization. If you’re not so lucky, then you have two choices: you can either run the driver code with the default optimization level (the one with which it was most likely tested by the vendor), or you can take up the mantle and fix the code yourself.
Of course, this means that you’ll also be responsible for the maintenance of that code, and that may prove to be too much of an onus for your organization, particularly if you have a tight project schedule. Therefore, what you do with such code is entirely up to you and subject to your appetite for risk.
Some customers choose to completely rewrite driver libraries so they own the IP of it and fully understand its implications. In such cases, they may only refer to the original library as a “suggested reference guide” for building their driver code. This takes the most work, but ensures that your project ultimately has the minimal amount of “technical debt” to the code.
Testing Optimization Efficiency
Now that we know the principles of what to do with our application, how do we turn that into practice and see what it can do for us? Let’s choose an AWS demo in IAR Embedded Workbench and see.
I’ve selected one for the TI CC3220SF Launchpad board. If we build this demo using the default optimization of Low (which only makes very safe code transformations in IAR Embedded Workbench), we see that we are using:

Interpreting this, we have about 70k of code in flash along with about 10.5k of constants and variable initializer data in flash. This means our total flash size is 70k + 10.5k = 80.5k. The RAM footprint is about 112k. As an experiment, let’s turn up the optimization to High and choose size optimization. We now see:

So the total amount of flash we’re using drops by about 7.5k and the RAM usage goes up slightly. If we optimize for speed, we get a bit of a surprise:

As expected, the speed optimization is bigger than the size optimization, but the speed optimization is actually *smaller* than the low optimization. Both size and speed optimization are using compressed initializers for variable data, but the amount they save in this compression actually outstrips the size penalty of the initializer versus using low optimization.
We can clearly see the benefits we get from size optimization by examining the output of the compiler and linker. However, we need to run the code on the device to get a better feel for how speed optimization can help our device be more responsive. To that end, let’s look at the application with the global project optimization set to its default of Low:

Figure 2 – Optimizations can be controlled at the project-level, group-level, or file-level.
In main.c, there is a function named prvWifiConnect( ) which connects to the access point specified in aws_credentials.h. Let’s set breakpoints at the top and bottom of this function to see how long it takes to connect.
In a future blog post, we’ll show you how to use some very interesting Serial Wire Output (SWO) features to do more sophisticated debugging, but for the time being we’ll concentrate on looking at the CYCLECOUNT and CCSTEP registers in the Registers window (when debugging in IAR Embedded Workbench, click View-Registers-Registers1).
When we hit the breakpoint at the top of the function, we see the CYCLECOUNT register is 35,842,077 cycles. This may vary depending on what version of IAR Embedded Workbench for Arm you are using, as well as how long it takes to connect to your access point. If we run to the second breakpoint, the CYCLECOUNT is now 214,529,594; the difference between the two breakpoints is in the CCSTEP register of 178,687,517:
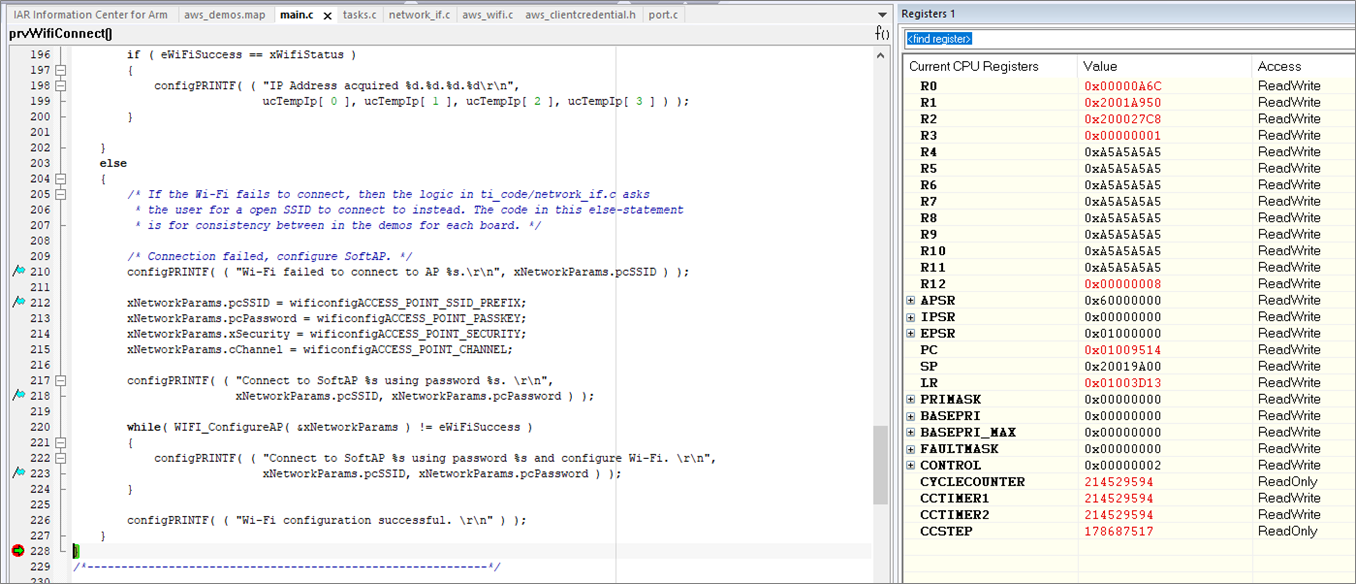
Figure 3 – Speed of WiFi initialization with no optimization.
Now, let’s see what cranking up the optimization in main.c can do for us. If we go to the Workspace window in IAR Embedded Workbench and right-click the main.c file and choose Options, we can navigate over to the Category of C/C++ Compiler and choose Optimizations. Click the “Override inherited settings” box, then choose High-Speed for the optimization:

Figure 4 – Cranking up the optimization for speed on main.c.
Click OK, then do a Download and Debug. The compiler will automatically recompile main.c with our new settings and re-link the application.
Repeat the previous experiment. This time, we see that CYCLECOUNT is 35,365,358 when we hit the first breakpoint. Again, your value may vary, but the difference is about a half million cycles to this point between High-Speed and Low optimization which is about a 1.3% improvement. Then, let’s run to the second breakpoint and we’ll see the power of speed optimization on the connection protocol:

Figure 5 – Speed of WiFi initialization with high-speed optimization.
Our CCSTEP register was 178,687,517 between the two breakpoints at Low optimization, but with High-Speed, our CCSTEP is now 98,221,869. That’s almost twice as fast!
Let’s put what we’ve learned to the test and see how our application looks when we compile tuned program files for speed and generic program files for size.
By watching the content in the Workspace window, we see three top-level groups: application_code, config_files, and lib. If we drill into these, we quickly discover the config_files are just what the name implies—header files that configure how our application runs, so there isn’t any optimization we can perform on this group.
If we drill into application_code, we see some subgroups called common_demos and ti_code. Looking at the names of the files in these groups, there are quite a few that strongly imply that they are code for communications or for IO that our human users can see (and therefore must have snappy response times):

Figure 6 – Code groupings can be easily seen (and optimizations adjusted) in the Workspace window.
We can therefore optimize these for speed. To do so, we follow what we did for main.c: right-click on their top-level group (application_code) and choose Options, then override the project settings and set the optimization for High-Speed:
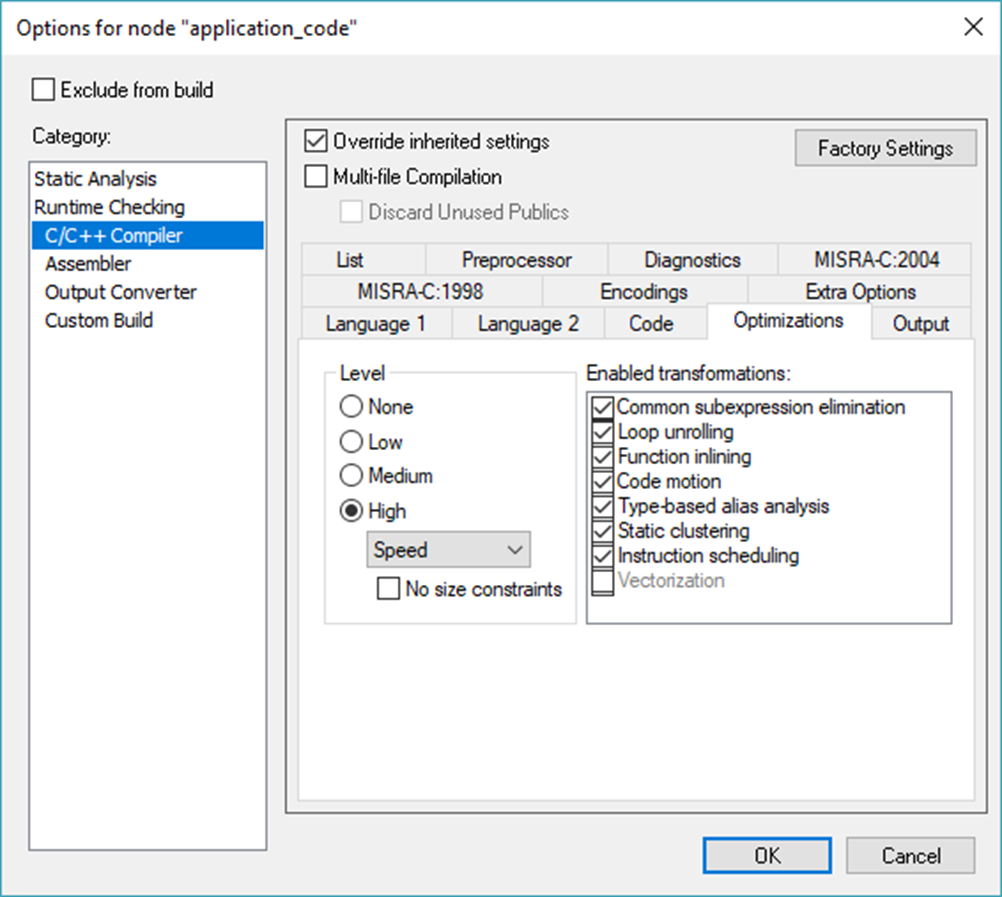
Figure 7 – Setting the application_code group’s optimization level to high speed.
If we look into the lib group, we see a subgroup called aws, which contains AWS-provided code like Amazon FreeRTOS and AWS IoT Greengrass. There are a few subgroups such as wifi, secure_sockets, and mqtt that do a bit of communication, so maybe we’d want to optimize those for speed.
For simplicity, let’s set the aws subgroup to optimize for size, and then leave the third_party subgroup at the default optimization because we may not know who wrote that code and therefore may not want to risk cranking up its optimization.
Once we have all of our optimization settings configured the way we like, we can look at the bottom of the map file to examine the results:

Conclusion
We’ve seen that we can get some real speed improvements, but how does this size compare to our original Low optimization? Our total flash size is 71,774 + 1,845 = 73,619. When we had Low optimization, our total flash size was 70,244 + 10,657 = 80,901, so we saved 7,282 bytes or about 9 percent.
Of course, you can play around with different groupings of source to determine which one gives you the best fit of size versus speed for your application, but even a “high-level” application of this technique can realize very dramatic results in your code.
Next Steps
Now that we understand how to optimize our code properly, we’ll take a look at how to write clean code that optimizes correctly and efficiently by leveraging code analysis tools. These tools will also help us avoid some of the common mistakes in programming.
Be sure to read the next blog post which will cover this topic because it will save you quite a bit of development time!
The content and opinions in this blog are those of the third party author and AWS is not responsible for the content or accuracy of this post.
.
|
IAR Systems – APN Partner Spotlight
IAR Systems is an APN Standard Technology. They are a future-proof supplier of software tools and services for embedded development, enabling companies worldwide to create the products of today and the innovations of tomorrow.
Contact IAR Systems | Solution Overview
*Already worked with IAR Systems? Rate this Partner
*To review an APN Partner, you must be an AWS customer that has worked with them directly on a project.