AWS Cloud Financial Management
Introducing Intelligent Cost Explanations in AWS Cost Explorer
We’re excited to announce intelligent cost explanations in AWS Cost Explorer, powered by Amazon Q Developer. Click the ‘Analyze with Amazon Q’ button on any cost report to instantly receive detailed explanations covering your spending patterns, cost drivers, and anomalies, along with guidance to discover optimization opportunities through follow-up questions, all based on your exact filters and time-period. Whether you’re investigating a cost spike, preparing for a budget review, or trying to understand your forecast, you can now get the full story behind your cost data without leaving Cost Explorer.
Why intelligent cost explanations in Cost Explorer
Cost Explorer gives you the tools to visualize your costs across services, accounts, regions, and time periods. But once you have the cost report in front of you, understanding what the data means often requires additional investigation: identifying which services drove a change, whether a spike is an anomaly or expected growth, and what optimization actions to consider. ‘Analyze with Amazon Q’ bridges this gap by turning any Cost Explorer cost report into a starting point for intelligent analysis. Instead of interpreting charts and tables on your own, you can now ask Amazon Q to explain what you’re looking at and guide you toward actionable next steps.
This capability works across historical, current, and forecasted time horizons. When you’re viewing historical data, Amazon Q explains what drove past cost changes. When you’re viewing forecasted costs, Amazon Q delivers detailed forecast explanations covering projected spending trajectories, the services expected to drive future costs, and the factors influencing your projections, so you can understand not just what you’ll spend but why. And when your cost report spans both historical and forecasted periods, Amazon Q provides a unified explanation covering both. All explanations are delivered through a conversational interface where you can ask follow-up questions to explore any aspect in greater detail.
How it works
When you open Cost Explorer and configure a cost report using your preferred filters, date range, and groupings, you’ll notice the ‘Analyze with Amazon Q’ button. Clicking it triggers Amazon Q to analyze the complete context of your current cost report, including all applied filters, the selected time-period, and the cost data displayed.
Amazon Q then delivers a comprehensive explanation in its chat panel covering:
- Cost Trends: How your spending has changed over the selected period, with month-over-month or day-over-day breakdowns highlighting the most significant movements.
- Top Cost Drivers: Which services, accounts, or resources are contributing most to your costs, with specific dollar amounts and percentage contributions.
- Anomalies: Unexpected spending changes detected in your data, with explanations of their likely causes and whether they represent normal business fluctuations or require attention.
- Optimization Guidance: Through follow-up questions, Amazon Q guides you to discover relevant optimization opportunities, connecting your cost patterns to actionable recommendations.
The explanation adapts to what you’re viewing. If you’ve filtered to a specific service, the analysis focuses on that service. If you’re looking at a broad organizational view, the analysis covers your top cost drivers across all services. The depth and specificity of the explanation matches the scope of your cost report.
Continuing the conversation
After receiving your initial analysis, you can ask follow-up questions to explore any finding in greater detail. For example, if Amazon Q identifies that your Amazon Relational Database Service (RDS) costs increased 25% last month, you can ask “What specific RDS instances drove this increase?” or “Are there rightsizing opportunities for my RDS instances?” Amazon Q maintains the full context of your conversation, allowing you to progressively drill deeper into your cost data.
Amazon Q draws from extensive knowledge beyond what’s visible in your current cost report. This includes pricing data, budget information, anomaly detection data, and cost optimization recommendations. This means follow-up questions can take you beyond the initial cost report into areas like Savings Plans coverage, Reserved Instance utilization, or service-specific optimization strategies.
Example walkthrough
Let’s walk through a typical scenario. James, a FinOps lead, opens Cost Explorer on the first Monday of the month to review his team’s spending from the previous month. He sets the date range to last month, groups by service, and sees the familiar bar chart and table. But this month, the total looks higher than expected and he’s not sure why.
Step 1: Getting the full picture
Instead of manually clicking through filters to investigate, James clicks ‘Analyze with Amazon Q,’ as shown in Figure 1. Within seconds, Amazon Q analyzes his current cost report and delivers a comprehensive breakdown in the chat panel, as shown in Figure 2. The analysis identifies a total spend of $71,924.18 for May 2026 with an average daily run rate of $2,126 (excluding May 1st billing spike) across 62 services. Amazon Q highlights Amazon RDS as the top cost driver at $38,454 (53.5% of total spend), followed by Amazon Elastic Compute Cloud (EC2) at $8,704 (12.1%) and AWS Support at $4,476 (6.2%). It also identifies daily spending patterns with specific dates showing elevated costs, explaining the root causes including AWS Support Business billing cycles, AWS CloudTrail events, and an Amazon Bedrock anomaly.

Figure 1: James clicks “Analyze with Amazon Q” on his May 2026 cost report in Cost Explorer.
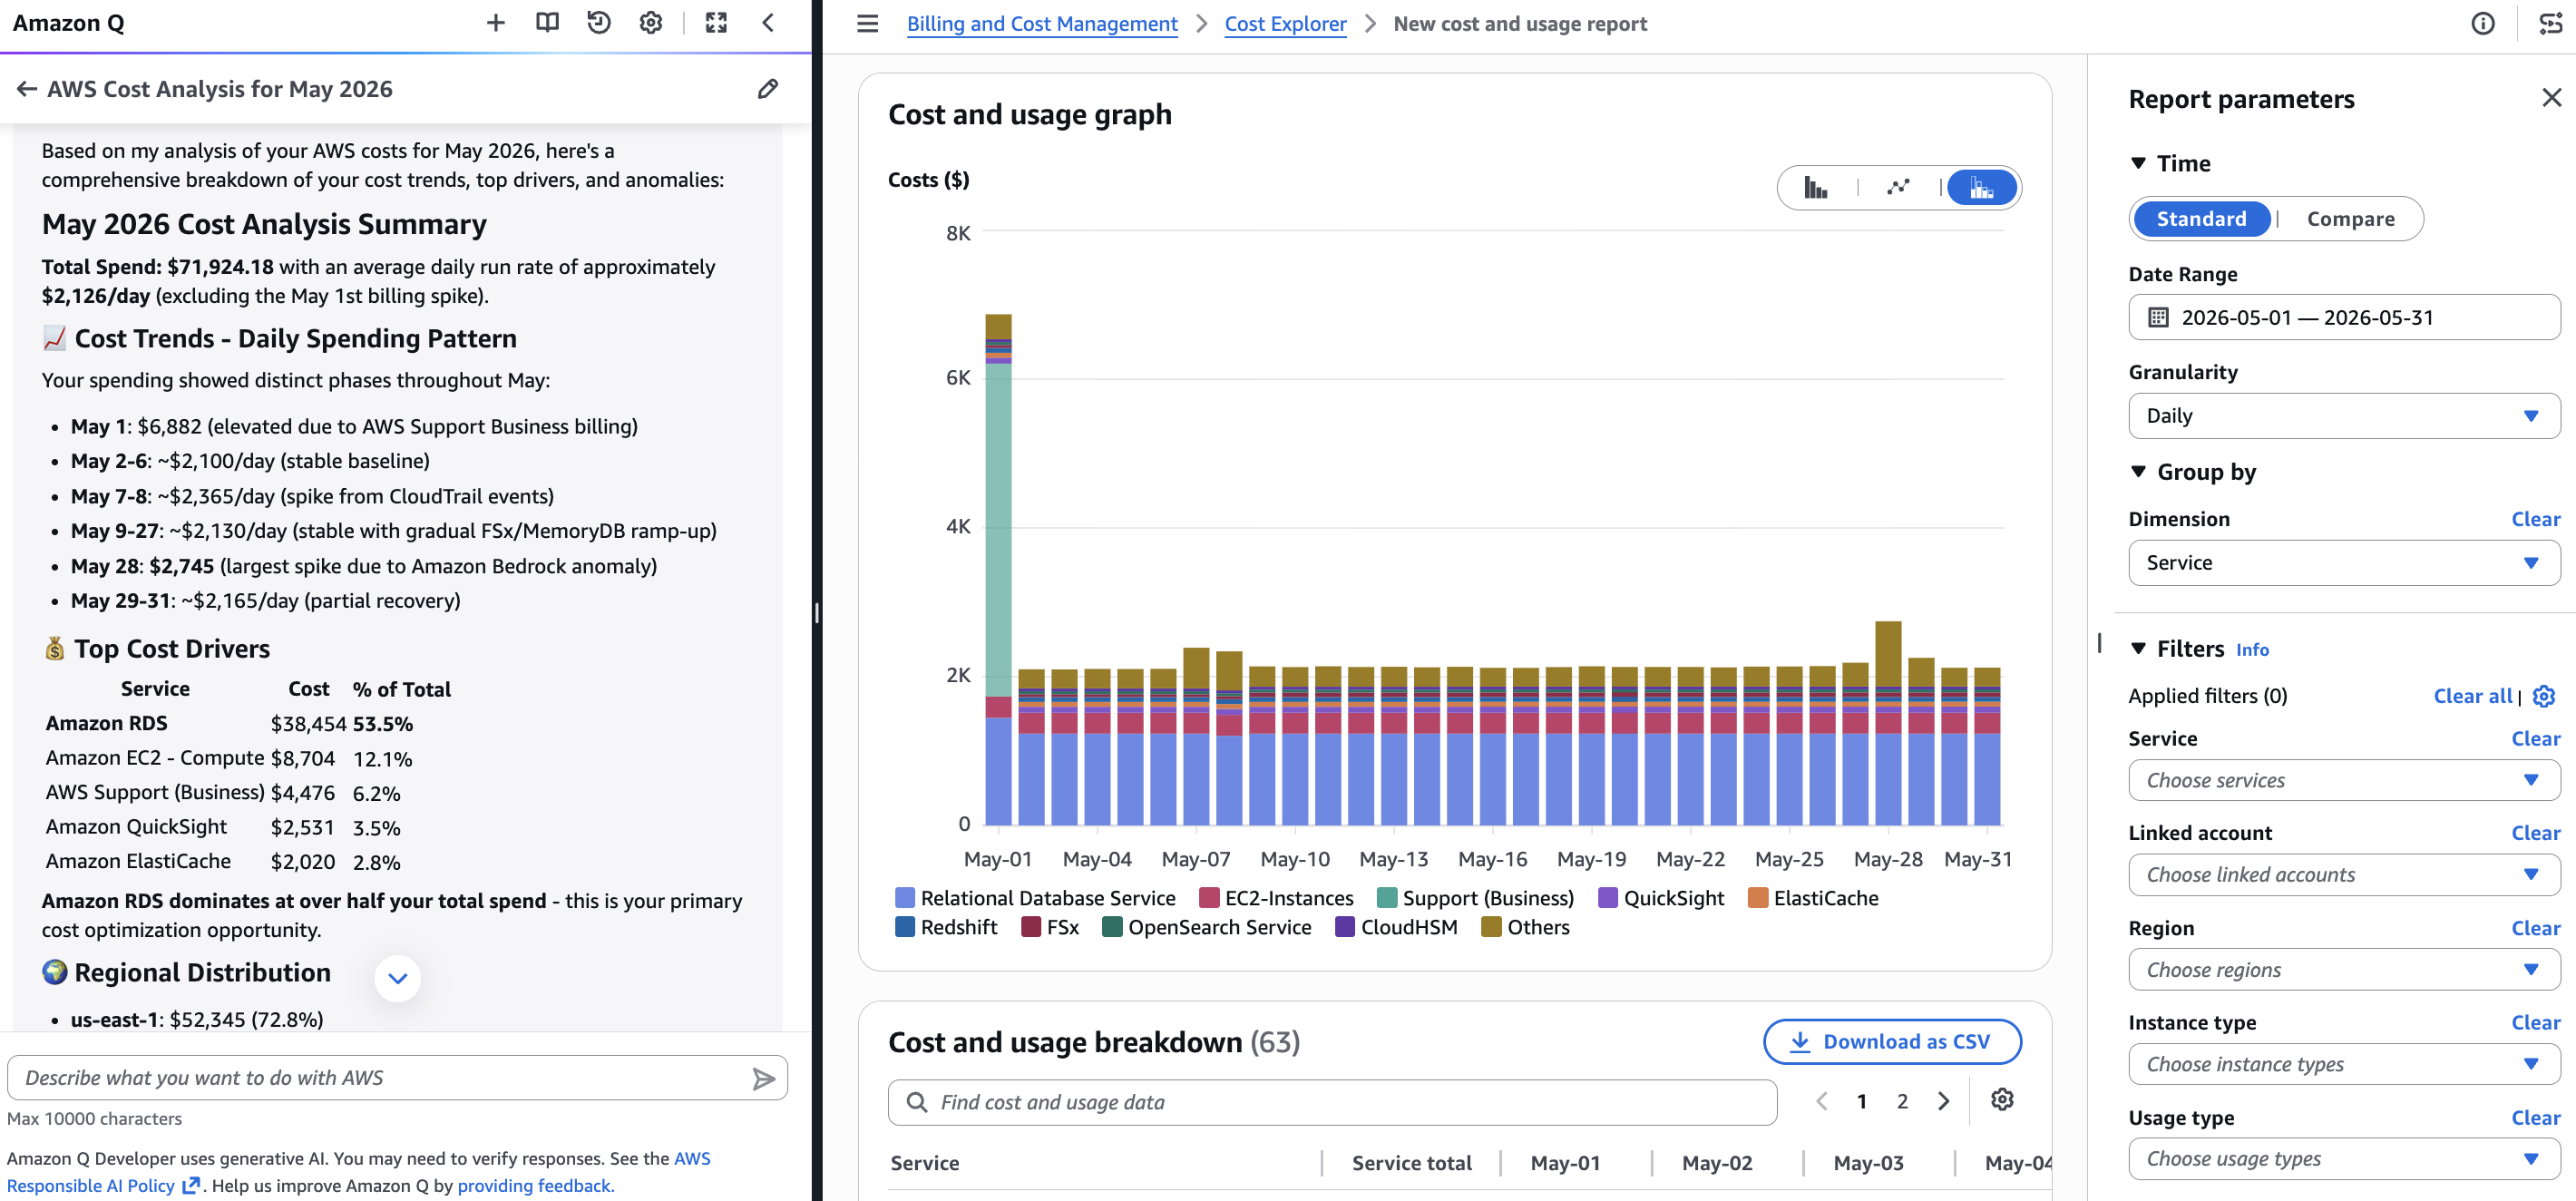
Figure 2: Amazon Q delivers a comprehensive cost explanation covering daily spending patterns, top cost drivers, and their percentage contributions for May 2026.
Step 2: Drilling deeper with follow-up questions
James wants to understand the anomalies better. He asks in Amazon Q: “Tell me more about the anomalies detected.” Amazon Q responds with details on each anomaly, including the affected service, the date range, the expected versus actual cost, and the percentage deviation. It flags a critical priority anomaly on Amazon Bedrock Service (May 28) with a significant increase in spending due to high token volumes, and a high priority anomaly on Amazon MemoryDB (April 28 through May 14) with increased costs, as shown in Figure 3.

Figure 3: James asks about anomalies and Amazon Q provides detailed explanations including the Amazon Bedrock critical priority anomaly and Amazon MemoryDB high priority anomaly with specific dates and root causes.
Step 3: Discovering optimization opportunities
Based on the analysis, James asks: “What are my optimization opportunities?” As shown in Figure 4, Amazon Q guides him toward high-impact, low-effort recommendations. It identifies Amazon RDS Reserved Instances as an opportunity for $931 per month in savings, and Compute Savings Plans for $2,638 per month in savings, with specific purchase actions detailed for each. James now has a clear understanding of what happened last month, why it happened, and what actions to take, all from a single click and a few follow-up questions.
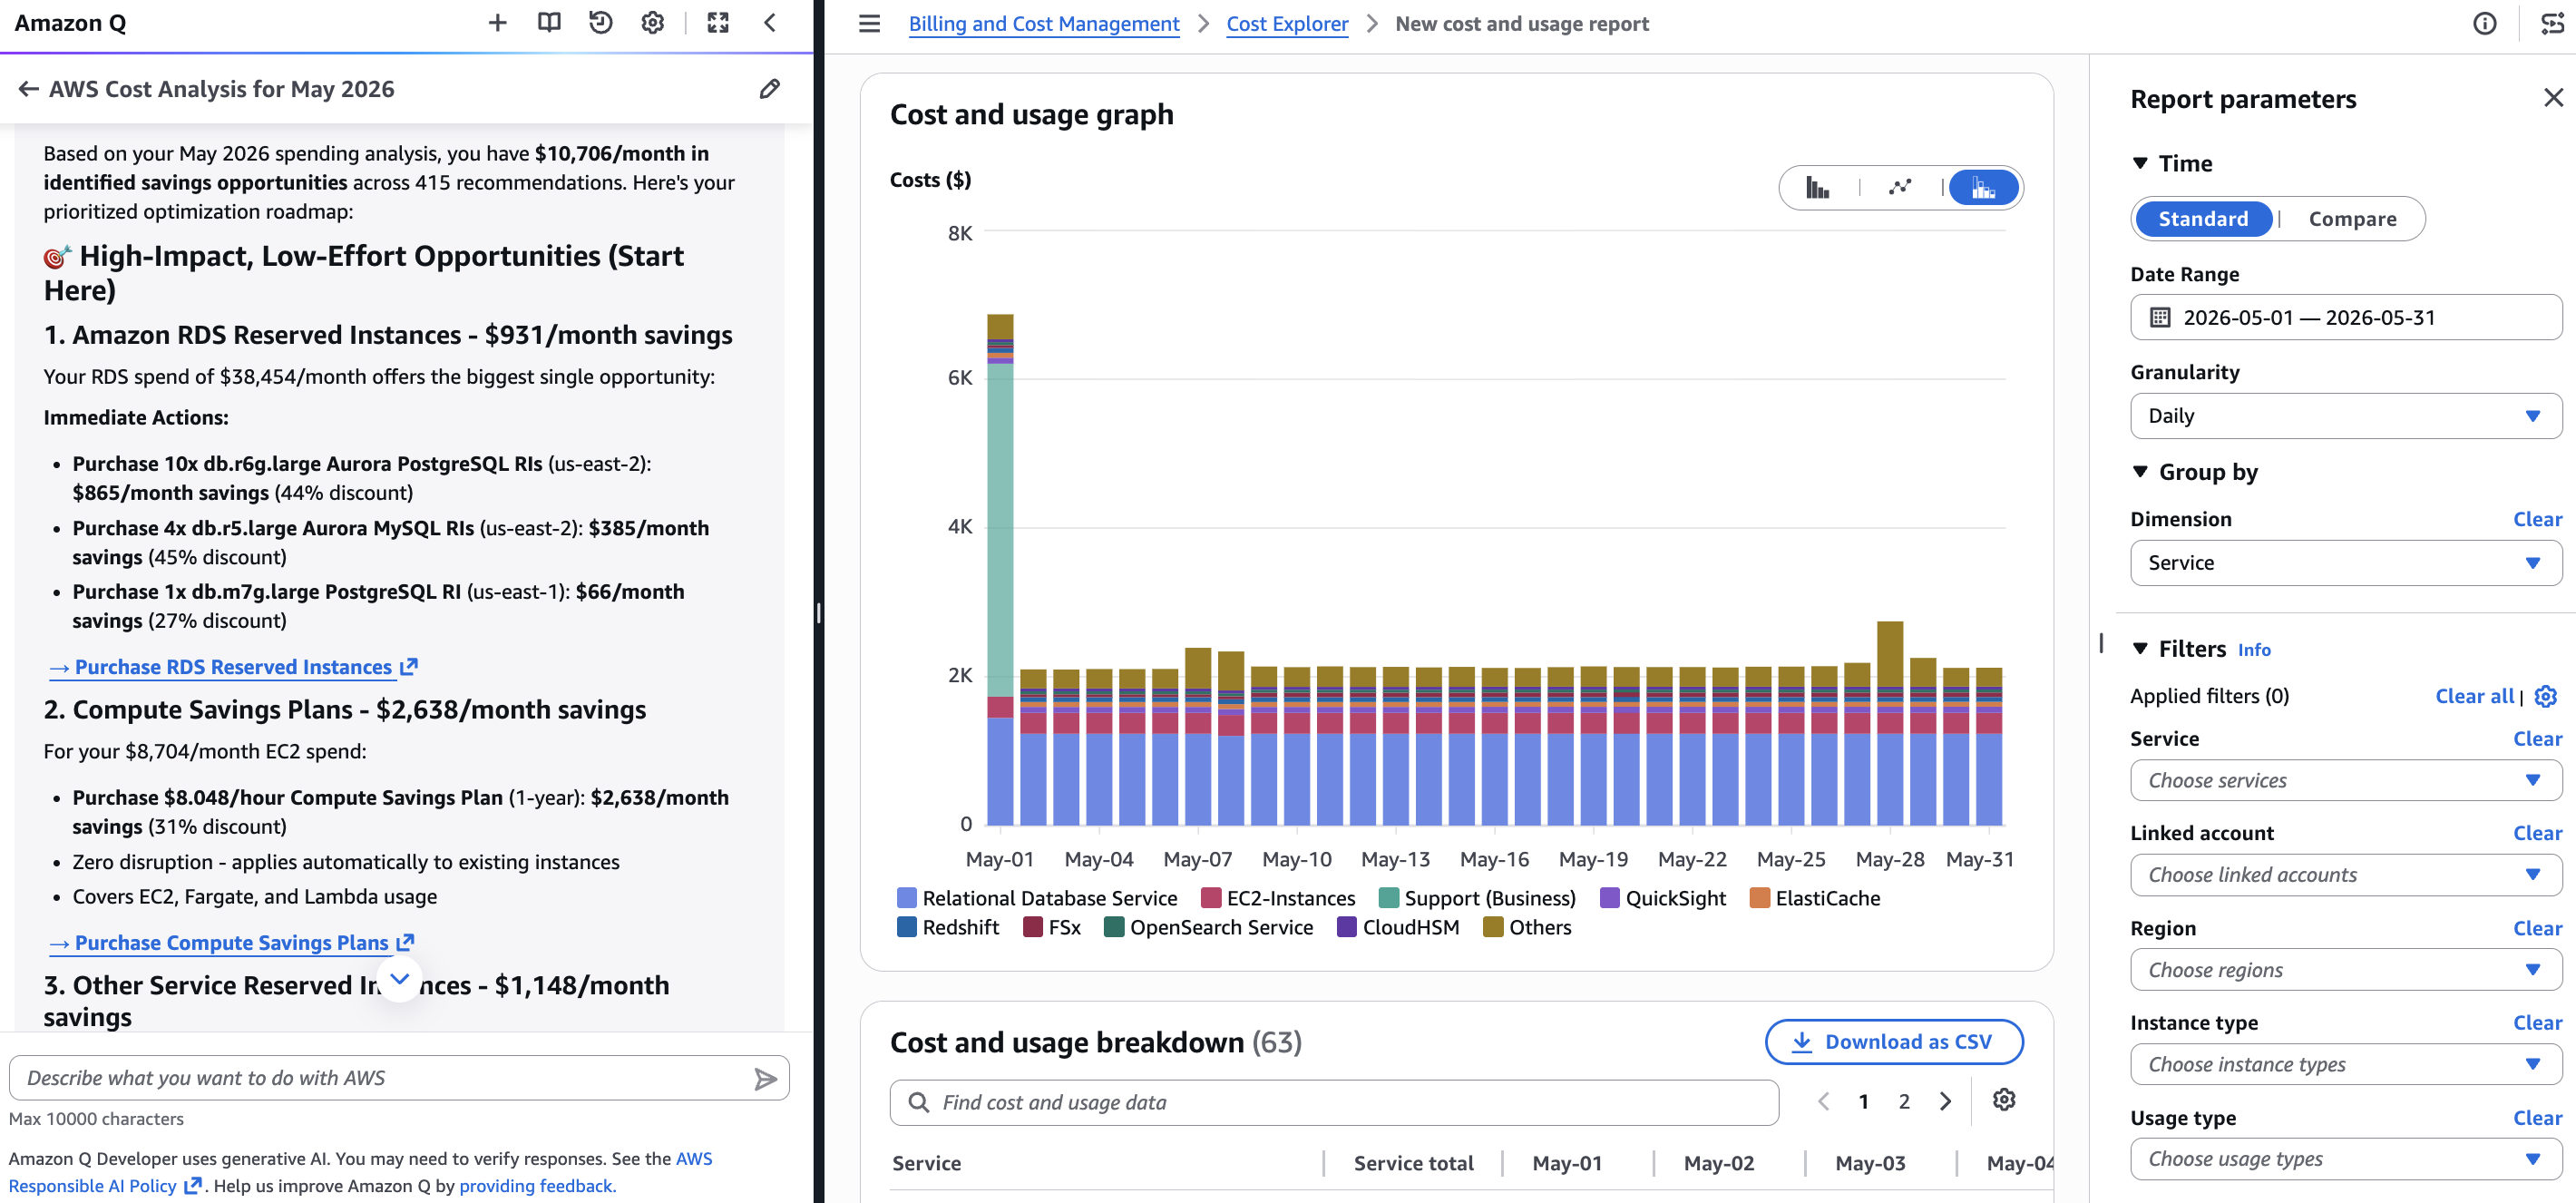
Figure 4: Amazon Q guides James to optimization opportunities including RDS Reserved Instances ($931/month savings) and Compute Savings Plans ($2,638/month savings) with specific actionable recommendations.
Step 4: Understanding future projections
With his historical analysis complete, James wants to understand what’s ahead. He switches his Cost Explorer date range to Q3 2026 (July through September) and clicks “Analyze with Amazon Q” again. As shown in Figure 5, Amazon Q delivers a forecast explanation with a total projected spend of approximately $216,300 across the quarter, broken down to roughly $72,827 for July, $72,827 for August, and $70,646 for September with a slight decline indicating cost stabilization. Amazon Q identifies Amazon RDS as the top cost driver at approximately $38,000 per month (50% of total spend), while noting a declining trend in EC2 Compute costs of 11.6%. James now has the complete picture: what happened last month, why, what to do about it, and what to expect going forward.
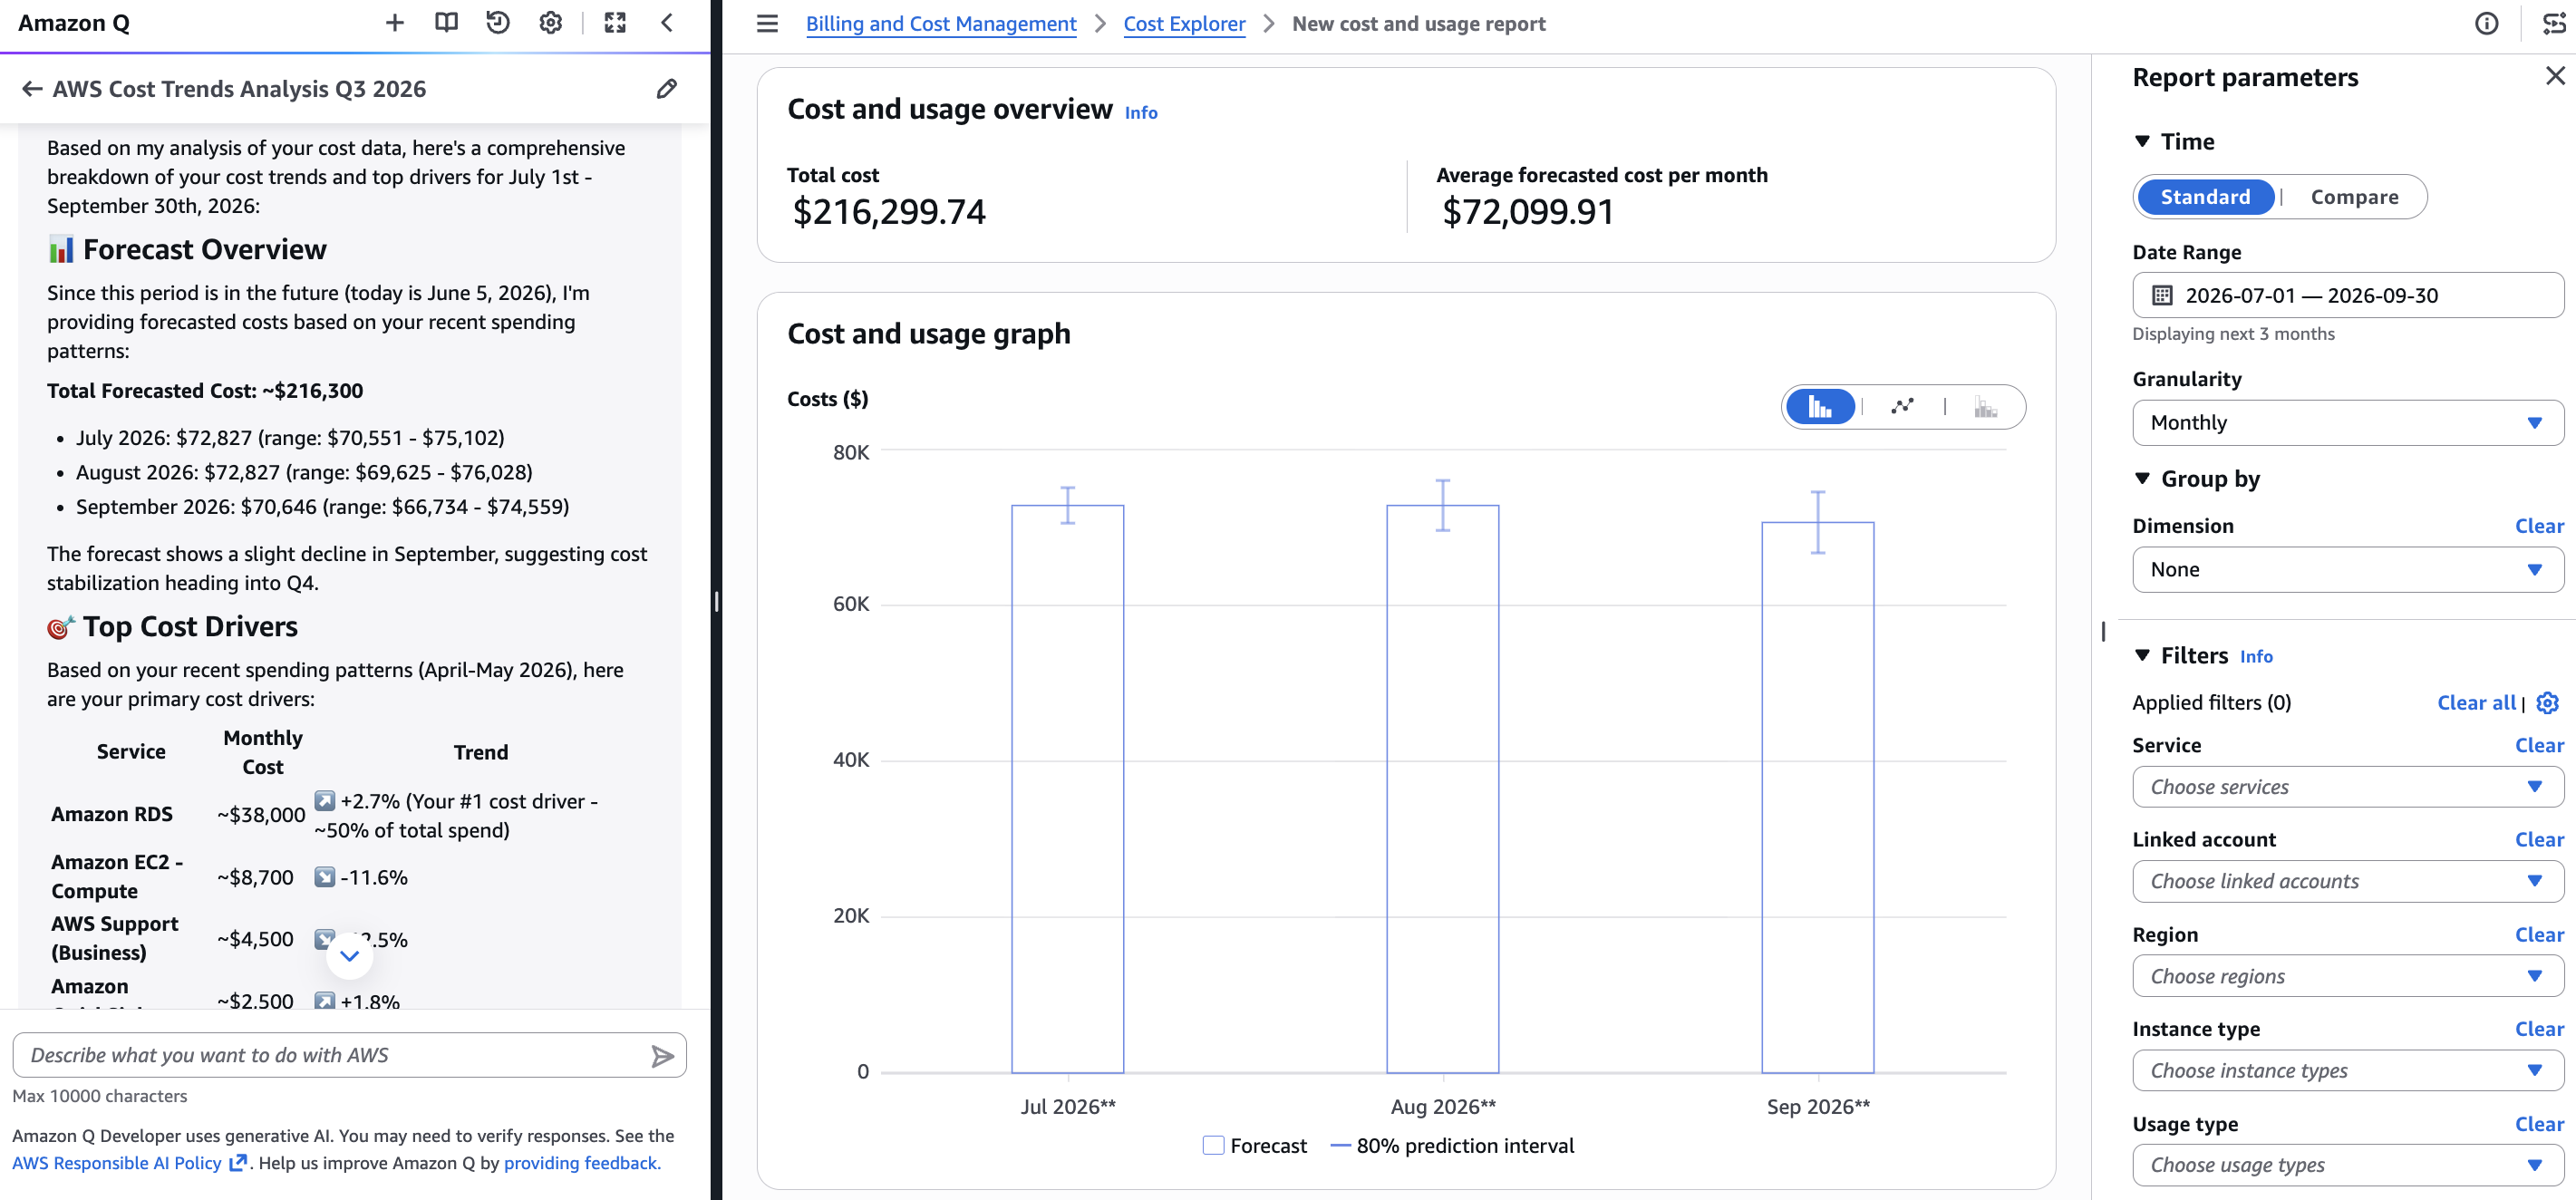
Figure 5: James switches to a forecast view and Amazon Q delivers a Q3 2026 forecast explanation with a total projected spend of $216,300, service-level breakdowns, and a slight September decline indicating cost stabilization.
Historical and forecast explanations
‘Analyze with Amazon Q’ adapts its analysis based on the time-period you’re viewing:
Historical dates: When your cost report covers past dates, Amazon Q analyzes what actually happened. It identifies cost trends, highlights the services and resources that drove changes, surfaces anomalies detected by AWS Cost Anomaly Detection, and explains the factors behind your spending patterns.
- Future dates: When your cost report covers future dates, Amazon Q delivers detailed forecast explanations covering the projected spending trajectory, the services expected to drive future costs, and the factors influencing your projections. You can ask follow-up questions like “Why is my EC2 forecast increasing?” or “Which services are driving my projected costs?” to understand the assumptions behind your forecast and make more informed planning decisions.
- Mixed periods: When your cost report spans both historical and future dates, Amazon Q provides a unified analysis covering what happened in the past and what’s projected going forward, giving you a complete picture across both time horizons.
Getting started
‘Analyze with Amazon Q’ requires no additional setup beyond your existing Cost Explorer and Amazon Q permissions. If you already have Cost Explorer access, you’ll need Amazon Q permissions (q:StartConversation, q:SendMessage) and the q:PassRequest permission that allows Amazon Q to call AWS APIs on your behalf. The quickest way for administrators to grant access is using the AmazonQFullAccess managed policy. For detailed permission configurations, read Security for cost management capabilities in Amazon Q Developer.
To use ‘Analyze with Amazon Q’:
- Navigate to Cost Explorer in the Billing and Cost Management console.
- Configure your cost report with the filters, date range, and groupings you want to analyze.
- Click ‘Analyze with Amazon Q’ above the visualization.
- Review the comprehensive analysis in the Amazon Q chat panel.
- Ask follow-up questions to explore any finding in greater detail.
‘Analyze with Amazon Q’ in AWS Cost Explorer is available today in all commercial AWS regions at no additional charge for Cost Explorer users. Simply open Cost Explorer, configure any cost report, and click ‘Analyze with Amazon Q’ to get the full story behind your cost data.
To learn more, visit our Cost Explorer documentation.