AWS News Blog
Amazon CloudWatch Console Support

|
 The AWS Management Console now includes support for the new Amazon CloudWatch features described in my other posts.
The new CloudWatch tab on the console gives you complete access to all of the metrics collected for your EC2 instances, EBS volumes, RDS DB Instances, and Elastic Load Balancers. You can look at the statistics numerically, and you can also graph them along any dimension that you’d like.
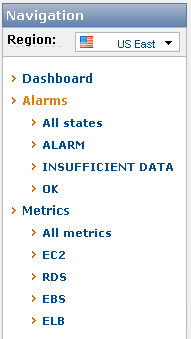
You can also create and manage your CloudWatch alarms using the AWS Management Console’s new Create Alarm wizard. The wizard will walk you through the process of choosing a metric, setting a threshold, and setting up a notification to the Amazon Simple Notification Service(SNS) topic of your choice. Each of your alarms can be in any one of three states (OK, ALARM, or INSUFFICIENT DATA); you can use the console to see all of the alarms or just those that are in a particular state.
Here’s a tour:
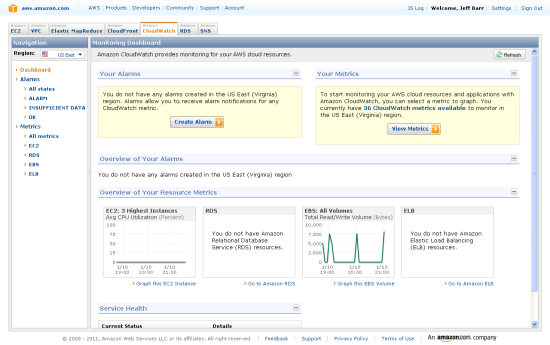
The Dashboard page summarizes your alarms and metrics, and displays a few of the most common and most important metrics:
You have complete access to all of your metrics:
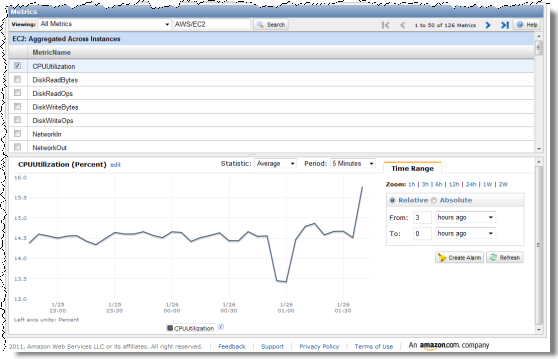
You can control the time range used to display any metric:
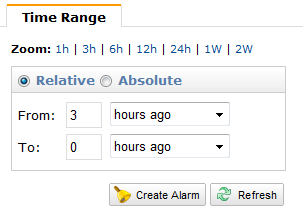
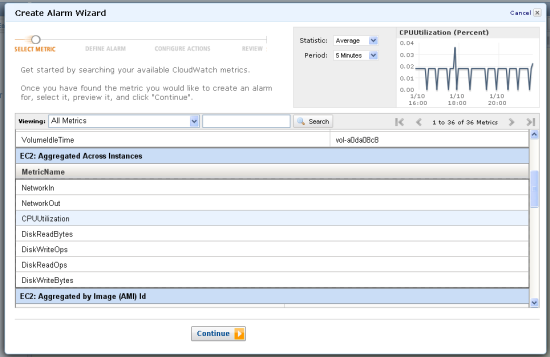
You can use the Create Alarm Wizard to create a new alarm. Alarms can be set on individual or aggregated metrics. For example, you could raise an alarm that will fire when any of your EC2 instances has a high CPU load, or when the average CPU load across all of your instances grows too high. The first step is to choose a metric:
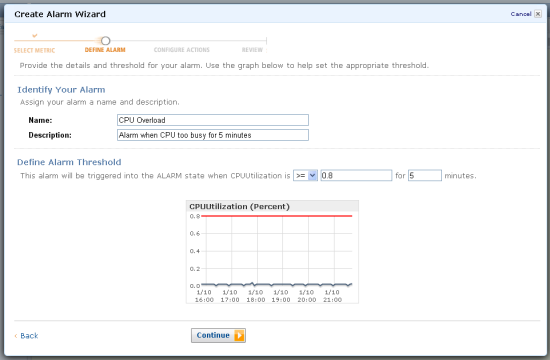
The next step is to choose a threshold and a duration. The metric must fall beyond a limit that you specify, for a time duration that you also specify, in order to raise an alarm.The duration must be longer than the sample period
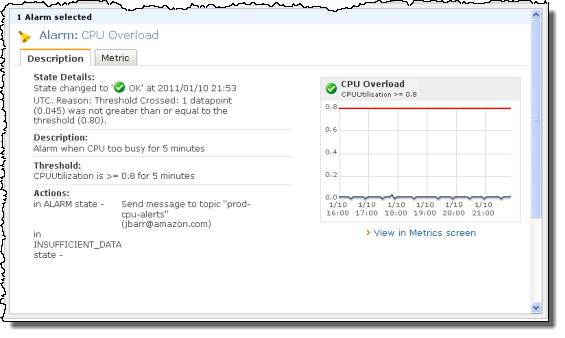
For example, the following alarm will trigger when the CPUUtilization metric exceeds 0.8 for more than five minutes (the red line on the graph denotes the threshold and the dark blue line is the current value):
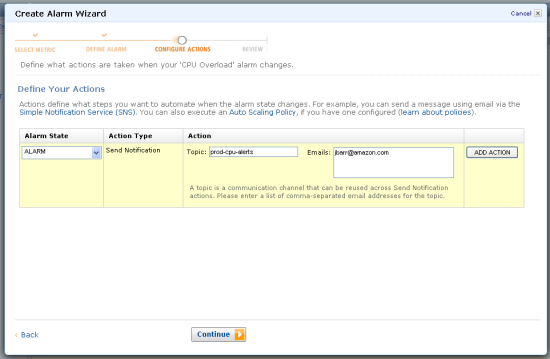
The next step is to define the action or actions to be taken when the alarm is triggered. Actions can issue notifications via SNS and can also execute Auto Scaling Policies. You can also create a new SNS topic and subscribe an email address to it using the wizard.
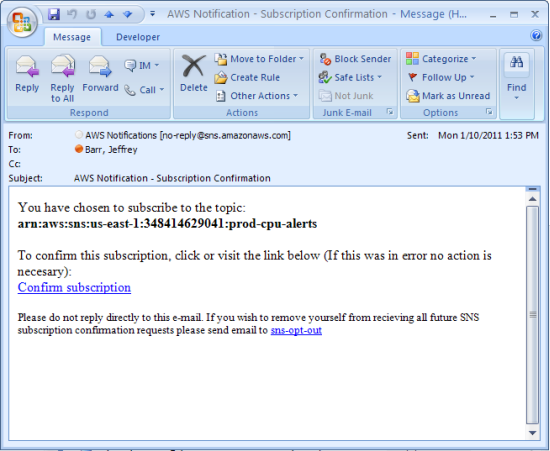
If you choose to issue an SNS notification and subscribe an email address to the topic, you’ll need to confirm the subscription from your inbox:
You can see all of the information about your alarm, including its current state, in the console:
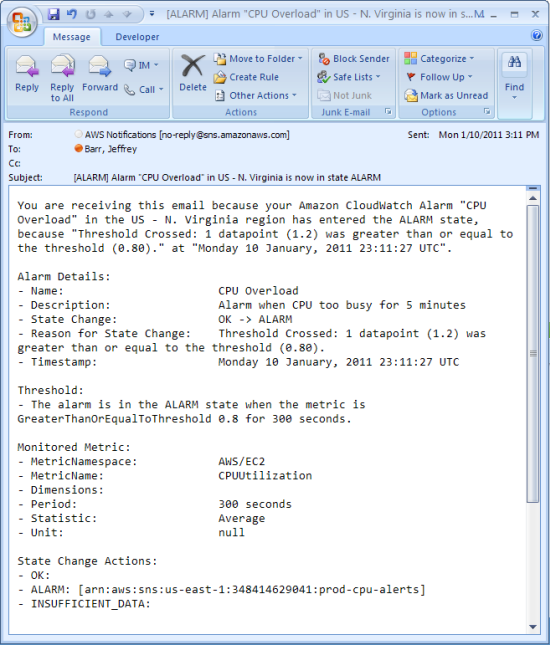
Here’s the email you’ll get when an alarm is triggered:
As you can see, the new additions to the console will simplify the process of monitoring the status of your AWS resources and of taking corrective action when something goes wrong.
— Jeff;