AWS News Blog
Improvements to CloudWatch Logs & Dashboards
Amazon CloudWatch helps you to see, diagnose, react to, and resolve issues that arise in your AWS infrastructure and in the applications that you run on AWS. Today, I would like to talk about several usability and functionality improvements to CloudWatch Logs (Store and Monitor OS & Application Log Files with Amazon CloudWatch) and to CloudWatch Dashboards (CloudWatch Dashboards – Create & Use Customized Metrics Views).
Usability Improvements to CloudWatch Logs
CloudWatch Logs is a highly available, scalable, durable, and secure service to manage your operating system and application log files. It allows you to ingest, store, filter, search, and archive the logs, reducing your operational burden and allowing you to focus on your application and your business.
In order to help you to stay efficient and productive even as the number and size of your logs grows, we have made several usability improvements to the CloudWatch Logs Console:
- Improved formatting for log data.
- Simplified access to lengthy log files.
- Easier searching within a log group.
- Simplified collaboration around log files.
- Better searching within a specific time frame.
Prior to today’s launch we also made some improvements to the CloudWatch Dashboards:
- Full screen mode.
- Dark theme.
- Control over range of the Y axis on charts.
- Simplified renaming of charts.
- Persistent storage of chart settings.
CloudWatch Logs Console in Action
Let’s take a look at each of these improvements!
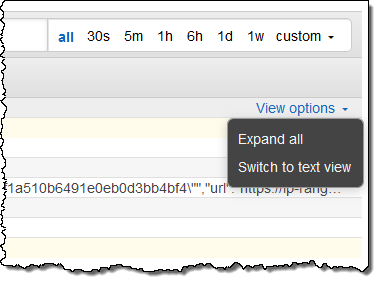
Open up the CloudWatch Logs Console, click on a Log Group, and then on a Log Stream within the group. Find the View options menu on the right:
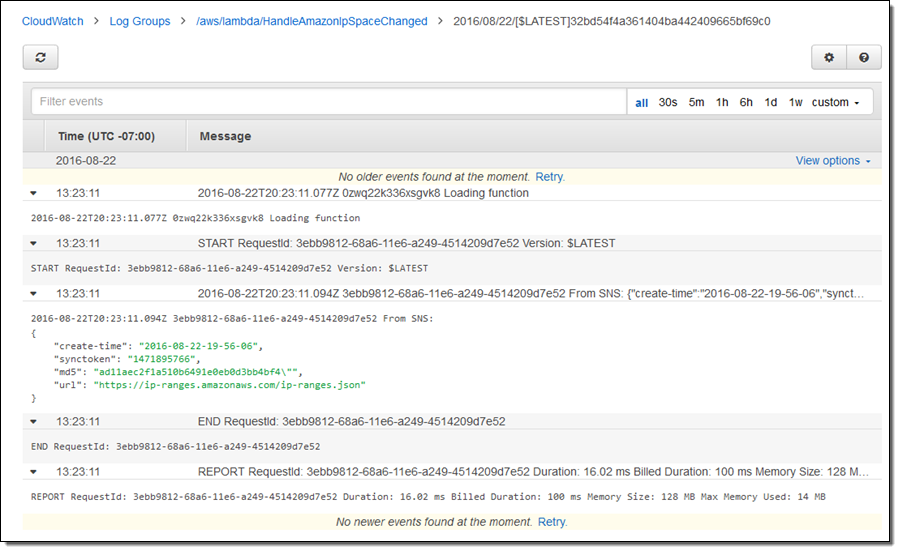
Click on Expand all in order to see the log messages in expanded, multi-line form like this:
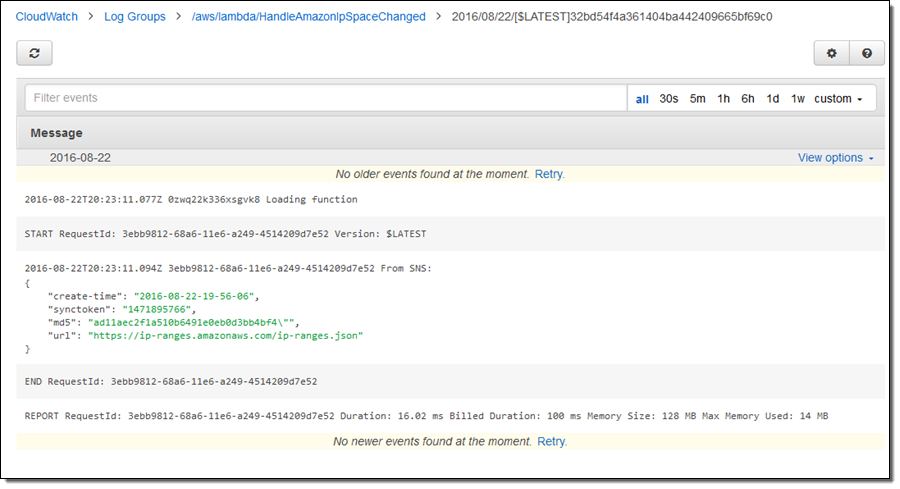
You can also Switch to text view in order to see the logs in their unadorned, plain-text form:
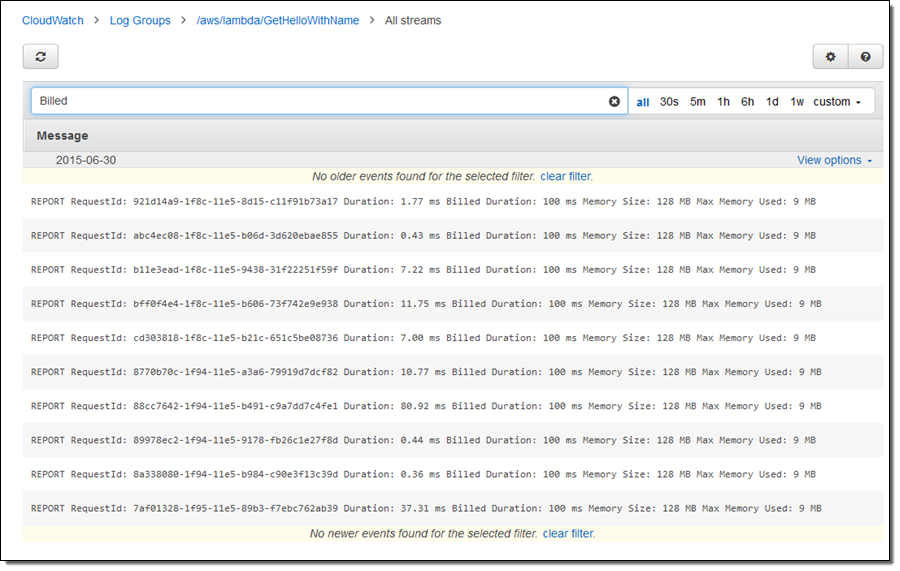
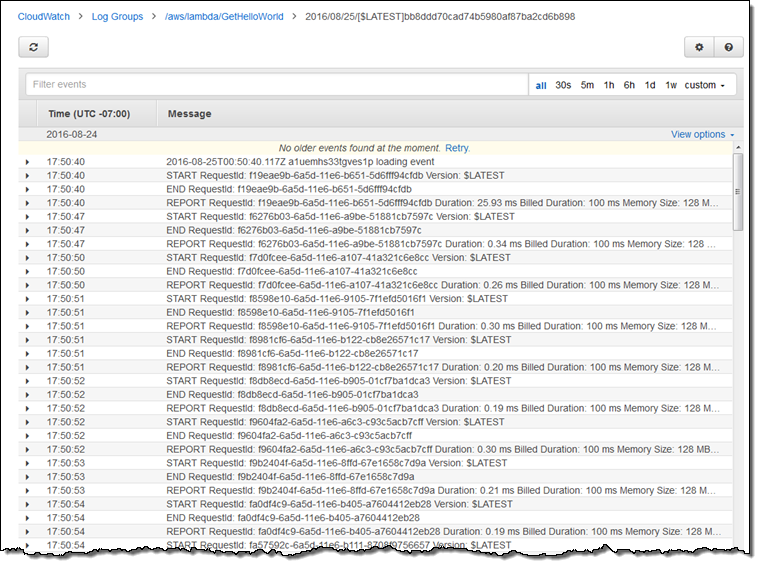
We have also improved the display of log data across all streams within a log group. Once you select a Log Group and click Search Events you can see the log data from all streams with that log group. For example, I can easily identify the Billed Duration for multiple invocations of a single Lambda function:
Even better, we have replaced the original paginated view with an infinite scroll bar. You can now scroll to your heart’s content through log files of any length:
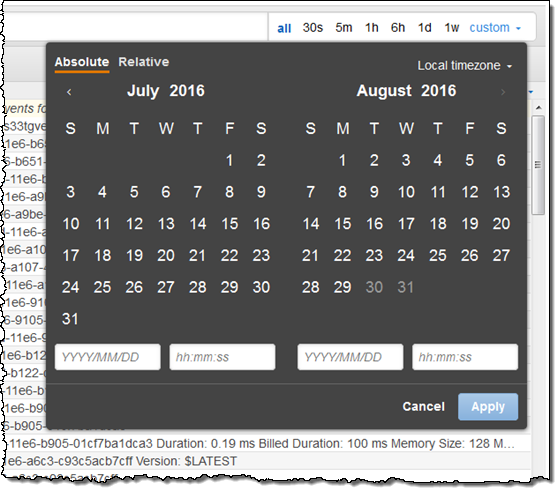
You can now refine your search to a specific time frame or to a custom date range with a single click, like this:
If you are working as part of a team, you can now share the URL of your log analysis session. The URL includes the search parameters and filters, and includes a fragment that looks like this:
group=<log_group_name>_log;stream=<log_stream_name>;filter=<filter_parameter>;start=PT<time_frame>
These improvements to the CloudWatch Logs Console are available now and you can start using them today. To learn more, read Getting Started with CloudWatch Logs.
Recent Improvements to the CloudWatch Dashboards
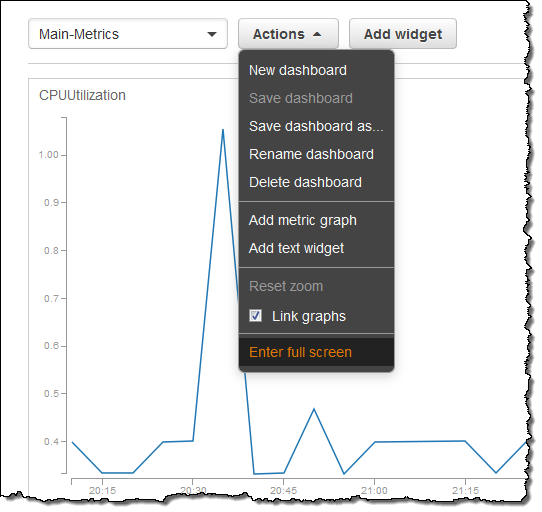
You may have already noticed the improvements that we recently made to the CloudWatch Dashboards. First, there’s a new full screen mode for Dashboards, accessible by clicking on Enter full screen in the Actions menu:
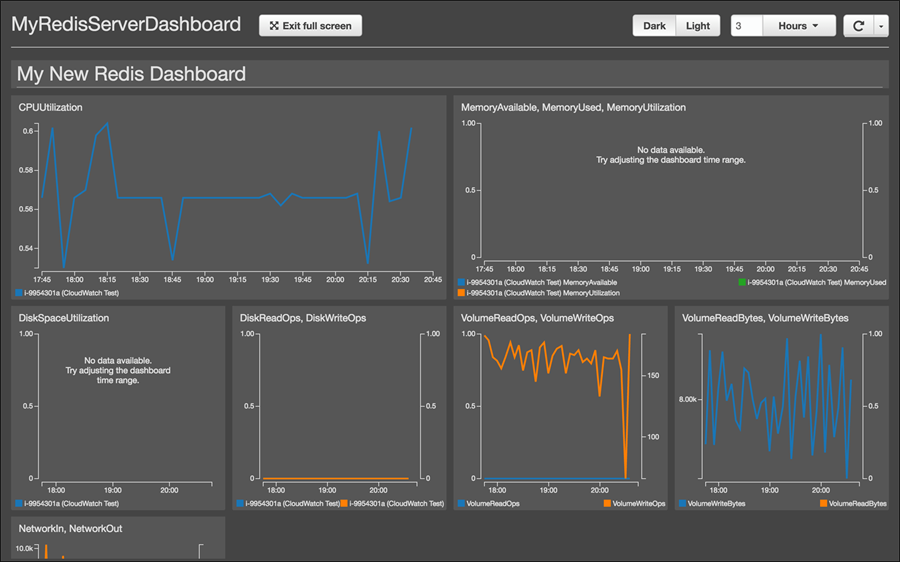
Once you are in full screen mode, you can click on Dark to switch to the new, night-owl-friendly dark theme:

Here’s a simple Redis dashboard in full screen mode using the dark theme:
Sometimes you want to have more control over how a chart is displayed on your dashboard. As an example, outliers in your data may make your chart less readable, and you may want to keep the dashboard focused on a specific Y axis range. Here’s a chart where that’s the case; the outlier masks the trend that happened after the big spike:
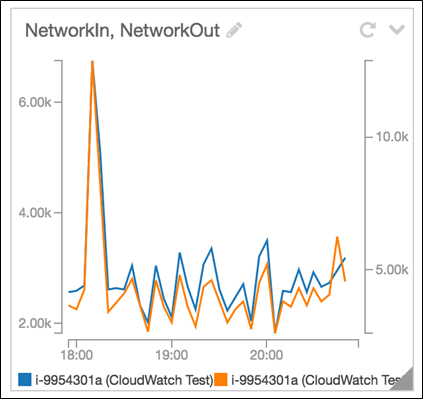
To edit the Y axis, click on the tool selector and select Edit:

Choose Graph Options and then edit the values for the Y axis until you are satisfied with the appearance of the chart, then click on Update widget:
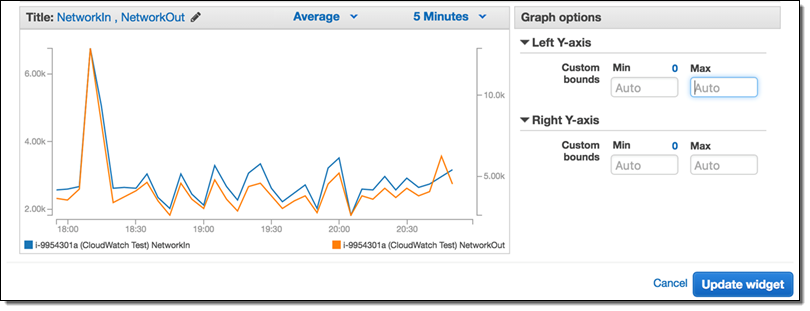
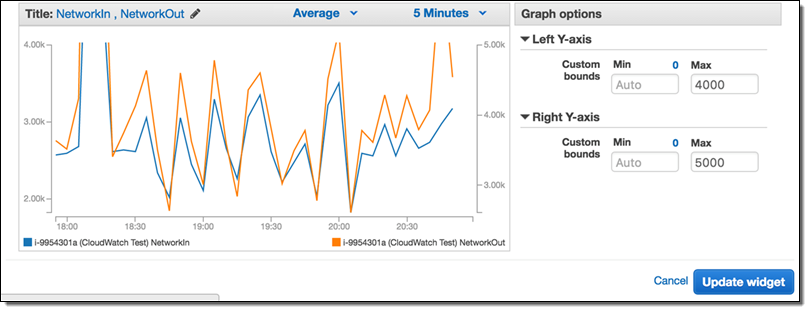
Here’s what the chart looks like after that:
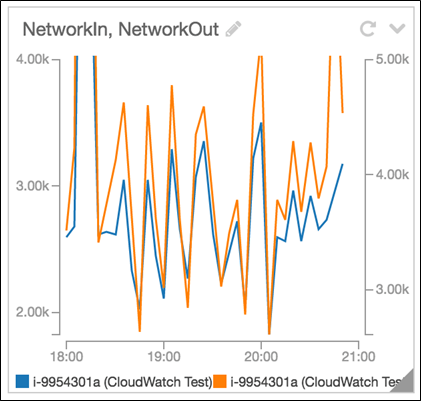
Many of our customers wanted to be able to rename a chart without leaving the dashboard. You can now do that with a click (hover your mouse near the name and then click on the pencil):
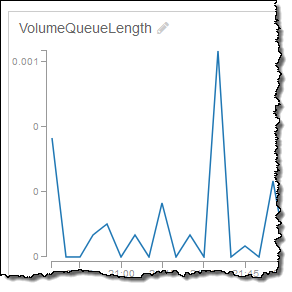
Finally, CloudWatch now remembers the time range, timezone preference, refresh interval, and auto-refresh setting for each chart!
Amazon CloudWatch Partner Ecosystem
I’d like to wrap things up by sharing some of the great work that our partners are doing. The following partners are building value-added solutions on top of CloudWatch:
- Datadog provides integrations to key items in your infrastructure, and gives you the ability to collaborate with your team directly when dealing with incidents.
- Librato provides integrations across elements of your infrastructure, and supports composite metrics and mathematical transformations to time series data.
- SignalFx helps provide you with instant visibility into your metrics, and focuses on data analytics and on delivering alerts on service-wide patterns.
- Splunk offers a platform for operational intelligence that enables you to collect machine data and find insights.
- Sumo Logic is a machine data analytics service for log management and time series metrics that helps you build, run and secure your applications.
- CloudCheckr integrates regular and custom metrics across your environment to assist in cost, security, and performance management by identifying right-sizing opportunities and alerting for potential security and performance issues.
If you are a partner and offer something that belongs on this list, let me know and I’ll update it ASAP!
— Jeff;