AWS News Blog
CloudWatch Dashboards – Create & Use Customized Metrics Views
Amazon CloudWatch monitors your AWS cloud resources and your cloud-powered applications. It tracks the metrics so that you can visualize and review them. You can also set alarms that will fire when a metrics goes beyond a limit that you specified. CloudWatch gives you visibility into resource utilization, application performance, and operational health.
New CloudWatch Dashboards
Today we are giving you the power to build customized dashboards for your CloudWatch metrics. Each dashboard can display multiple metrics, and can be accessorized with text and images. You can build multiple dashboards if you’d like, each one focusing on providing a distinct view of your environment. You can even pull data from multiple regions into a single dashboard in order to create a global view.
Let’s build one!
Building a Dashboard
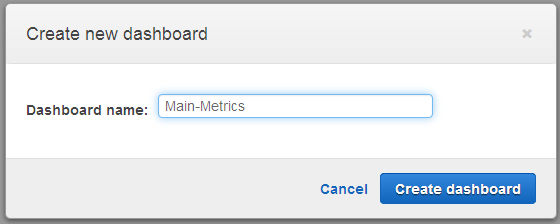
I open up the CloudWatch Console and click on Create dashboard to get started. Then I enter a name:
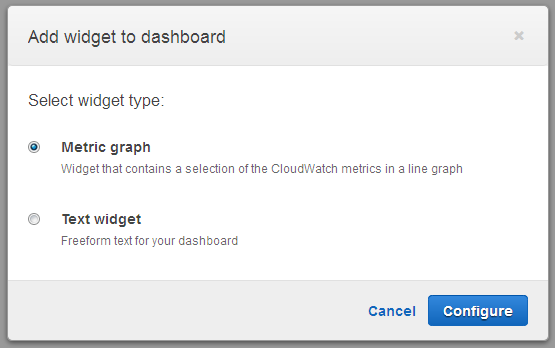
Then I add my first “Widget” (a graph or some text) to my dashboard. I’ll display some metrics using a line graph:
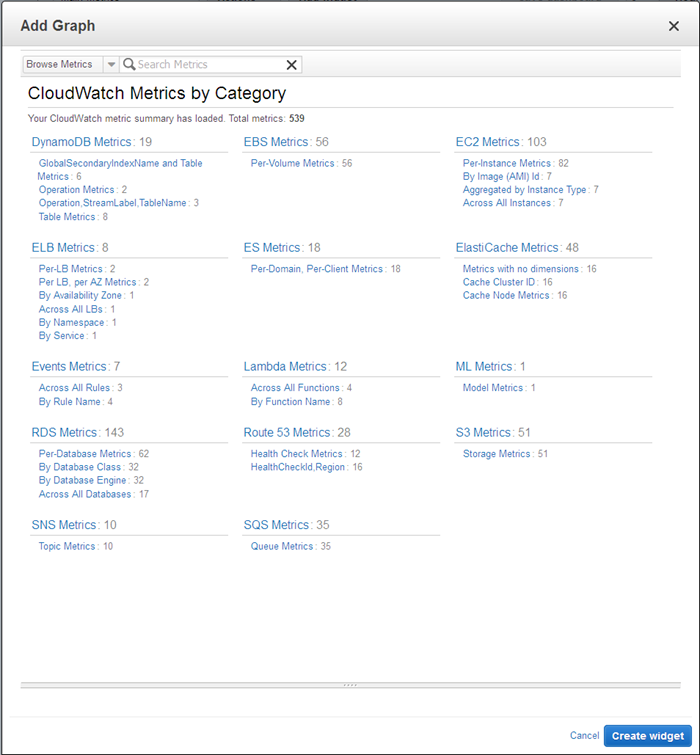
Now I need to choose the metric. This is a two step process. First I choose by category:
I clicked on EC2 Metrics. Now I can choose one or more metrics and create the widget. I sorted the list by the Metric Name selected all of my EC2 instances, and clicked on the Create widget button (not shown in the screen shot):
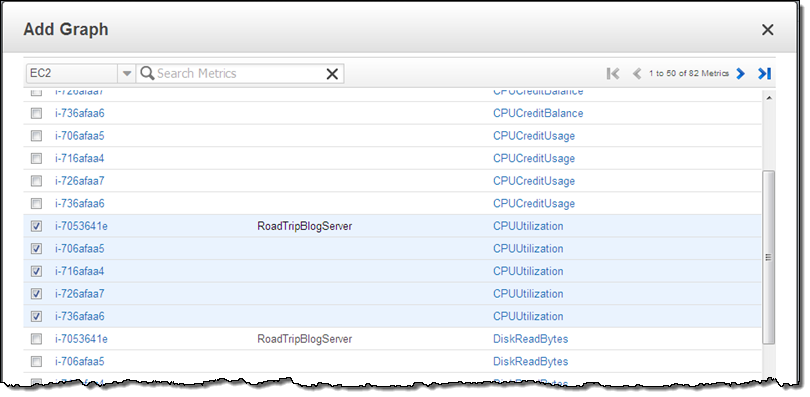
As I noted earlier, you can access and make use of metrics drawn from multiple AWS regions; this means that you create a single global status dashboard for your complex, multi-region applications and deployments.
And here’s my dashboard:
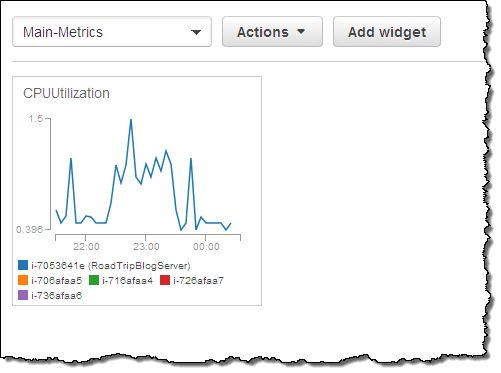
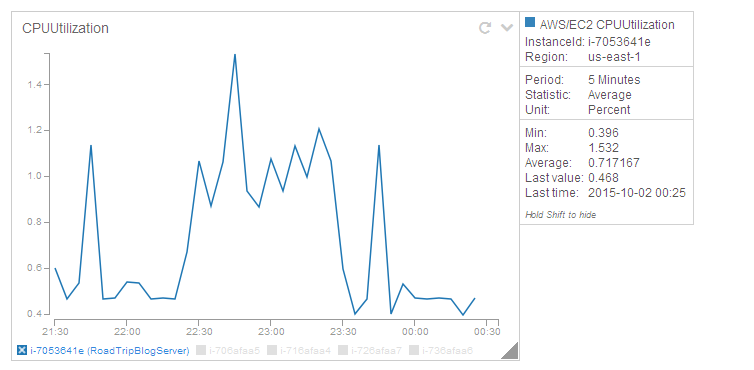
I can resize the graph, and I can also interact with it. For example, I can focus on a single instance with a click (this will also highlight the other metrics from that instance on the dashboard):
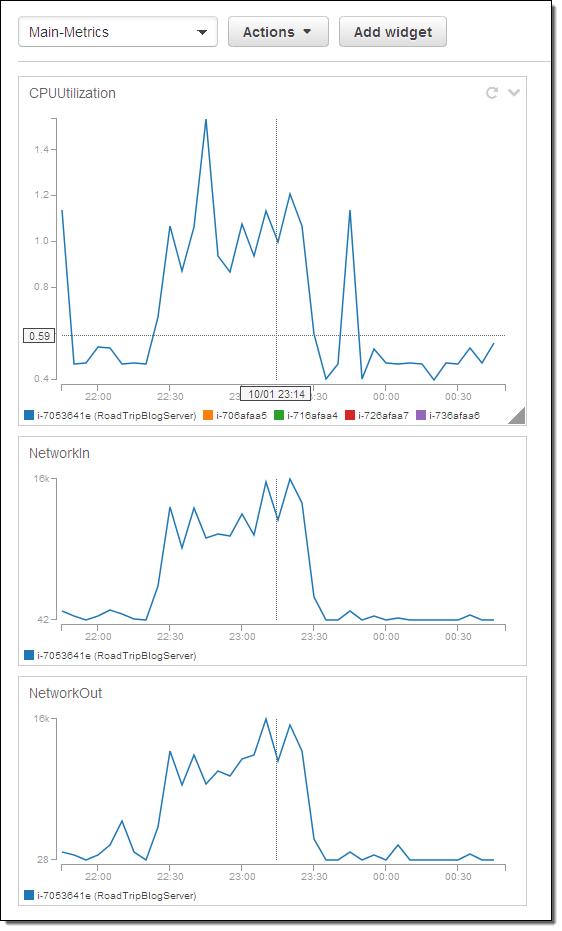
I can add several widgets. The vertical line allows me to look for correlation between metrics that are shown in different widgets:
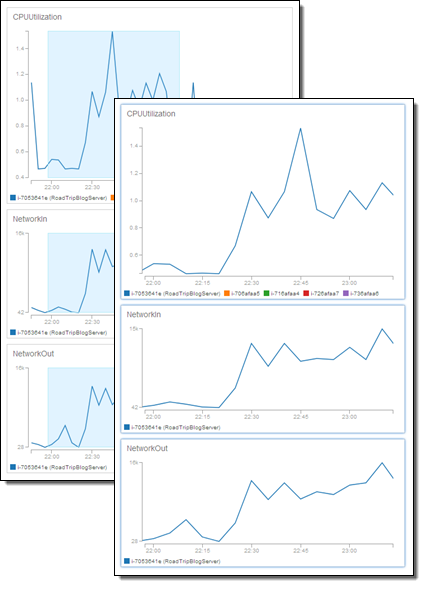
The graphs can be linked or independent with respect to zooming (the Actions menu allows me to choose which option I want). I can click and drag on a desired time-frame and all of the graphs will zoom (if they are linked) when I release the mouse button:
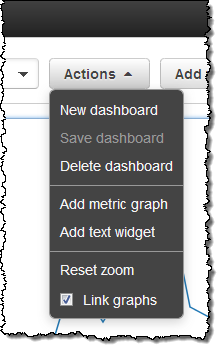
The Action menu allows me to reset the zoom and to initiate many other operations on my dashboards:
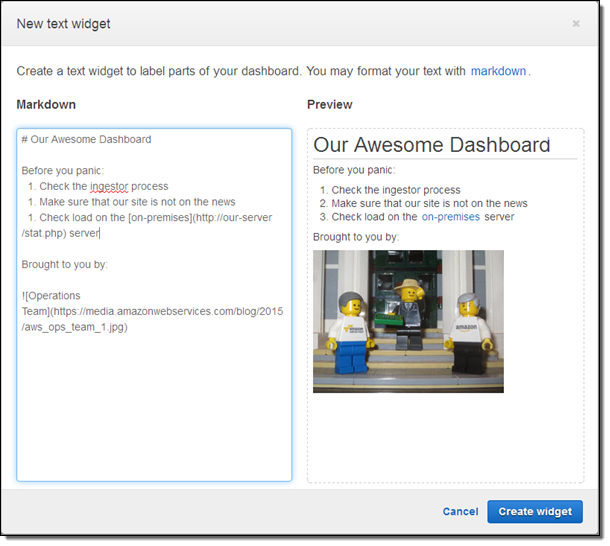
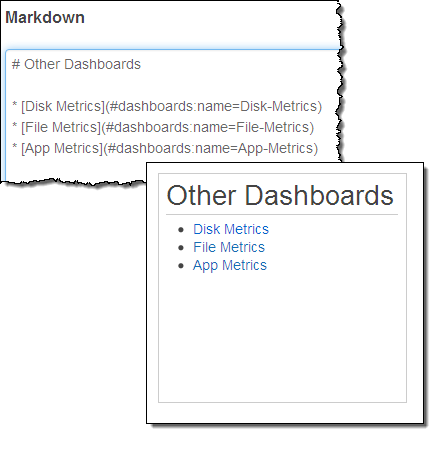
I can also add static text and images to my dashboard by using a text widget. The contents of the widget are specified in Markdown:
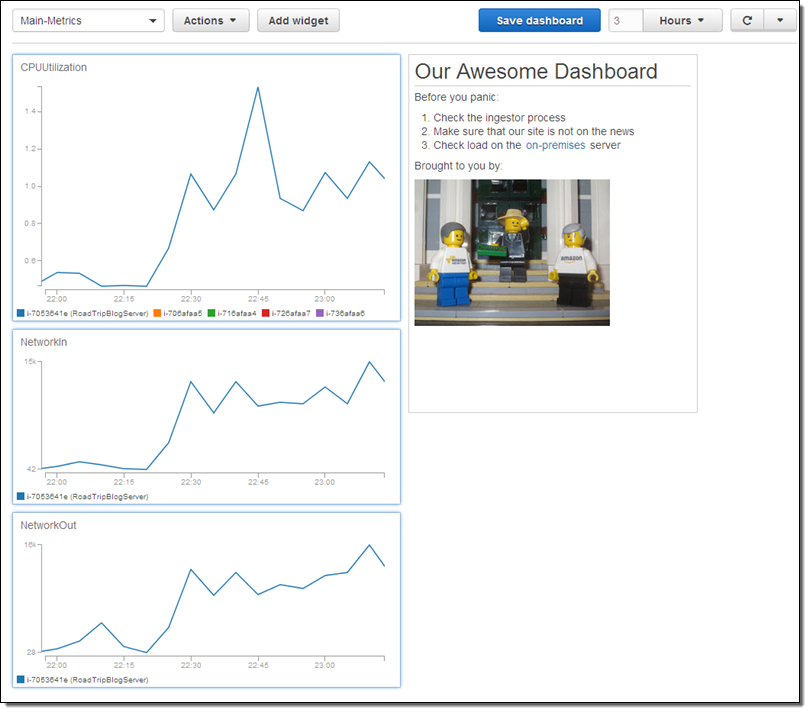
Here’s my stylish new dashboard:
Text widgets can also include buttons and tables. I can link to help pages, troubleshooting guides, internal and external status pages, phone directories, and so forth.
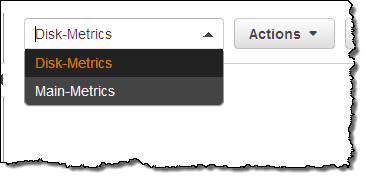
I can create several dashboards and switch between then with a click:
I can also create a link that takes me from one dashboard to another one:
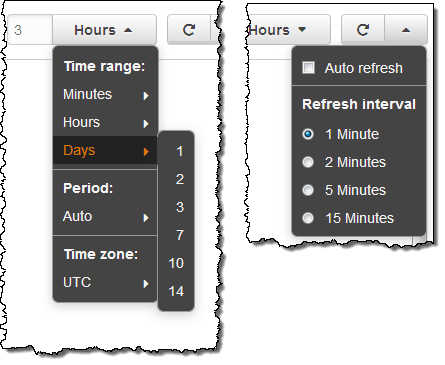
 I can also control the time range for the graphs, and I can enable automatic refresh, with fine-grained control of both:
Dashboard Ownership and Access
The individual dashboards are stored at the AWS account level and can be accessed by IAM users within the account. However, in many cases administrators will want to set up dashboards for use across the organization in a controlled fashion.
In order to support this important scenario, IAM permissions on a pair of CloudWatch functions can be used to control the ability to see metrics and to modify dashboards. Here’s how it works:
- If an IAM user has permission to call
PutMetricData, they can create, edit, and delete dashboards. - If an IAM user has permission to call
GetMetricStatistics, they can view dashboard content.
Available Now
CloudWatch Dashboards are available now and you can start using them today in all AWS regions! You can create up to three dashboards (each with up to 50 metrics) at no charge. After that, each additional dashboard costs $3 per month.
Share Your Dashboards
I am looking forward to seeing examples of this feature in action. Take it for a spin and let me know what you come up with!
— Jeff;