AWS Big Data Blog
A guide to capacity planning for Airflow worker pool in Amazon MWAA
In our previous post, A guide to Airflow worker pool optimization in Amazon MWAA, we explored when adding workers to your Amazon Managed Workflows for Apache Airflow (Amazon MWAA) environment actually solves performance issues, and when it doesn’t. We walked through patterns like high CPU utilization and long queue times where scaling may be appropriate, and anti-patterns like misconfigured Airflow settings and memory leaks where adding workers only masks the real problem. The key takeaway was clear: optimize first, scale second, and always let data drive the decision.
But what happens after you’ve done the optimization work? Your DAGs are efficient, your configurations are tuned, and your environment is running well. Then the business comes knocking: new regulatory requirements, additional data pipelines, expanded reporting. The workload is about to grow, and this time, you genuinely need more capacity.
This is where capacity planning comes in. Knowing how many workers to provision, before the new workload hits production, is the difference between a smooth rollout and a 5 AM SLA breach. In this post, we walk through a practical capacity planning framework for Amazon MWAA worker pools. Using a real-world financial services scenario, we show how to assess your current capacity, project future needs, calculate the right number of base workers, and set up monitoring to keep your environment healthy as workloads evolve.
Scenario: A financial services company needs to plan capacity for a 25% directed acyclic graph (DAG) increase to support new regulatory reporting requirements.
Current vs projected state
The following table compares the current and expected state after adding 25% more DAGs.
| Metric | Current | Projected | Change | |
| 1 | DAGs | 20 | 25 | 25% |
| 2 | Peak Tasks (5-7 AM) | 80 | 104 | +24 tasks |
| 3 | Environment Class | mw1.medium | mw1.medium | No change |
| 4 | Base Workers | 8 | 11 | +3 workers |
| 5 | Tasks per Worker | 10 (mw1.medium default) | 10 | No change |
| 6 | Available Capacity | 80 slots (8 × 10) | 110 slots (11 × 10) | +30 slots |
| 7 | Peak Utilization | 100% (80/80 slots) ⚠️ | 95% (104/110 slots) | Improved |
| 8 | Critical SLA | 7 AM market open | 7 AM market open | No tolerance |
Capacity planning goal: Reduce utilization from 100% to 95% to maintain service level agreement (SLA) compliance and handle unexpected spikes.
Understanding current capacity: The environment currently runs 8 base workers, providing 80 concurrent task slots (8 workers × 10 tasks per worker). During the 5-7 AM peak with 80 concurrent tasks, this represents 100% utilization, a risky level that leaves no headroom for unexpected spikes or volatility.
With the planned addition of 5 new regulatory reporting DAGs, peak concurrent tasks will grow to 104. To maintain healthy operations with adequate buffer, we need to increase to 11 base workers (110 slots), resulting in 95% peak utilization with 6 slots of breathing room.
Why 100% utilization is risky: Running at 100% task utilization means:
- Zero buffer for unexpected spikes
- Any additional task causes immediate queuing
- No room for market volatility or data volume increases
- High risk of SLA breaches during unpredictable events
Best practice: Maintain at least 5-15% headroom (85-95% utilization) for production workloads with critical SLAs.
Why this sizing:
- Current: 80 tasks ÷ 80 slots = 100% utilization (at capacity – risky!)
- Projected: 104 tasks ÷ 110 slots = 95% utilization (healthy with buffer)
- Buffer: 6 slots (5% headroom) protects against unexpected volatility spikes
- SLA protection: Adequate headroom prevents queuing during normal operations
Capacity analysis
Every team asks the same critical question: “How many workers do I need?” The process is to identify your peak concurrent tasks from Amazon CloudWatch metrics, dividing by your environment’s tasks-per-worker capacity, and adding a 5%-15% safety buffer.
Step 1: Identifying peak concurrent tasks from Amazon CloudWatch
To determine your peak workload, you need to analyze RunningTasks and QueuedTasks CloudWatch metrics for your Amazon MWAA environment. Navigate to Amazon CloudWatch and query the following key metrics:
Primary metrics for capacity planning:
- RunningTasks: Number of tasks currently executing across all workers. This shows your actual concurrent task load.
- QueuedTasks: Number of tasks waiting for available worker slots. High values indicate insufficient capacity.
- AvailableWorkers: Current number of active workers in your environment.
How to find peak concurrent tasks:
- Open the Amazon CloudWatch Console.
- Choose Metrics.
- Choose the MWAA namespace.
- Select your environment name.
- Add the
RunningTasksmetric. - Set time range to last 7-30 days.
- Change statistic to Maximum.
- Identify the highest value during your peak hours (for example, 5-7 AM).
Example query:
Note: The following query is conceptual and does not directly translate to Amazon CloudWatch-specific language. Please refer to the Query your CloudWatch metrics with CloudWatch Metrics Insights for more information.
In our scenario, this analysis revealed 80 concurrent tasks during the 5-7 AM window. With the planned 25% DAG increase, we project this will grow to 104 concurrent tasks.
Step 2: Calculate required workers
To calculate the number of required workers without queuing any tasks, use the following formula: Peak concurrent tasks ÷ Tasks per worker × Safety buffer = Required workers
In the projected scenario with 104 tasks at peak hours, using mw1.medium environment with default concurrency configuration and having a 5% safety buffer, we need 11 workers
- 104 peak tasks ÷ 10 tasks per worker × 1.06 buffer = 11 workers required to handle your workload without queuing during busiest periods.
Capacity monitoring and triggers
There are a few important Amazon CloudWatch metrics to monitor for environment health.
Key metrics to monitor
Monitor these five critical Amazon CloudWatch metrics to detect capacity issues:
- QueuedTasks (>10 for >5 minutes indicates insufficient capacity)
- RunningTasks (consistently at maximum suggests the need for more workers)
- AdditionalWorkers (active for more than 6 hours daily signals the permanent worker problem)
- Worker CPU (>85% sustained requires environment class upgrade or workload optimization)
- Task Duration (+15% increase means reduced effective capacity per worker).
These metrics provide early warning signals to adjust capacity before SLA breaches occur.
| Metric | Threshold | Action | |
| 1 | QueuedTasks | >10 for >5 minutes | Investigate capacity |
| 2 | RunningTasks | Consistently at max | Increase base workers |
| 3 | AdditionalWorkers | Active >6 hours daily | Increase base workers |
| 4 | Worker CPU | >85% sustained | Upgrade environment class |
| 5 | Task Duration | +15% increase | Review capacity per worker |
Amazon CloudWatch monitoring queries
Note: The following queries are conceptual and do not directly translate to Amazon CloudWatch-specific language. Please refer to the Query your CloudWatch metrics with CloudWatch Metrics Insights for more information.
- Queue depth during peak hours
- Worker utilization efficiency
- Detect permanent worker problem
Setting up alerts
You can configure these alarms to identify problems as soon as they are introduced.
Recommended Amazon CloudWatch alarms:
- High queue depth alert
- Metric: QueuedTasks
- Threshold: > 10 for 2 consecutive 5-minute periods
- Action: Notify operations team
- Permanent worker detection
- Metric: AdditionalWorkers
- Threshold: > 0 for 6+ hours
- Action: Review capacity planning
- SLA risk alert
- Metric: QueuedTasks during 5-7 AM window
- Threshold: > 5 tasks
- Action: Page on-call engineer
When to revisit capacity planning
Conduct quarterly scheduled reviews to analyze trends and project growth. Also run immediate trigger-based assessments when:
- DAG count increases >10% (or more than your safety buffer)
- Performance degrades
- Cost anomalies appear (indicating permanent workers)
- Any SLA breach occurs.
This dual approach provides proactive capacity management while enabling rapid response to emerging issues.
| Trigger | Frequency | Action | |
| 1 | Scheduled Review | Quarterly | Analyze trends, project growth |
| 2 | DAG Growth | >10% increase | Recalculate capacity needs |
| 3 | Performance Degradation | As observed | Immediate capacity assessment |
| 4 | Cost Anomalies | Monthly | Check for permanent workers |
| 5 | SLA Breaches | Any occurrence | Emergency capacity review |
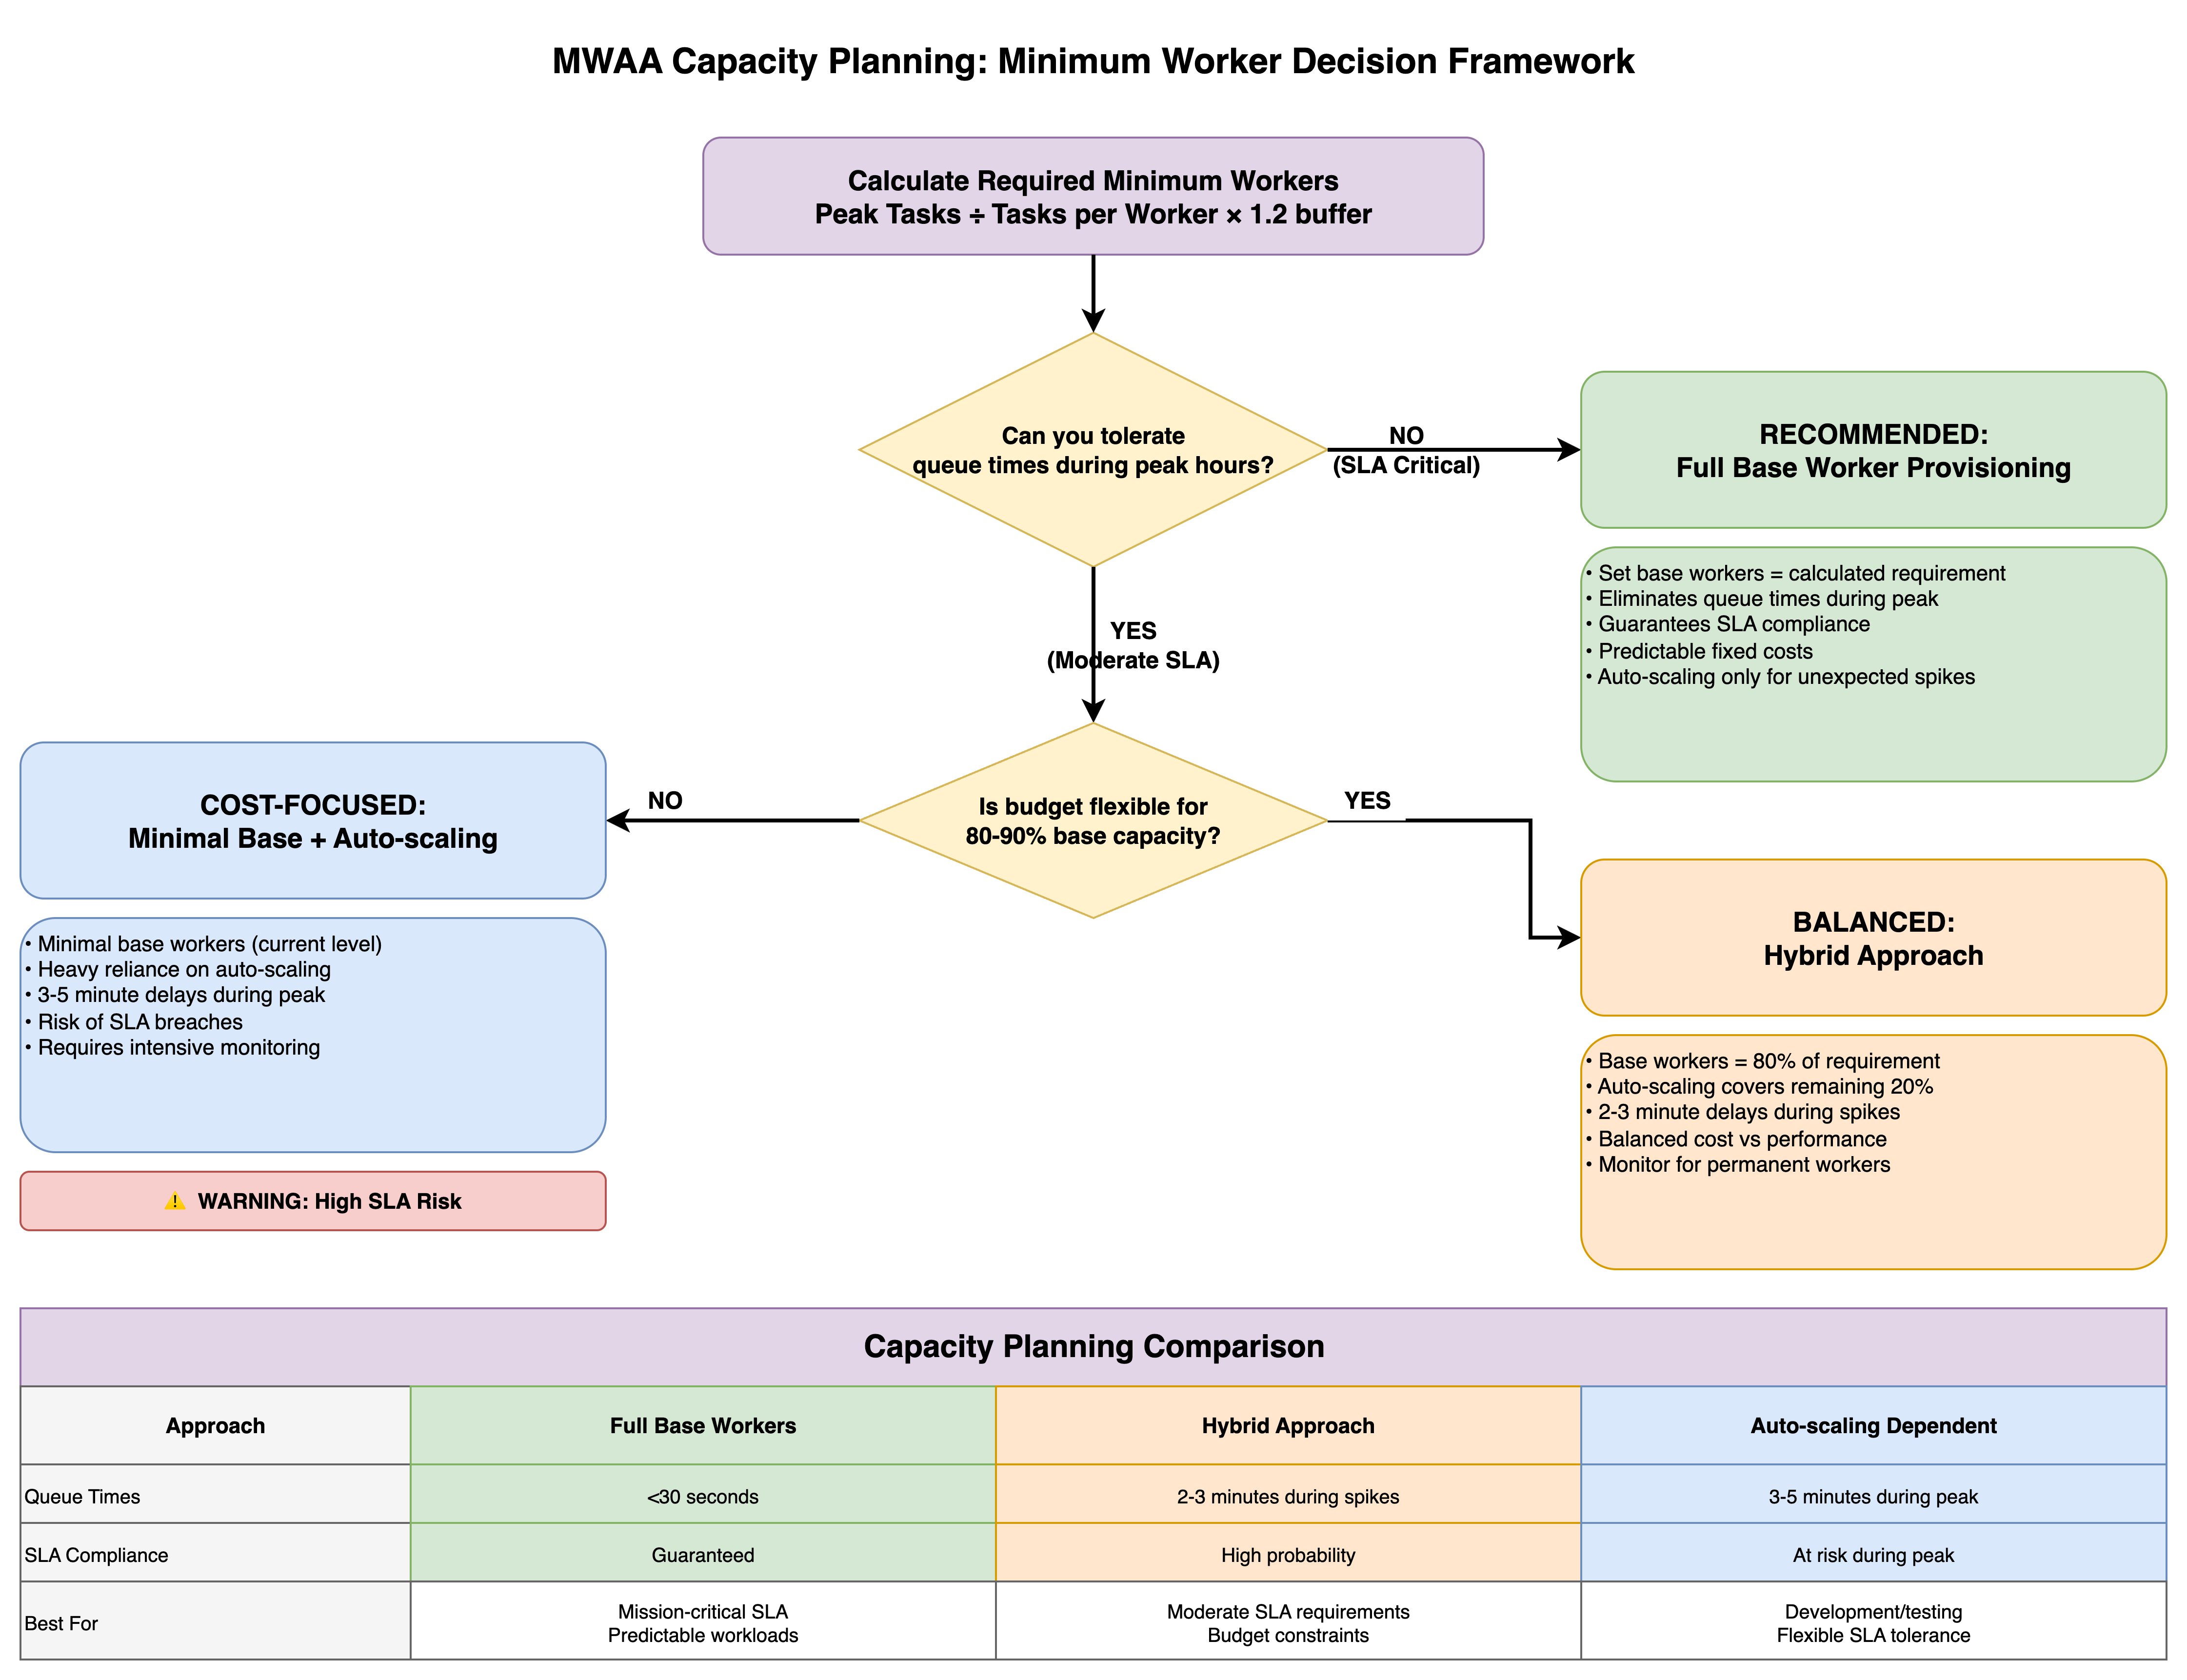
Decision matrix
The framework presents three capacity planning approaches, each optimized for different organizational priorities.
The Full Base Worker Provisioning strategy (the conservative path) sets base workers equal to the calculated requirement, eliminating queue times during peak periods and guaranteeing SLA compliance with predictable fixed costs, while automatic scaling handles only unexpected spikes—ideal for mission-critical workloads with strict SLA requirements.
The Minimal Base + Automatic Scaling approach (the cost-focused path) maintains minimal base workers at current levels and relies heavily on automatic scaling, accepting 3-5 minute delays during peak periods and SLA breach risks in exchange for lower baseline costs, though this requires intensive monitoring and carries explicit warnings about high SLA risk.
The Hybrid Approach (the balanced path) provisions base workers at 80% of the calculated requirement with automatic scaling covering the remaining 20%, resulting in 2-3 minute delays during spikes while balancing cost against performance—suitable for moderate SLA requirements with some budget constraints.
The comparison table contrasts queue times (under 30 seconds versus 2-3 minutes versus 3-5 minutes), SLA compliance levels (guaranteed versus high probability versus at-risk during peak), and ideal use cases (mission-critical predictable workloads versus moderate SLA requirements with budget constraints versus development environments with flexible SLA tolerance), enabling teams to make informed provisioning decisions aligned with their operational requirements and financial constraints.
Key takeaway
Effective capacity planning prevents both under-provisioning (SLA breaches) and over-provisioning (cost overruns).
Capacity planning principles
- Calculate capacity needs BEFORE adding workload – Use peak task projections with 5-15% safety buffer
- Size minimum workers for peak demand – Don’t rely on automatic scaling for predictable loads
- Use automatic scaling only for unexpected spikes – Treat as safety net, not primary capacity
- Target 85-95% utilization during peak hours – Ensures headroom for unexpected growth
- Plan 5-15% headroom for unexpected growth – Production often differs from testing
- Monitor AdditionalWorkers metric – If active >6 hours daily, increase base workers
- Review quarterly + trigger-based assessments – Regular reviews plus immediate action on issues
- Balance cost and performance based on SLA criticality – Business impact justifies infrastructure investment
Success metrics
- Queue efficiency: Average queue time <30 seconds during peak
- SLA compliance: >99.5% of critical tasks complete on time
- Resource utilization: 85-95% during peak hours (optimal efficiency)
- Cost predictability: <10% variance in monthly worker costs
Conclusion
Capacity planning is not a one-time exercise. It’s an ongoing discipline. The framework we’ve outlined gives you a repeatable process: measure your current peak utilization through CloudWatch metrics, project growth based on incoming workloads, calculate the required workers with an appropriate safety buffer, and monitor continuously to catch drift before it becomes an outage.
The financial services scenario in this post illustrates a common reality: running at 100% utilization during peak hours leaves zero room for the unexpected. By sizing to 95% peak utilization with a modest buffer, the team gained the headroom needed to absorb volatility without risking their 7 AM market-open SLA.
Whether you choose full base worker provisioning for mission-critical pipelines, a hybrid approach for moderate SLA requirements, or lean on automatic scaling for development workloads, the right strategy depends on your business context, not a one-size-fits-all rule. Pair your capacity plan with the CloudWatch alarms and review triggers we covered, and you’ll catch capacity gaps early.
Combined with the optimization-first approach from Part 1, you now have a complete toolkit: diagnose before you scale, optimize before you provision, and plan before you deploy. Your MWAA environment and your on-call engineers will thank you.
To get started, visit the Amazon MWAA product page and the Amazon MWAA console page.
If you have questions or want to share your MWAA capacity planning, leave a comment.