AWS Big Data Blog
Amazon OpenSearch Serverless monitoring: A CloudWatch setup guide
Amazon OpenSearch Serverless simplifies the deployment and management of OpenSearch workloads by automatically scaling based on your usage patterns. The service considers key metrics such as shard utilization, storage consumption, and CPU usage while maintaining millisecond-level response times, with the simplicity of a serverless environment.
While OpenSearch Serverless handles scaling automatically, implementing robust monitoring remains crucial for understanding usage patterns, optimizing costs, helping to ensure performance, and maintaining reliability. Proactive monitoring helps organizations detect critical issues with the applications or infrastructure in real time and identify root causes quickly.
This post is part of our Amazon OpenSearch service monitoring series, focusing on OpenSearch Serverless workloads and deployments. In this post, we explore commonly used Amazon CloudWatch metrics and alarms for OpenSearch Serverless, walking through the process of selecting relevant metrics, setting appropriate thresholds, and configuring alerts. This guide will provide you with a comprehensive monitoring strategy that complements the serverless nature of your OpenSearch deployment while maintaining full operational visibility.
Key benefits of CloudWatch monitoring for OpenSearch Serverless
Implementing CloudWatch monitoring for your OpenSearch Serverless collections offers several key advantages:
- Near real-time performance monitoring – CloudWatch provides near real-time monitoring, enabling you to track your OpenSearch Serverless collections’ performance as they operate. This immediate visibility allows for swift detection of anomalies or performance issues, enabling prompt response to potential problems.
- Efficient error diagnosis – You can quickly identify and address common errors without extensive log analysis. For instance, by monitoring ingestion request errors, you can preemptively mitigate bulk indexing request failures.
- Proactive alerting system – Use the CloudWatch alarm functionality in conjunction with Amazon Simple Notification Service (SNS) to set up custom alerts. By defining specific thresholds for critical metrics, you can receive instant notifications through email or SMS when your OpenSearch Serverless collections approach or exceed these limits.
- Comprehensive historical analysis – The data retention capabilities of CloudWatch allow for in-depth historical analysis. This helps you to identify long-term performance trends, recognize recurring patterns in resource utilization and optimize workload distribution based on historical insights.
Solution overview
Understanding which metrics to monitor in OpenSearch Serverless helps optimize your system’s performance and reliability. This guide explains the key metrics to monitor, their significance, how to determine appropriate thresholds, and the step-by-step process for setting up alarms. Understanding these fundamentals will help you establish effective monitoring for your OpenSearch Serverless collections and help maintain optimal performance and reliability.
Prerequisites
Before getting started, you must have the following prerequisites:
- An AWS account that provides access to AWS services.
- An OpenSearch Serverless collection.
CloudWatch metrics and recommended alarms for OpenSearch Serverless
The following table summarizes key CloudWatch metrics for OpenSearch Serverless, including recommended alarm thresholds, metric descriptions, and applicable workload types.
| Alarm | Metric Level | Metric Description | Alarm Description | Use case |
| IndexingOCU maximum is >= 10 for 5 minutes, three consecutive times | Account Level |
Serverless compute capacity is measured in OpenSearch Compute Units (OCUs). Each OCU is a combination of 6 GiB of memory and corresponding virtual CPU (vCPU), in addition to data transfer to Amazon Simple Storage Service (Amazon S3). The IndexingOCU metric reports the number of OCUs used for data ingestion across all collections. |
This alarm will alert you when Indexing OCUs scale upto / beyond 10 for more than 15 minutes. | Monitor and Optimize Costs |
| SearchOCU maximum is >= 10 for 5 minutes, three consecutive times | Account Level |
Serverless compute capacity is measured in OCUs. Each OCU is a combination of 6 GiB of memory and corresponding virtual CPU (vCPU), in addition to data transfer to Amazon S3. The SearchOCU metric reports the number of OCUs used to search collection data across all collections. |
This alarm will alert you when Search OCUs scale upto / beyond 10 for more than 15 minutes. | Monitor and Optimize Costs |
| IngestionRequestLatency maximum is >= 3 secs for 1 minutes, five consecutive times. | Collection Level | The IngestionRequestLatency metric reports the latency, in seconds, for bulk write operations to a collection. | This alarm monitors the maximum latency of bulk write operations to a collection. It triggers when the maximum IngestionRequestLatency exceeds 3 seconds for five consecutive 1-minute intervals (for a total of 5 minutes). This indicates a sustained performance degradation in data ingestion operations, which could impact application performance and data availability. | This metric might be crucial to monitor for log-based workloads, where indexing time is critical. |
| SearchRequestLatency maximum is >= 2 secs for 1 minutes, five consecutive times. | Collection Level | The SearchRequestLatency metric reports the latency, in seconds, that it takes to complete a search operation against a collection. | This alarm monitors the maximum latency of search operations against a collection. It triggers when the maximum SearchRequestLatency exceeds 2 seconds for five consecutive 1-minute intervals (for a total of 5 minutes). Consistently high search latency indicates performance issues that could degrade user experience and application responsiveness. | This metric might be crucial to monitor for vector and search-based workloads, where search time is critical. |
| IngestionRequestErrors sum is >= 100 errors for 1 minute, five consecutive times | Collection Level | The IngestionRequestErrors metric reports the total number of bulk indexing request errors to a collection. OpenSearch Serverless emits this metric when there are bulk indexing request failures, such as an authentication or availability issue. | This alarm monitors the total count of failed bulk indexing operations to a collection. It triggers when the number of IngestionRequestErrors equals or exceeds 100 errors for five consecutive 1-minute intervals (for a total of 5 minutes). | Persistent ingestion errors indicate systemic issues that could lead to data loss or inconsistency. |
| SearchRequestErrors sum is >= 50 errors for 1 minute, five consecutive times | Collection Level | The SearchRequestErrors metric reports the total number of query errors per minute for a collection. | This alarm monitors the total count of failed search query operations in a collection. It triggers when the number of SearchRequestErrors equals or exceeds 50 errors for five consecutive 1-minute intervals (for a total of 5 minutes). | Persistent search errors indicate potential issues that could impact application functionality and user experience. |
| ActiveCollection minimum is 0 for 1 minutes, three consecutive times. | Collection Level | This metric indicates whether a collection is active. A value of 1 means that the collection is in an ACTIVE state. This value is emitted upon successful creation of a collection and remains 1 until you delete the collection. The metric can’t have a value of 0. | The alarm triggers when the metric is missing for three consecutive 1-minute intervals (for a total of 3 minutes). Because an active collection always emits a value of 1, missing data indicates the collection has been deleted or is experiencing serious issues.
Note: Make sure to setup the CloudWatch alarm so that it will treat missing data as breaching. |
Monitor Availability of Collection |
The specific threshold values mentioned are examples. However, you may need to adjust these thresholds based on the unique requirements and SLAs of your own applications and workloads running on OpenSearch Serverless.
To decide when to raise the global OCU limits, you should regularly review the IndexingOCU and SearchOCU metrics at the account level. If you notice the metrics consistently approaching the set threshold, it’s a good indication that you should consider increasing the overall account limits to accommodate your growing usage.
Additionally, monitor the collection-level metrics like IngestionRequestLatency and SearchRequestLatency. If you notice certain collections have consistently high latency, it might be a sign that the OCU allocation for those specific collections is insufficient. In such cases, you could consider increasing the OCU limits for those high-usage collections, rather than raising the global account limits.
By closely monitoring both the account-level and collection-level metrics, you can make informed decisions about when and how to adjust your OCU limits to maintain optimal performance and cost efficiency for your OpenSearch Serverless deployment.
Steps to create a CloudWatch alarm
CloudWatch Alarms can be created using any of the following methods:
- AWS Management Console
- AWS Command Line Interface (AWS CLI)
- CloudFormation template (JSON or / YAML)
Detailed steps and a / sample code snippet for each method are provided in the following sections.
Using the console
The AWS Management Console provides a user-friendly, visual interface for creating CloudWatch alarms. Follow these step-by-step instructions to set up your alarm through the console.
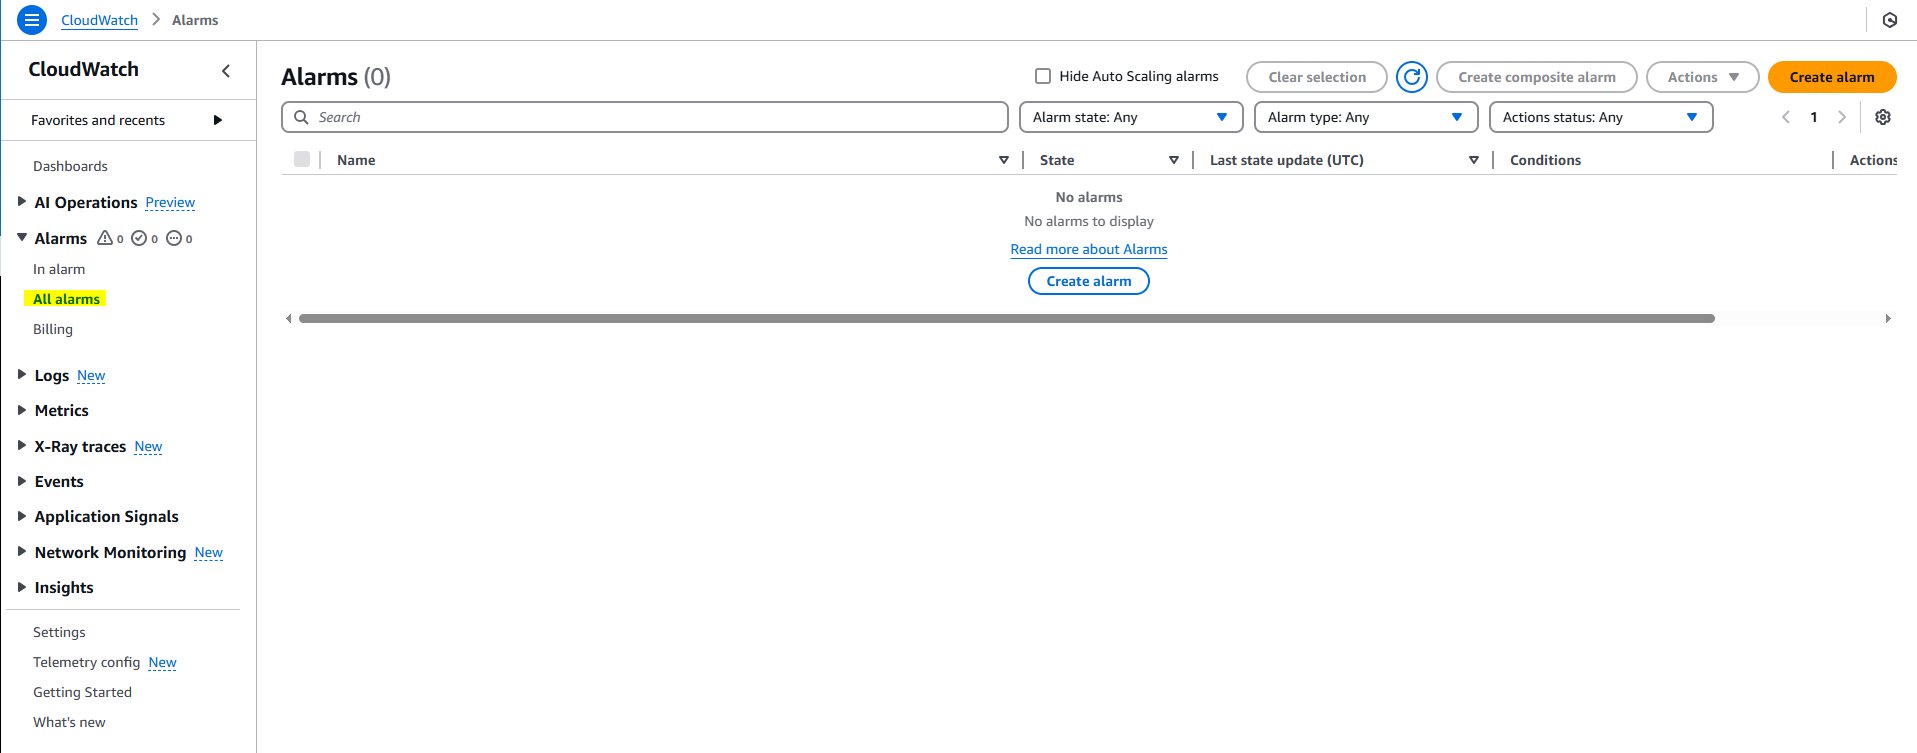
- Navigate to the CloudWatch console
- In the navigation pane, choose Alarms and then, All alarms.
- Choose Create alarm.
- Choose Select Metric.
- Select the namespace AOSS
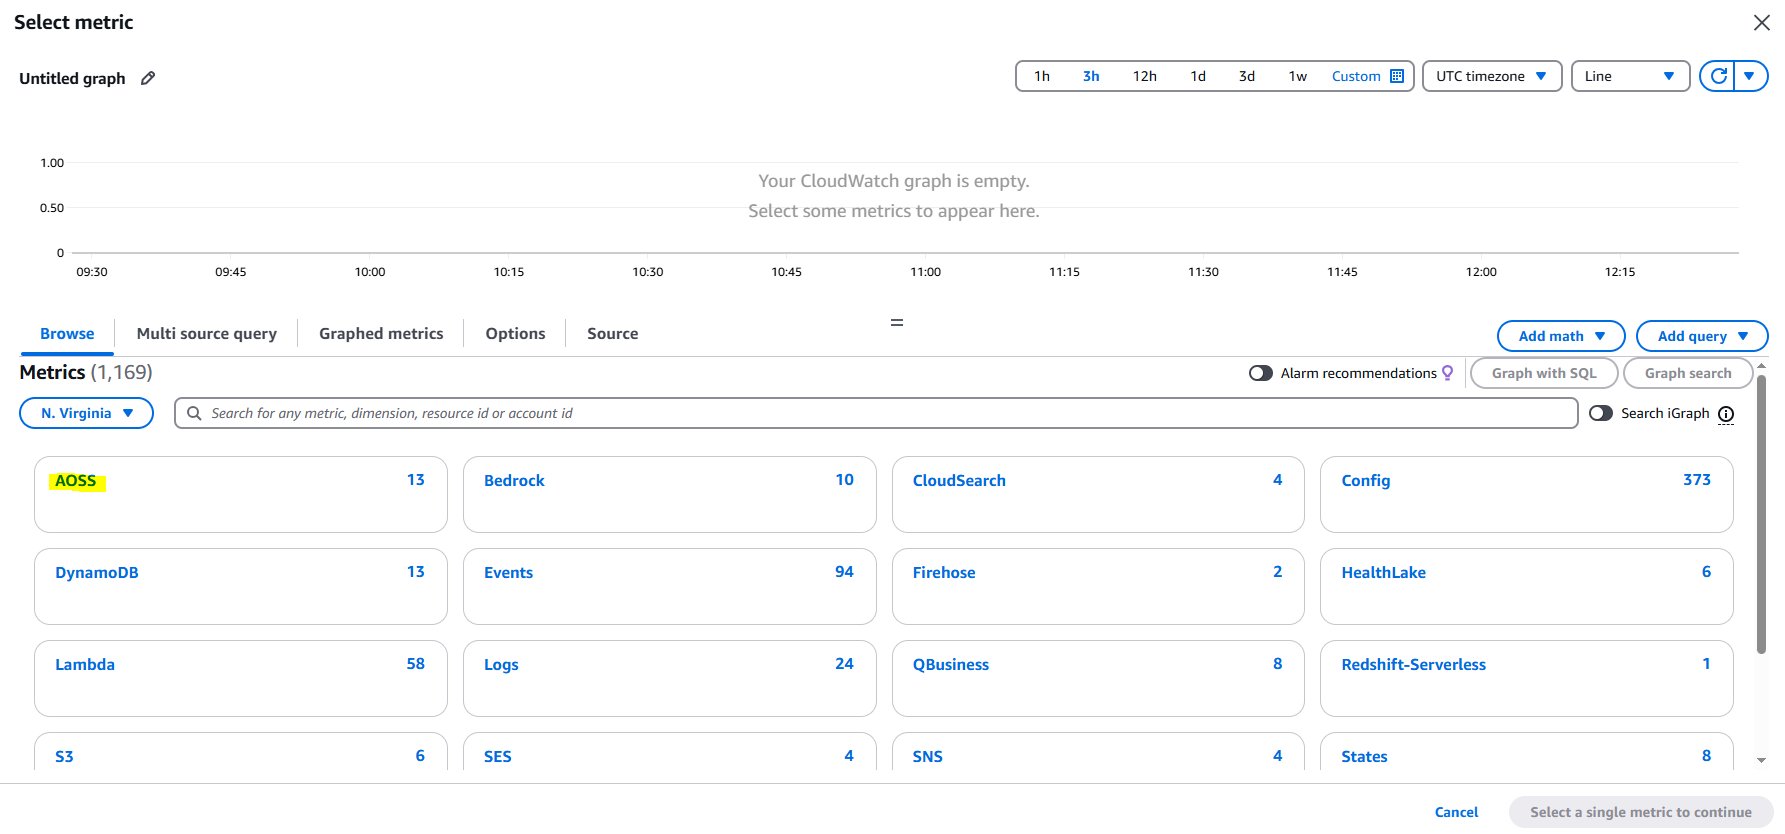
- To setup alerting on IndexingOCU across all collections, navigate to ClientId and select the metric.
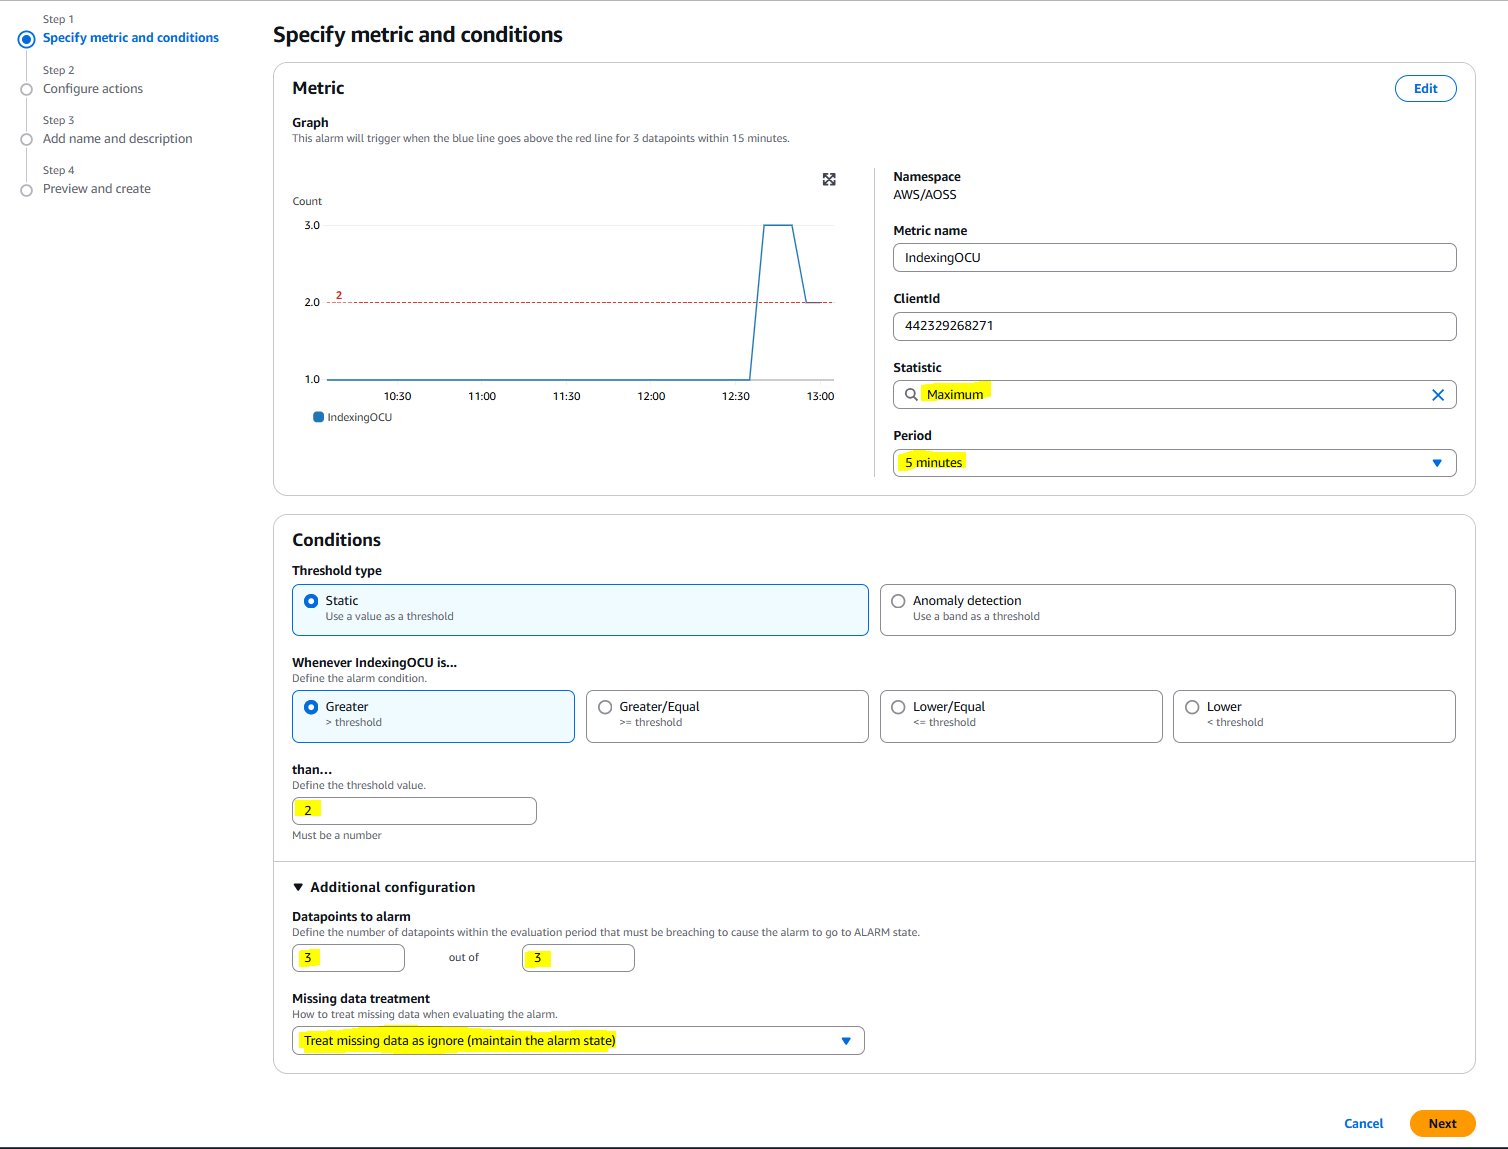
- Under Conditions:
- For Statistic: Select Maximum.
- For Period: Select 5 minutes.
- For Threshold type: Choose Static and Greater.
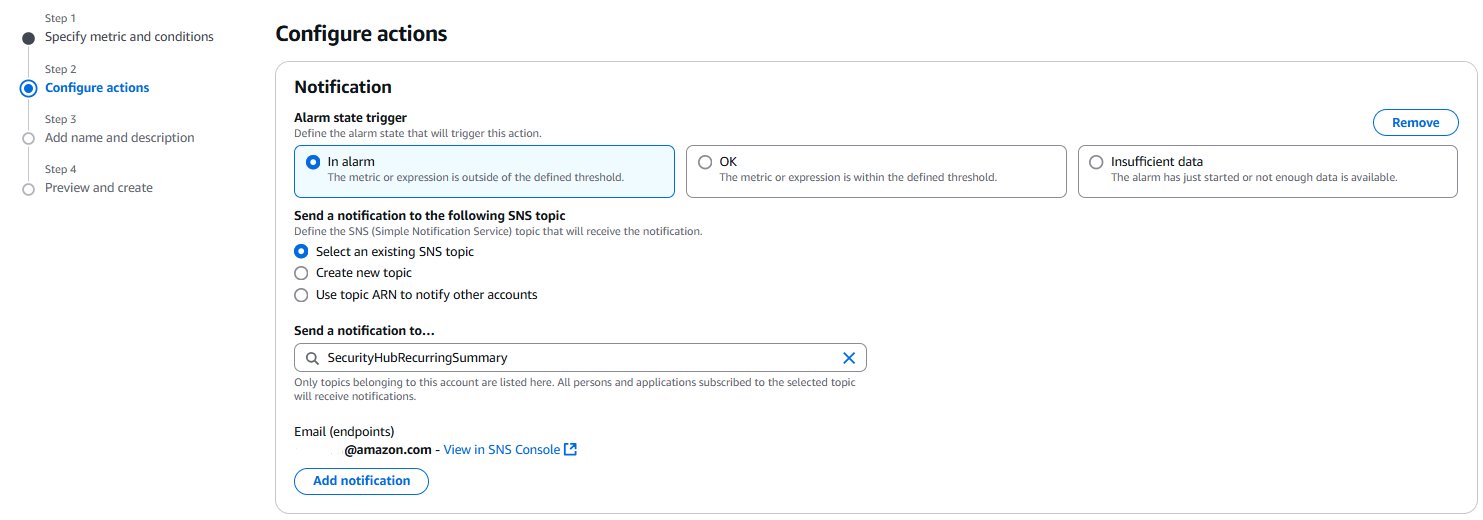
- Choose Next. Under Notification, select an SNS topic to notify when the alarm is in
ALARMstate,OKstate, orINSUFFICIENT_DATAstate.
- When finished, choose Next. Enter a name and description for the alarm. The name must contain only UTF-8 characters, and can’t contain ASCII control characters. The description can include markdown formatting, which is displayed only in the alarm Details tab in the CloudWatch console. The markdown can be useful to add links to runbooks or other internal resources. Then choose Next.
- Under Preview and create, confirm that the information and conditions are what you want, then choose Create alarm.
For detailed documentation, refer to Create a CloudWatch alarm based on a static threshold.
Using the AWS CLI
For those who prefer command-line interfaces or need to automate alarm creation, the AWS CLI offers an efficient alternative. This section demonstrates how to create a CloudWatch alarm using a single CLI command.
To set up a CloudWatch alarm using the AWS CLI, you can use the put-metric-alarm command. The following example demonstrates how to create an alarm that sends an Amazon SNS email when the IndexingOCU exceeds 2 for 15 minutes at the account level. Replace [region] and [account-id] with your AWS Region and account ID.
CloudFormation JSON
Infrastructure as Code (IaC) enables version-controlled, repeatable deployments. This JSON template shows how to define a CloudWatch alarm using AWS CloudFormation, suitable for those who prefer JSON syntax for their IaC implementations.
Replace [region] and [account-id] with your AWS Region and account ID.
CloudFormation YAML
For teams that prefer YAML’s more readable format, this section provides the equivalent CloudFormation template in YAML. The template creates the same CloudWatch alarm with identical configurations as the JSON version.
Replace [region] and [account-id] with your AWS Region and account ID.
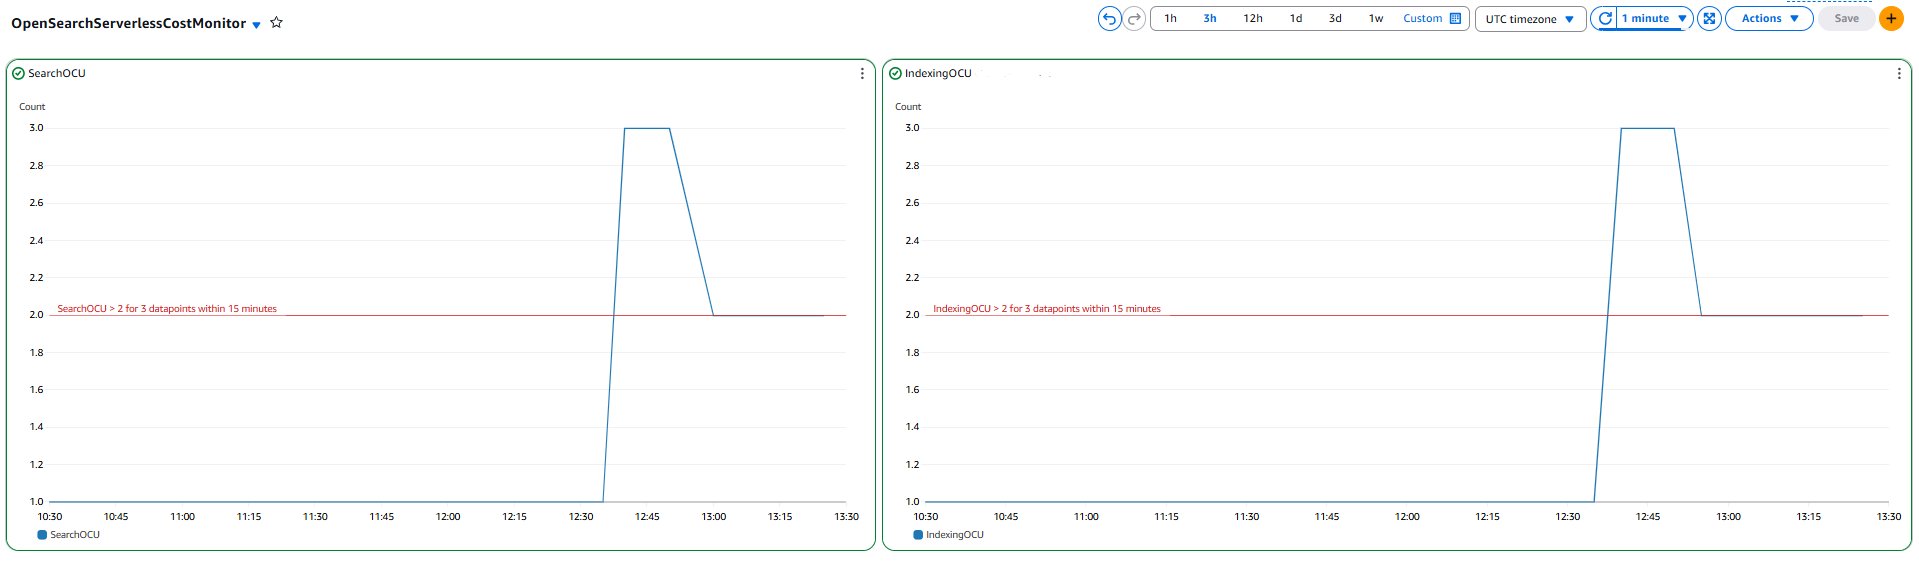
CloudWatch dashboards
You can use Amazon CloudWatch dashboards to monitor multiple resources in a unified view. For example, the following dashboard provides a consolidated view of OpenSearch Serverless OCU usage, helping you track and manage costs.
Clean up
To avoid incurring unintended future charges, delete the following resources that were created as part of solution walk-through of this post:
- CloudWatch alarms
- CloudFormation stacks
- SNS topics
Conclusion
Effective monitoring helps maintain optimal performance and reliability of your OpenSearch Serverless collections. By implementing the CloudWatch alarms and monitoring strategies outlined in this post, you can work towards proactively identifying and responding to performance issues before they impact your applications, optimize costs by tracking OCU usage patterns, support high availability objectives by monitoring collection health and error rates, and help maintain consistent performance through latency monitoring. Remember that the thresholds suggested in this guide serve as a starting point, you should adjust them based on your specific use cases, performance requirements, and budget constraints. Regular review and refinement of these alarms will help you maintain an efficient and cost-effective OpenSearch Serverless deployment.
Related links
Monitoring Amazon OpenSearch Serverless
Create a CloudWatch alarm based on a static threshold