AWS Big Data Blog
Author: Sahitya Pandiri

Send personalized email reports with Amazon QuickSight
Amazon QuickSight now supports personalization of email reports by user, which allows you to send customized snapshots of data in either PDF or image formats. This allows you to create a single dashboard that you can configure to load with different defaults for each user, providing a customized view of the dashboard in both email […]

An updated Amazon QuickSight sign-in experience
This blog post was last updated on September 14th 2022 to reflect the launch being generally available in all QuickSight regions. More details here. Amazon QuickSight launched changes in the sign-in domain and a new look and feel while signing in. This doesn’t impact your access to QuickSight. In this post, we walk through changes […]

Enhancing dashboard interactivity with Amazon QuickSight Actions
Amazon QuickSight now offers enhanced dashboard interactivity capabilities through QuickSight Actions. QuickSight Actions provide advanced filtering capabilities through single point-and-click actions on dashboards. With Actions, you can link visuals within a dashboard so that selecting a dimensional point on one visual provides you with granular insights on the selected point on other visuals within your dashboard. Therefore, you can start with summaries and dive deep into details of your business metrics, all within the same dashboard sheet. You can define what visuals within your dashboard are interactive and how these interact with each other. As of this writing, QuickSight Actions lets you define two primary actions of interactivity: filter actions and URL actions. URL actions within Amazon QuickSight are not new, but the point of entry to create URL actions is now consolidated with Actions.

Amazon QuickSight updates: Multiple sheets in dashboards, axis label orientation options, and more
Today, we are pleased to announce a set of updates to Amazon QuickSight: Richer dashboards with multiple sheets in your regular and embedded dashboards, multiple axis label orientation options for better readability of dashboards, more calculations such as standard deviation, variance and conditional string functions on SPICE, enhanced URL actions for supporting a broader set of interaction scenarios, and one-click duplication of visuals for faster authoring.
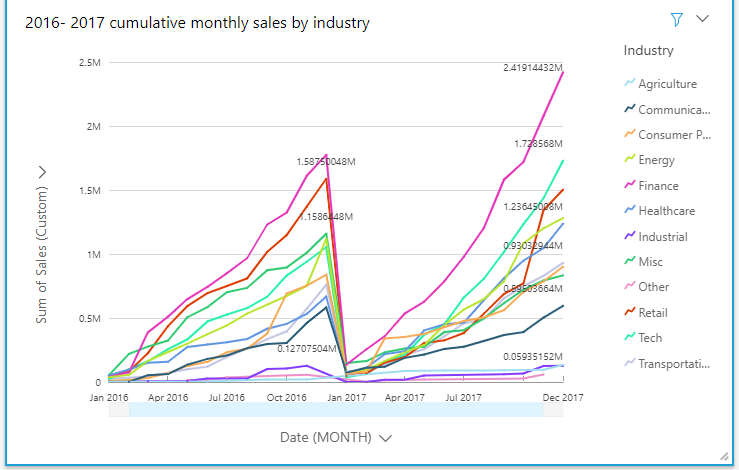
Advanced analytics with table calculations in Amazon QuickSight
Amazon QuickSight recently launched table calculations, which enable you to perform complex calculations on your data to derive meaningful insights. In this blog post, we go through examples of applying these calculations to a sample sales data set so that you can start using these for your own needs. You can find the sample data […]