AWS Big Data Blog
Amazon QuickSight updates: Multiple sheets in dashboards, axis label orientation options, and more
Today, we are pleased to announce a set of updates to Amazon QuickSight:
- Richer dashboards with multiple sheets in your regular and embedded dashboards
- Multiple axis label orientation options for better readability of dashboards
- More calculations such as standard deviation, variance and conditional string functions on SPICE
- Enhanced URL actions for supporting a broader set of interaction scenarios
- One-click duplication of visuals for faster authoring
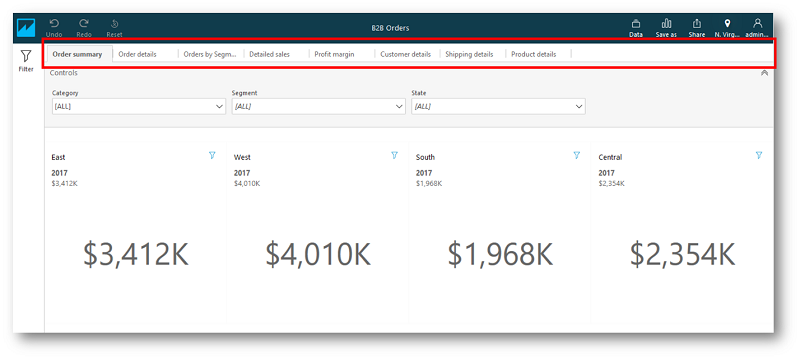
Multiple sheets in Dashboards
First, let’s look at the update to dashboards that allows multiple sheets, accessed via a new tab control. This allows better organization of information within the dashboard, where visuals related to specific subject areas or topics can be organized in separate sheets and distinctly identified through the tab name. As a reader, you can then navigate to a single dashboard to get a comprehensive view of all the insights related to a topic.
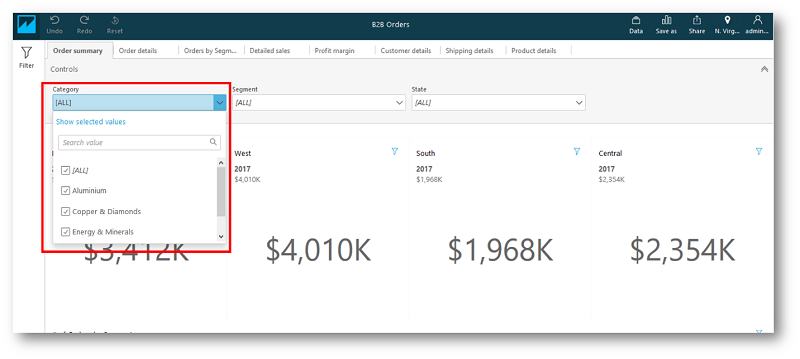
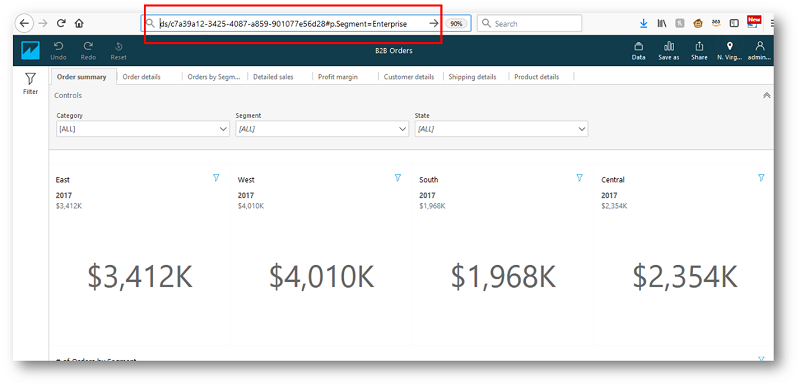
Each sheet within a dashboard has a distinct URL, which allows you to bookmark the specific sheet, or share a link to the specific sheet with others. Additionally, dashboards can also be setup to filter content at a dashboard level, or at a per-sheet level, with the filters being passed either via on-screen controls or using the URL.
Filtering through on-screen controls
Navigating to another dashboard and passing filters via URL
If you are authoring a dashboard, you will find that every dashboard now starts off as a single sheet. You can use the “add sheet” icon in the tabs section to add a new sheet to your dashboard. Note that the tab control only shows up on a dashboard if there is more than one sheet. When authoring, you will also be able to rename a sheet, change the order of sheets or delete a sheet. The first sheet will always be the one presented to your readers by default, so this would be where you want to provide a summary of the dashboard with KPIs, ML-Insights, or high level trends. Email reports will send the first sheet of the dashboard to all your viewers; we are working on additional rendering options for email reports.
Previously, on the Big Data Blog, we covered ways to add parameters and on-screen controls to dashboards. Parameter values are global across a dashboard, which allow you to maintain user inputs and filter content according to user selections across the dashboard. On-screen controls are specific to each sheet, since the context of these controls is often confined to the sheet itself. If you want to discreetly filter data based on user or group-level attributes, you may also use row-level security to do so.
Multi-sheet dashboards can be shared through the regular website, or can be embedded in your custom application. To embed a dashboard in your application, visit Embed interactive dashboards in your application with Amazon QuickSight.
Axis label orientation
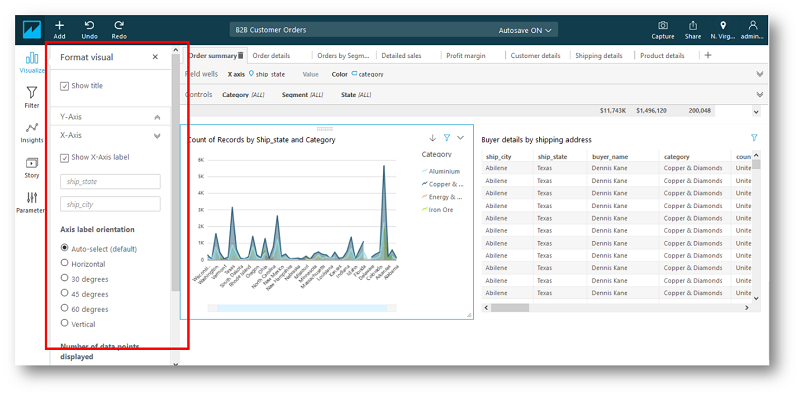
When authoring a dashboard, you will see that Amazon QuickSight now automatically selects a horizontal or angled layout to provide better readability. You can also manually navigate to a visual’s options menu and choose “Format visual”, and then choose the axis label orientation that is most suited to your dashboard.
Duplicate visual option
When authoring a dashboard, there are often situations where you want to quickly clone a visual and make changes. With the new “Duplicate visual” option, Amazon QuickSight allows you to achieve this via a one-click action from the visual’s options menu. This new option creates a copy of the visual, along with its filters and other settings such as visual size and format, within the same sheet or a different sheet within the dashboard, thus removing the overhead of creating visuals from scratch each time.

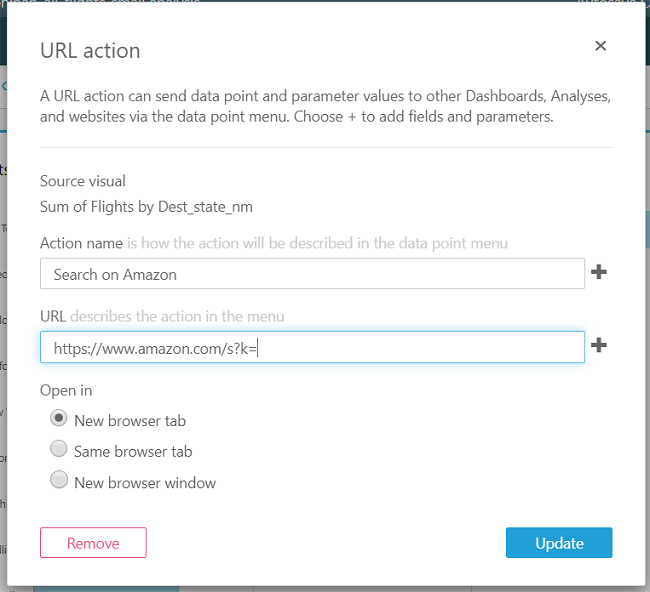
URL action open options
URL actions allow you to configure actions outside of QuickSight that can be triggered by a user viewing a QuickSight dashboard. With today’s release we will allow you to choose how these URLs are opened, with options of overriding the viewer’s QuickSight browser tab, loading in a new tab, or a new browser window altogether.
In addition to these features that improve author and reader experience, QuickSight now supports additional statistical capabilities through new functions in calculated fields. These statistical functions include standard deviation and variance calculations and conditional functions on string fields. With standard deviation and variance, you can now determine dispersion of a metric relative to the mean. You can do this across your entire data set or partition by a select dimension. For more information, see Functions by Category in the Amazon QuickSight User Guide.
With conditional string functions on SPICE, you can now use coalesce, ifelse, isNotNull, isNull, nullif while building reports on SPICE datasets. For more information, see Calculated Field Function and Operator Reference for Amazon QuickSight in the Amazon QuickSight user guide.
All of these new features are now available in both Standard and Enterprise Editions in all supported Amazon QuickSight regions – US East (N. Virginia and Ohio), US West (Oregon), EU (Ireland), and Asia Pacific (Singapore, Sydney and Tokyo).
About the Author
 Sahitya Pandiri is a technical program manager with Amazon Web Services. Sahitya has been in the product/program management for 5 years now, and has built multiple products in the retail, healthcare and analytics spaces. She enjoys problem solving, and leveraging technology to simplify processes.