AWS Big Data Blog
Scaling cluster manager and admin APIs in Amazon OpenSearch Service
Amazon OpenSearch Service is a managed service that makes it simple to deploy, secure, and operate OpenSearch clusters at scale in the AWS Cloud. A typical OpenSearch cluster is comprised of cluster manager, data, and coordinator nodes. It is recommended to have three cluster manager nodes, and one of them will be elected as a leader node.
Amazon OpenSearch Service introduced support for 1,000-node OpenSearch Service clusters capable of handling 500,000 shards with OpenSearch Service version 2.17. For large clusters, we have identified bottlenecks in admin API interactions (with the leader) and introduced improvements in OpenSearch Service version 2.17. These improvements have helped OpenSearch Service to publish cluster metrics and monitor at same frequency for large clusters while maintaining the optimal resource usage (less than 10% CPU and less than 75% JVM usage) on the leader node (16 core CPU with 64 GB JVM heap). It has also ensured that metadata management can be performed on large clusters with predictable latency without destabilizing the leader node.
General monitoring of an OpenSearch node using health check and statistics API endpoints doesn’t cause visible load to the leader. But as the number of nodes increase in the cluster, the volume of these monitoring calls also increases proportionally. The increase in the call volume coupled with the less optimal implementation of these endpoints overwhelms the leader node, resulting in stability issues. In this post, we demonstrate the different bottlenecks that were identified and the corresponding solutions that were implemented in OpenSearch Service to scale cluster manager for large cluster deployments. These optimizations are available to all new domains or existing domains upgraded to OpenSearch Service versions 2.17 or above.
Cluster state
To understand the various bottlenecks with the cluster manager, let’s examine the cluster state, whose management is the core operation of the leader. The cluster state contains the following key metadata information:
- Cluster settings
- Index metadata, which includes index settings, mappings, and alias
- Routing table and shard metadata, which contains details of shard allocation to nodes
- Node information and attributes
- Snapshot information, custom metadata, and so on
Node, index, and shard are managed as first-class entities by the cluster manager and contain information such as identifier, name, and attributes for each of their instances.
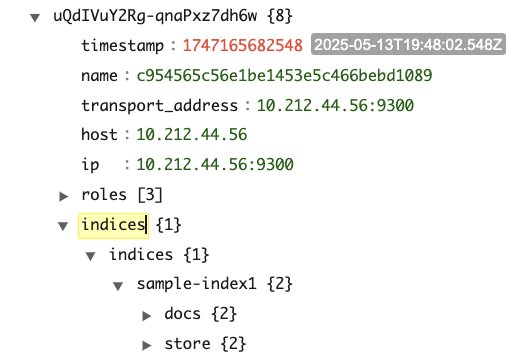
The following screenshots are from a sample cluster state for a cluster with three cluster manager and three data nodes. The cluster has a single index (sample-index1) with one primary and two replicas.
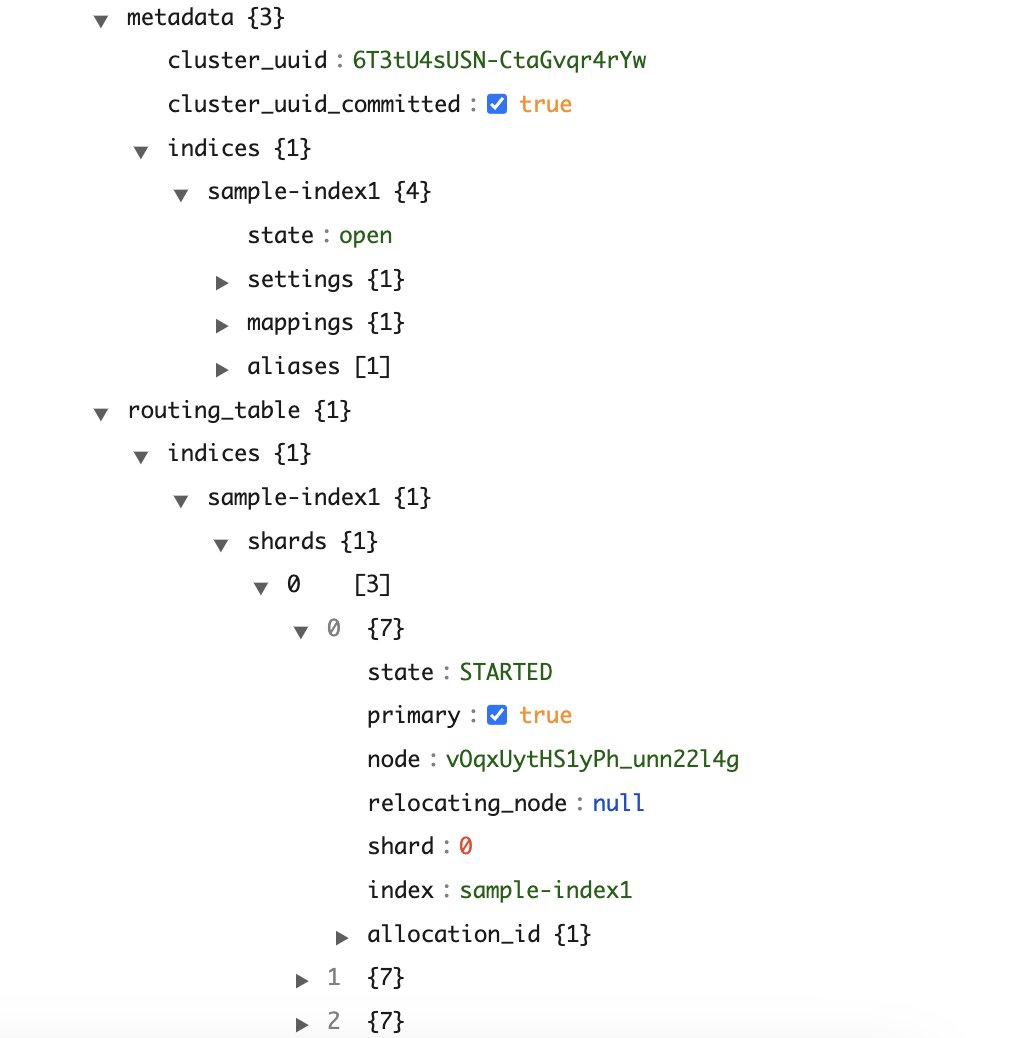
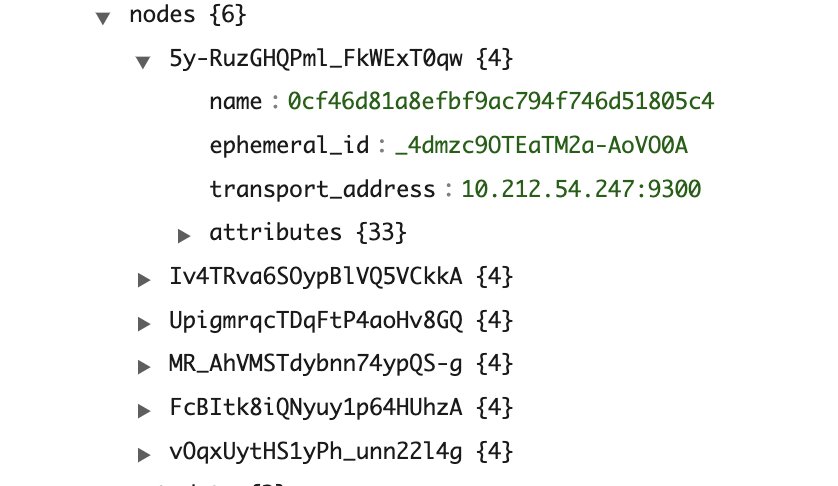
As shown in the screenshots, the number of entries in the cluster state is as follows:
IndexMetadata(metadata#indices) has entries equal to the total number of indexesRoutingTable(routing_table) has entries equal to the number of indexes multiplied by the number of shards per indexNodeInfo(nodes) has entries equal to the number of nodes in the cluster
The size of a sample cluster state with six nodes, one index, and three shards is around 15 KB (size of JSON response from the API). Consider a cluster with 1,000 nodes, which has 10,000 indexes with an average of 50 shards per index. The cluster state would have 10,000 entries for IndexMetadata, 500,000 entries for RoutingTable, and 1,000 entries for NodeInfo.
Bottleneck 1: Cluster state communication
OpenSearch provides admin APIs as a REST endpoint for users to manage and configure the cluster metadata. Admin API requests are handled by either coordinator node (or) by data node if the cluster does not have dedicated coordinator node provisioned. You can use admin APIs to check cluster health, modify settings, retrieve statistics, and more. Some of the examples are the CAT, Cluster Settings, and Node Stats APIs.
The following diagram illustrates the admin API control flow.

Let’s consider a Read API request to fetch information about the cluster settings.
- The user makes the call to the HTTP endpoint backed by the coordinator node.
- The coordinator node initiates an internal transport call to the leader of the cluster.
- The transport handler in the leader node performs a filter and selection of metadata based on the input request from the latest cluster state.
- The processed cluster state is then returned back to the coordinating node, which then generates the response and finishes the request processing.
The cluster state processing on the nodes is shown in the following diagram.
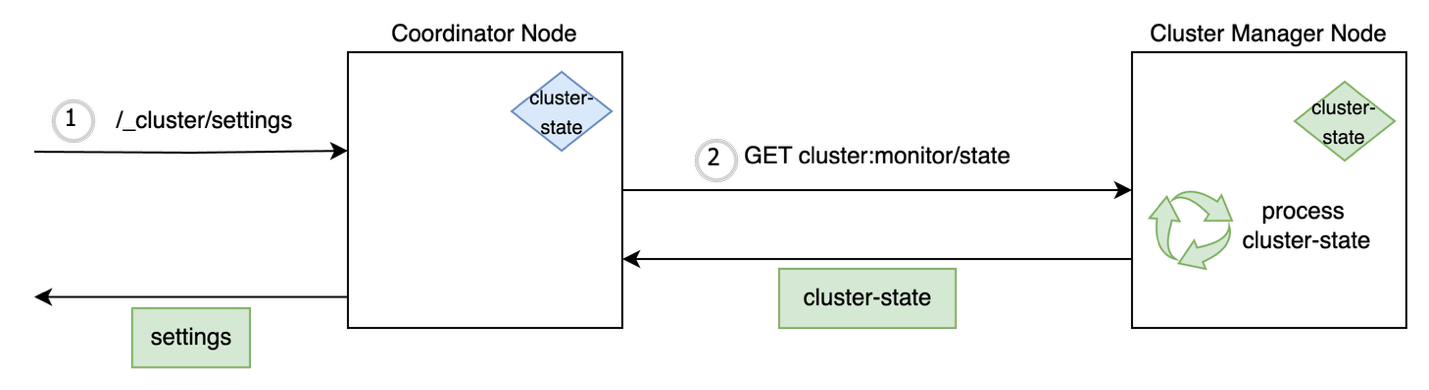
As discussed earlier, most of the admin read requests require the latest cluster state and the node which processes the API request and makes a _cluster/state call to the leader. In a cluster setup of 1,000 nodes and 500,000 shards, the size of the cluster state would be around 250 MB. This can overload leader and cause the following issues:
- CPU usage increases on the leader due to simultaneous admin calls because the leader has to vend the latest state to many coordinating nodes in the cluster simultaneously.
- The heap memory consumption of the cluster state can grow to multiples of 100 MB depending upon the number of index mappings and settings configured by the user. It causes JVM memory pressure to build on the leader, causing frequent garbage collection pauses.
- Repeated serialization and transfer of the large cluster state causes transport worker threads to be busy on the leader node, potentially causing delays and timeouts of further requests.
The leader node sends periodic ping requests to follower nodes and requires transport threads to process the responses. Because the number of threads serving the transport channel is limited (defaults to the number of processor cores), the responses are not processed in a timely fashion. The leader-follower health checks in the cluster get timed out, thereby causing a spiral effect of nodes leaving the cluster and more shard recoveries being initiated by the leader.
Solution: Latest local cluster state
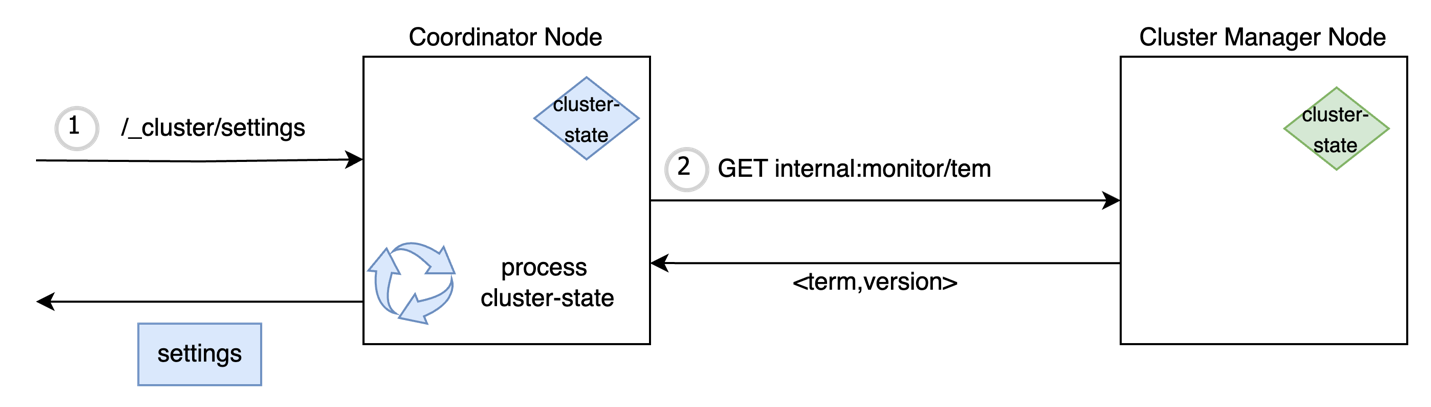
Cluster state is versioned using two long fields: term and version. The term number is incremented whenever a new leader is elected, and the version number is incremented with every metadata update. Given that the latest cluster state is cached on all the nodes, it can be used to serve the admin API request if it is up-to-date with the leader. To check the freshness of the cached copy, a light-weight transport API is introduced, which fetches only the term and version corresponding to the latest cluster state from leader. The request-coordinating node matches it with the local term and version, and if they’re the same, it uses the local cluster sate to serve the admin API read request. If the cached cluster state is out of sync, the node makes a subsequent transport call to fetch the latest cluster state and then serves the incoming API request. This offloads the responsibility of serving read requests to the coordinating node, thereby reducing the load on the leader node.
Cluster state processing on the nodes after the optimization is shown in the following diagram.
Term-version checks for cluster state processing are now used by 17 read APIs across the _cat and _cluster APIs in OpenSearch.
Impact: Less CPU resource usage on leader
From our load tests, we observed at least 50% reduction in CPU usage without a change in the API latency due to the aforementioned improvement. The load test was performed on an OpenSearch cluster consisting of 3 cluster manager nodes (8 cores each), 5 data nodes (64 cores each), and 25,000 shards with a cluster state size of around 50 MB. The workload consists of the following admin APIs invoked, with periodicity mentioned in the following table:
/_cluster/state/_cat/indices/_cat/shards/_cat/allocation
| Request Count / 5 minutes | CPU (max) | |
| Existing Setup | With Optimization | |
| 3000 | 14% | 7% |
| 6000 | 20% | 10% |
| 9000 | 28% | 12% |
Bottleneck 2: Scatter-gather nature of statistics admin APIs
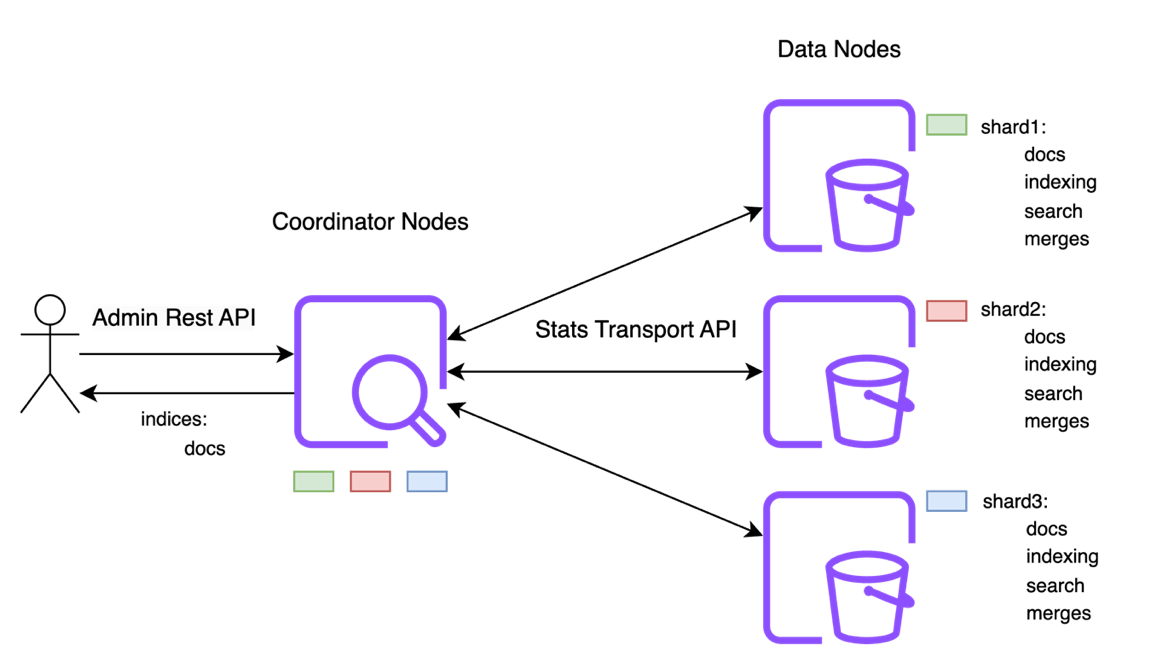
The next group of admin APIs are used to fetch the statistics information of the cluster. These APIs include _cat/indices, _cat/shards, _cat/segments, _cat/nodes, _cluster/stats, and _nodes/stats, to name a few. Unlike metadata, which is managed by the leader, the statistics information is distributed across the data nodes in the cluster.
For example, consider the response to the _cat/indices API for the index sample-index1:
The values for fields docs.count, docs.deleted , store.size, and pri.store.size are fetched from the data nodes, which have the corresponding shards, and are then aggregated by the coordinating node. To compute the preceding response for sample-index1, the coordinator node collects the statistics responses from three data nodes hosting one primary and two replica shards, respectively.
Every data node in the cluster collects statistics related to operations such as indexing, search, merges, and flushes for the shards it manages. Every shard in the cluster has about 150 indices metrics tracked across 20 metric groups.
The response from the data node to coordinator contains all the shard statistics of the index and not just the ones (docs and store stats) requested by the user. The response size of stats returned from data node for a single shard is around 4 KB. The following diagram illustrates the stats data flow among nodes in a cluster.
For a cluster with 500,000 shards, the coordinator node needs to retrieve stats responses from different nodes whose sizes sum to around 2.5 GB. The retrieval of such large response sizes can cause the following issues:
- High network throughput volume between nodes.
- Increased memory pressure because statistics responses returned by data nodes are accumulated in memory of the coordinator node before constructing the user-facing response.
The memory pressure can cause a circuit breaker of the coordinator node to trip, resulting in 429 TOO MANY REQUEST responses. It also results in an increase in CPU utilization on the coordinator node due to garbage collection cycles being triggered to reclaim the heap used for stats requests. The overloading of the coordinator node to fetch statistics information for admin requests can potentially result in rejecting critical API requests such as health check, search, and indexing, resulting in a spiral effect of failures.
Solution: Local aggregation and filtering
Because the admin API returns only the user-requested stats in the response, it is not required by data nodes to send the entire shard-level stats because it’s not requested by the user. We have now introduced stats aggregation at transport action so each data node aggregates the stats locally and then responds back to the coordinator node. Additionally, data nodes support filtering of statistics so only specific shard stats, as requested by the user, can be returned to the coordinator. This results in reduced compute and memory on coordinator nodes because they now work with responses that are far smaller.
The following output is the shard stats returned by a data node to the coordinator node after local aggregation by index. The response is also filtered based on user-requested statistics. The response contains only docs and store metrics aggregated by index for shards present on the node.
Impact: Faster response time
The following table shows the latency for health and stats API endpoints in a large cluster. These results are for a cluster size of 3 cluster manager nodes, 1,000 data nodes, and 500,000 shards. As explained in the following pull request, the optimization to pre-compute statistics prior to sending response helps reduce response size and improve latency.
| API | Response Latency | |
| Existing Setup | With Optimization | |
| _cluster/stats | 15s | 0.65s |
| _nodes/stats | 13.74s | 1.69s |
| _cluster/health | 0.56s | 0.15s |
Bottleneck 3: Long-running stats request
With admin APIs, users can specify the timeout parameter as part of the request. This helps the client fail fast if requests are taking more time to be processed due to an overloaded leader or data node. However, the coordinator node continues to process the request and initiate internal transport requests to data nodes even after the user’s request gets disconnected. This is wasteful work and causes unnecessary load on the cluster because the response from the data node is discarded by the coordinator after the request has timed out. No mechanism exists for the coordinator to track that the request has been cancelled by the user and further downstream transport calls don’t need to be attempted.
Solution: Cancellation at transport layer
To prevent long-running transport requests for admin APIs and reduce the overhead on the already overwhelmed data nodes, cancellation has been implemented at the transport layer. This is now used by the coordinator to cancel the transport requests to data nodes after the user-specified timeout expires.
Impact: Fail fast without cascading failures
The _cat/shards API fails gracefully if the leader is overloaded in case of large clusters. The API returns a timeout response to the user without issuing broadcast calls to data nodes.
Bottleneck 4: Huge response size
Let’s now look at challenges with the popular _cat APIs. Historically, CAT APIs didn’t support pagination because the metadata wasn’t expected to grow to tens of thousands in size when it was designed. This assumption no longer holds for large clusters and can cause compute and memory spikes while serving these APIs.
Solution: Paginated APIs
After careful deliberations with the community, we introduced a new set of paginated list APIs for metadata retrieval. The APIs _list/indices and _list/shards are pagination counterparts to _cat/indices and _cat/shards. The _list APIs maintain pagination stability, so that a paginated dataset maintains order and consistency even when a new index is added or an existing index is removed. This is achieved by using a combination of index creation timestamps and index names as page tokens.
Impact: Bounded response time
_list/shards can now successfully return paginated responses for a cluster with 500,000 shards without getting timed out. Fixed response sizes facilitate faster data retrieval without overwhelming the cluster for large datasets.
Conclusion
Admin API’s are critical for observability and metadata management of OpenSearch domains. Admin APIs, if not designed properly, introduce bottlenecks in the system and impacts the performance of OpenSearch domains. The improvements made for these APIs in version 2.17 have performance gains for all customers of OpenSearch service irrespective of whether it is large-sized (1,000 nodes), mid-sized (200 nodes), or small-sized (20 nodes). It ensures that elected cluster manager node is stable even when the API’s are exercised for domains with large metadata size. OpenSearch is an open source, community-driven software. The foundational pieces of APIs such as pagination, cancellation, and local aggregation are extensible and can be used for other APIs.
If you would like to contribute to OpenSearch, open up a GitHub issue and let us know your thoughts. You could get started with these open PR’s in Github [PR1] [PR2] [PR3] [PR4].