AWS Big Data Blog
Tag: Dashboard
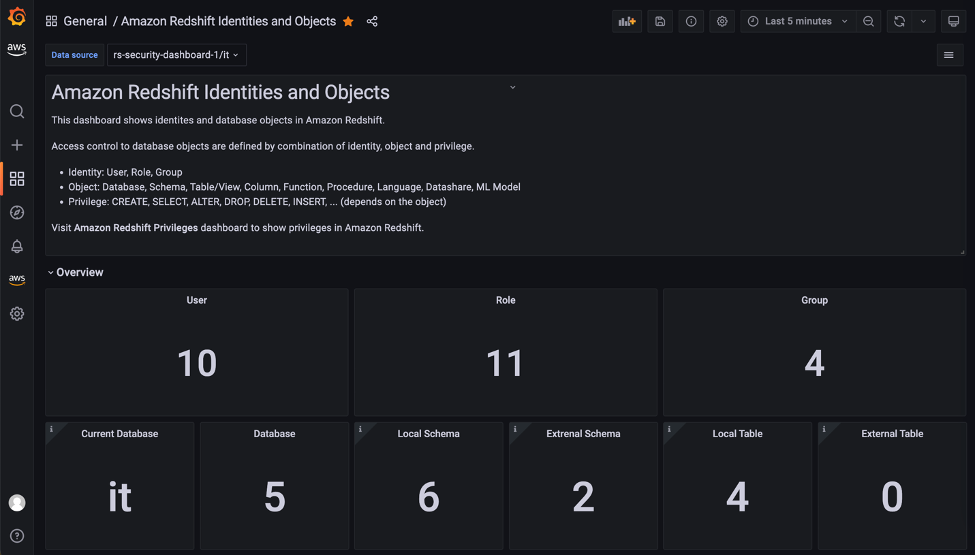
Visualize database privileges on Amazon Redshift using Grafana
Amazon Redshift is a fully managed, petabyte-scale data warehouse service in the cloud. Amazon Redshift enables you to use SQL for analyzing structured and semi-structured data with best price performance along with secure access to the data. As more users start querying data in a data warehouse, access control is paramount to protect valuable organizational […]

Query and visualize Amazon Redshift operational metrics using the Amazon Redshift plugin for Grafana
Grafana is a rich interactive open-source tool by Grafana Labs for visualizing data across one or many data sources. It’s used in a variety of modern monitoring stacks, allowing you to have a common technical base and apply common monitoring practices across different systems. Amazon Managed Grafana is a fully managed, scalable, and secure Grafana-as-a-service […]