AWS Big Data Blog
Category: Amazon Managed Grafana
Migrating from API keys to service account tokens in Grafana dashboards using Terraform
In this blog post, we walk through how to migrate from API keys to service account tokens when automating Amazon Managed Grafana resource management. We will also show how to securely store tokens using AWS Secrets Manager and automate token rotation with AWS Lambda.
Enhance Amazon EMR observability with automated incident mitigation using Amazon Bedrock and Amazon Managed Grafana
In this post, we demonstrate how to integrate real-time monitoring with AI-powered remediation suggestions, combining Amazon Managed Grafana for visualization, Amazon Bedrock for intelligent response recommendations, and AWS Systems Manager for automated remediation actions on Amazon Web Services (AWS).

Process millions of observability events with Apache Flink and write directly to Prometheus
In this post, we explain how the new connector works. We also show how you can manage your Prometheus metrics data cardinality by preprocessing raw data with Flink to build real-time observability with Amazon Managed Service for Prometheus and Amazon Managed Grafana.

Correlate telemetry data with Amazon OpenSearch Service and Amazon Managed Grafana
In this post, we show you how to use Amazon OpenSearch Service and Amazon Managed Grafana to correlate the various observability signals that improve root cause analysis, thereby resulting in reduced Mean Time to Resolution (MTTR). We also provide a reference solution that can be used at scale for proactive monitoring of enterprise applications to avoid a problem before they occur.

Enhance monitoring and debugging for AWS Glue jobs using new job observability metrics, Part 2: Real-time monitoring using Grafana
Monitoring data pipelines in real time is critical for catching issues early and minimizing disruptions. AWS Glue has made this more straightforward with the launch of AWS Glue job observability metrics, which provide valuable insights into your data integration pipelines built on AWS Glue. However, you might need to track key performance indicators across multiple […]
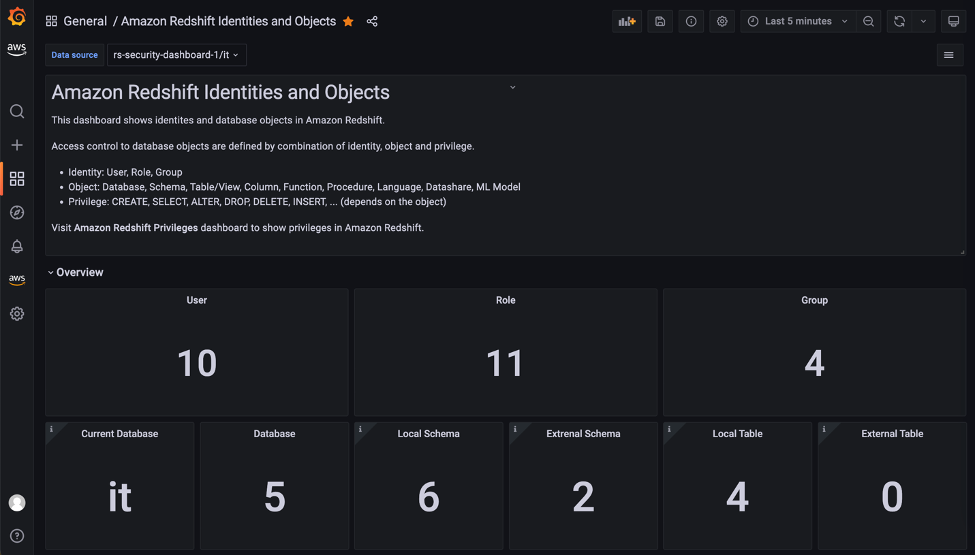
Visualize database privileges on Amazon Redshift using Grafana
Amazon Redshift is a fully managed, petabyte-scale data warehouse service in the cloud. Amazon Redshift enables you to use SQL for analyzing structured and semi-structured data with best price performance along with secure access to the data. As more users start querying data in a data warehouse, access control is paramount to protect valuable organizational […]

Enhance operational insights for Amazon MSK using Amazon Managed Service for Prometheus and Amazon Managed Grafana
Amazon Managed Streaming for Apache Kafka (Amazon MSK) is an event streaming platform that you can use to build asynchronous applications by decoupling producers and consumers. Monitoring of different Amazon MSK metrics is critical for efficient operations of production workloads. Amazon MSK gathers Apache Kafka metrics and sends them to Amazon CloudWatch, where you can […]

Build near real-time logistics dashboards using Amazon Redshift and Amazon Managed Grafana for better operational intelligence
Amazon Redshift is a fully managed data warehousing service that is currently helping tens of thousands of customers manage analytics at scale. It continues to lead price-performance benchmarks, and separates compute and storage so each can be scaled independently and you only pay for what you need. It also eliminates data silos by simplifying access […]

Visualize Amazon S3 data using Amazon Athena and Amazon Managed Grafana
Grafana is a popular open-source analytics platform that you can employ to create, explore, and share your data through flexible dashboards. Its use cases include application and IoT device monitoring, and visualization of operational and business data, among others. You can create your dashboard with your own datasets or publicly available datasets related to your […]

Create cross-account, custom Amazon Managed Grafana dashboards for Amazon Redshift
Amazon Managed Grafana recently announced a new data source plugin for Amazon Redshift, enabling you to query, visualize, and alert on your Amazon Redshift data from Amazon Managed Grafana workspaces. With the new Amazon Redshift data source, you can now create dashboards and alerts in your Amazon Managed Grafana workspaces to analyze your structured and […]