Containers
Track costs with detailed billing reports for Amazon EKS on AWS Fargate
Many AWS customers use Amazon Elastic Kubernetes Service (Amazon EKS) to run container workloads on AWS Fargate because it offers reduced operational complexity with right-sized, on-demand compute for containers. As customers scale their deployments on Fargate, they have expressed a need to track consumption with more specificity, such as usage from individual pods, namespaces, clusters, or time intervals.
Although the billing dashboard in AWS provides Fargate usage data in GB-Hours, this is a simplified view of all Amazon EKS on Fargate clusters in a given Region. By using detailed billing reports already supported within AWS, customers can analyze consumption at a more granular level, allowing them to better understand how various factors affect their spend with Amazon EKS on Fargate, such as application rollouts, traffic during peak hours, and cost allocation between teams.
In the past, customers may have dealt with this problem using third-party solutions, like Kubecost. For customers using Fargate on Amazon EKS, AWS Cost and Usage Reports provides a native way to track costs.
Overview
In this blog post, we walk through how to generate a billing report using AWS Cost and Usage Reports and then extract specific data down to the pod level.
Today, you can get general billing data automatically when you create an EKS cluster with a Fargate profile—see this in your AWS Billing dashboard. However, this data only shows general usage information for clusters created, total GB-Hours, and vCPU-Hours across all of your clusters in a Region. If you want to pull data specific to pods, namespaces, and clusters, you’ll need to start collecting the data using AWS Cost and Usage Reports, a native tool within the AWS console.
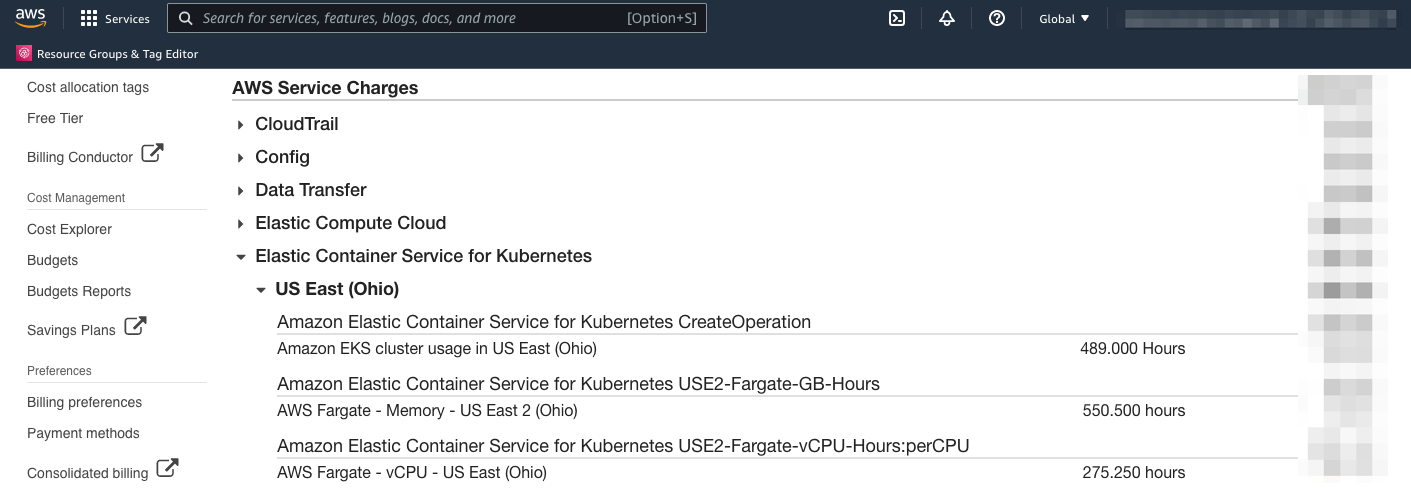
General Fargate billing data
Walkthrough
In this post, we’ll assume you have an existing EKS cluster with a configured Fargate profile. For instructions to create a cluster, refer to Getting Started with AWS Fargate using Amazon EKS.
Here are the high-level steps to get pod-specific billing data from EKS workloads on Fargate:
- Create a Cost and Usage report with Resource IDs.
- Configure an Amazon Simple Storage Service (Amazon S3) bucket to store reports.
- Optional: Configure Amazon Athena, Amazon Redshift, or Amazon QuickSight integration.
- Download the CSV report and create a pivot table.
Prerequisites
- An AWS account with permissions to view the AWS Billing dashboard and create an S3 bucket
- Running EKS cluster with a configured Fargate profile
- At least one running pod with a Fargate profile
- Excel, Amazon QuickSight, or similar tool to analyze CSV reports
Steps to generate the data
- Open your AWS console, access the AWS Billing dashboard, and navigate to Cost & Usage Reports.

- Choose a unique report name. We’ll have an option to add a descriptive prefix in the next step.
- Be sure to check Include resource IDs

- Select Next.
Next, we’ll configure the S3 bucket where the report data will be stored.
- Create an S3 bucket or choose an existing bucket. Generated reports will be stored within that bucket.
- Choose a descriptive Report path prefix for the top-level S3 object folder.
- Choose the granularity level you need. You can always create multiple reports at different granularity levels.
- Optional: configure report data integration with Amazon Athena, Amazon Redshift or Amazon QuickSight.
- Select Next.
- Review the details and select Review and Complete.
You may need to wait up to 24 hours for the first report to be generated and uploaded to your S3 bucket. Once it’s available, head back to the Cost and Usage Reports dashboard:
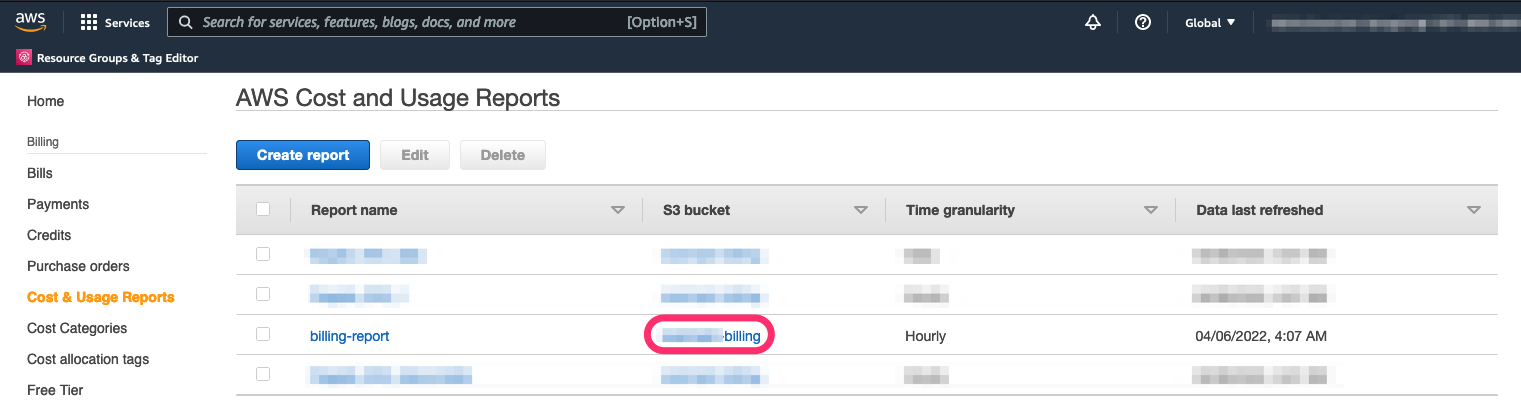
- Select your S3 bucket.
- Navigate through the objects to find your CSV .zip file and select Download.

The CSV file inside the .zip file contains the data you need, but there’s quite a bit of data to sift through. Filter the rows with the lineItem/Operation set to FargatePod to get the relevant cost data. The lineItem/Operation field is an Amazon Resource Name (ARN):
For each row in the CSV, you can find pod charges related to DataTransfer, GB-Hours, and vCPU-Hours as labeled by the lineItem/UsageType field. See the lineItem/BlendedCost field to find the cost.
Steps to analyze the data
The raw data can be difficult to analyze, but pivot tables are a great way to quickly filter the data down. Although pivot tables are supported in a number of tools, you may want to consider using Amazon QuickSight, a business intelligence service available within AWS. As we saw in a previous step, QuickSight can directly integrate with your S3 bucket to read the latest data generated by Cost and Usage Reports.
The following steps are based on Excel, but you can follow similar steps to create a pivot table in other tools, including QuickSight:
- Create a new pivot table with the CSV table range.
- Create the following Filters:
- lineItem/Operation set to FargatePod.
- Create the following Rows:
- lineItem/ResourceId.
- lineItem/UsageType.
- Create the following Values:
- lineItem/BlendedCost set to Sum.
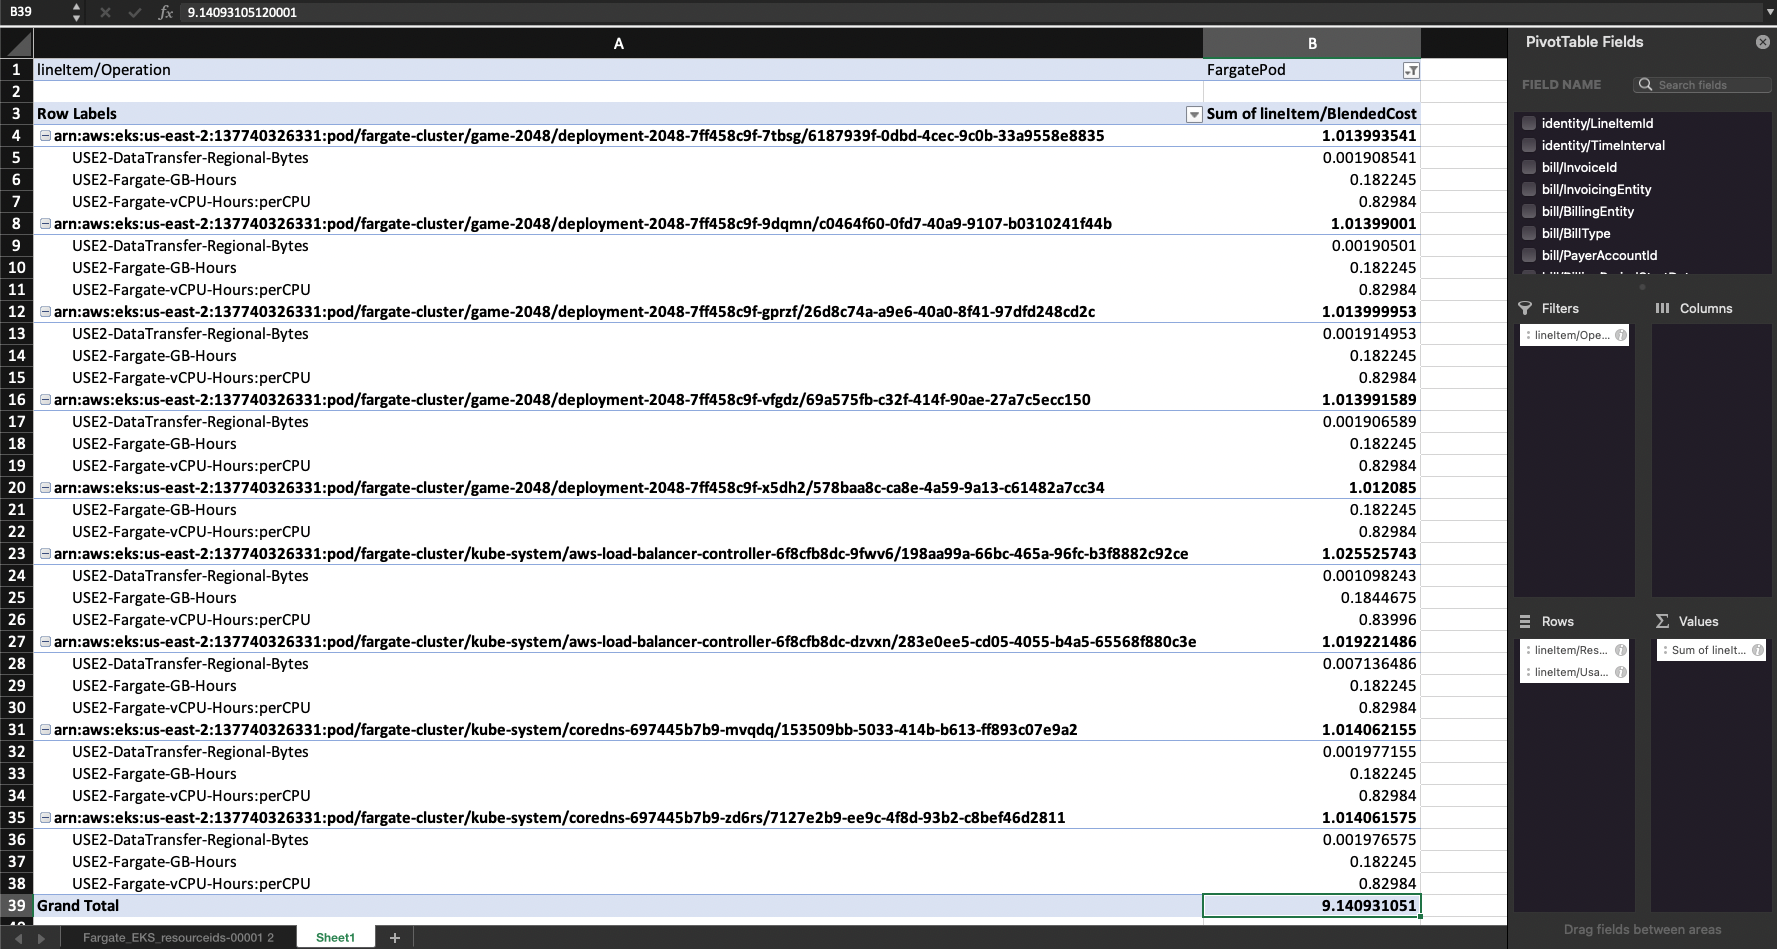
You should now see a breakdown of costs per pod in the timeframe determined by the downloaded CSV file, which in my example, is for all consumption in April—about $9.14 USD. If needed, you can further organize the data by pod, deployment, cluster name, namespace, time interval, and more. To do so, simply filter the Row Labels with a Contains rule for a given deployment, namespace, or cluster.
For example, let’s say you want to understand the consumption of all pods that power just the 2048 game deployment (check out the EKS docs for steps to deploy this example app). To track down this exact cost, make a filter on the Operation field:
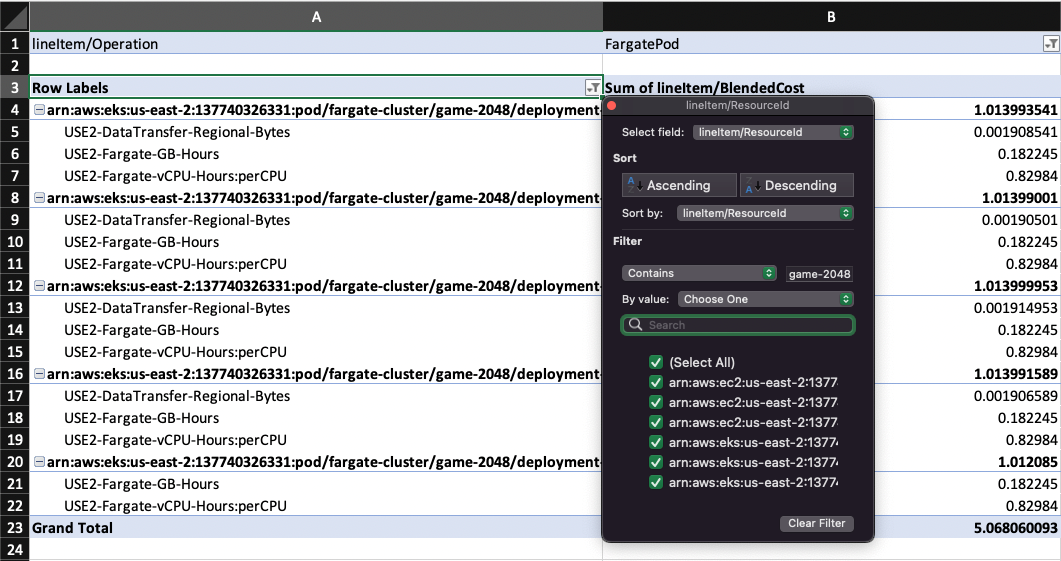
With this filter created, we deduce that consumption from “game-2048” totaled about $5.07 in April.
Check out the following blog to learn more about how to create detailed dashboards with AWS Cost and Usage Reports, Amazon Athena and Amazon QuickSight. Following these steps, you can create an interactive Trends Dashboard to help you visualize consumption data and even forecast future metrics based on patterns of historical usage.
Cleanup
To avoid S3 charges from reports that continue to be generated, simply return back to the Cost and Usage Reports dashboard and delete the report. You may also delete the S3 bucket by navigating to your S3 buckets dashboard, selecting the previously created bucket, and selecting Delete.
Get started now
With AWS Cost and Usage Reports, you can get detailed billing information down to the pod level for workloads running within an EKS cluster on Fargate-provided infrastructure. As IT teams continue to scale up their usage of Fargate, these reports will allow them to determine which workloads are consuming infrastructure resources with specificity. For teams practicing multi-tenancy on EKS clusters, running a multi-tier application, or simply looking to analyze cost trends, consider leveraging Cost and Usage Reports to monitor your Kubernetes spend and continuously reduce your cloud expenditure.
For detailed information on running Amazon EKS clusters on Fargate, see our Amazon EKS documentation.
Get started with creating detailed billing reports now with Cost and Usage Reports.