AWS Database Blog
Monitor custom database metrics in Amazon RDS for SQL Server using Amazon CloudWatch
In this post, we demonstrate how to create custom Amazon RDS for SQL Server CloudWatch metrics. You accomplish this by using SQL Server Agent jobs and CloudWatch Logs integration. We walk through an example of monitoring table size within a SQL Server database, however, this approach works for various other metrics. You can adapt this approach to track row counts, database size, job counts, user sessions, or other metrics.
This solution helps you gain comprehensive visibility into your Amazon RDS for SQL Server databases without additional infrastructure or third-party tools. You can make data-driven decisions based on the metrics you define. The approach scales and adapts as you can modify the T-SQL script to monitor any database metric.
Solution overview
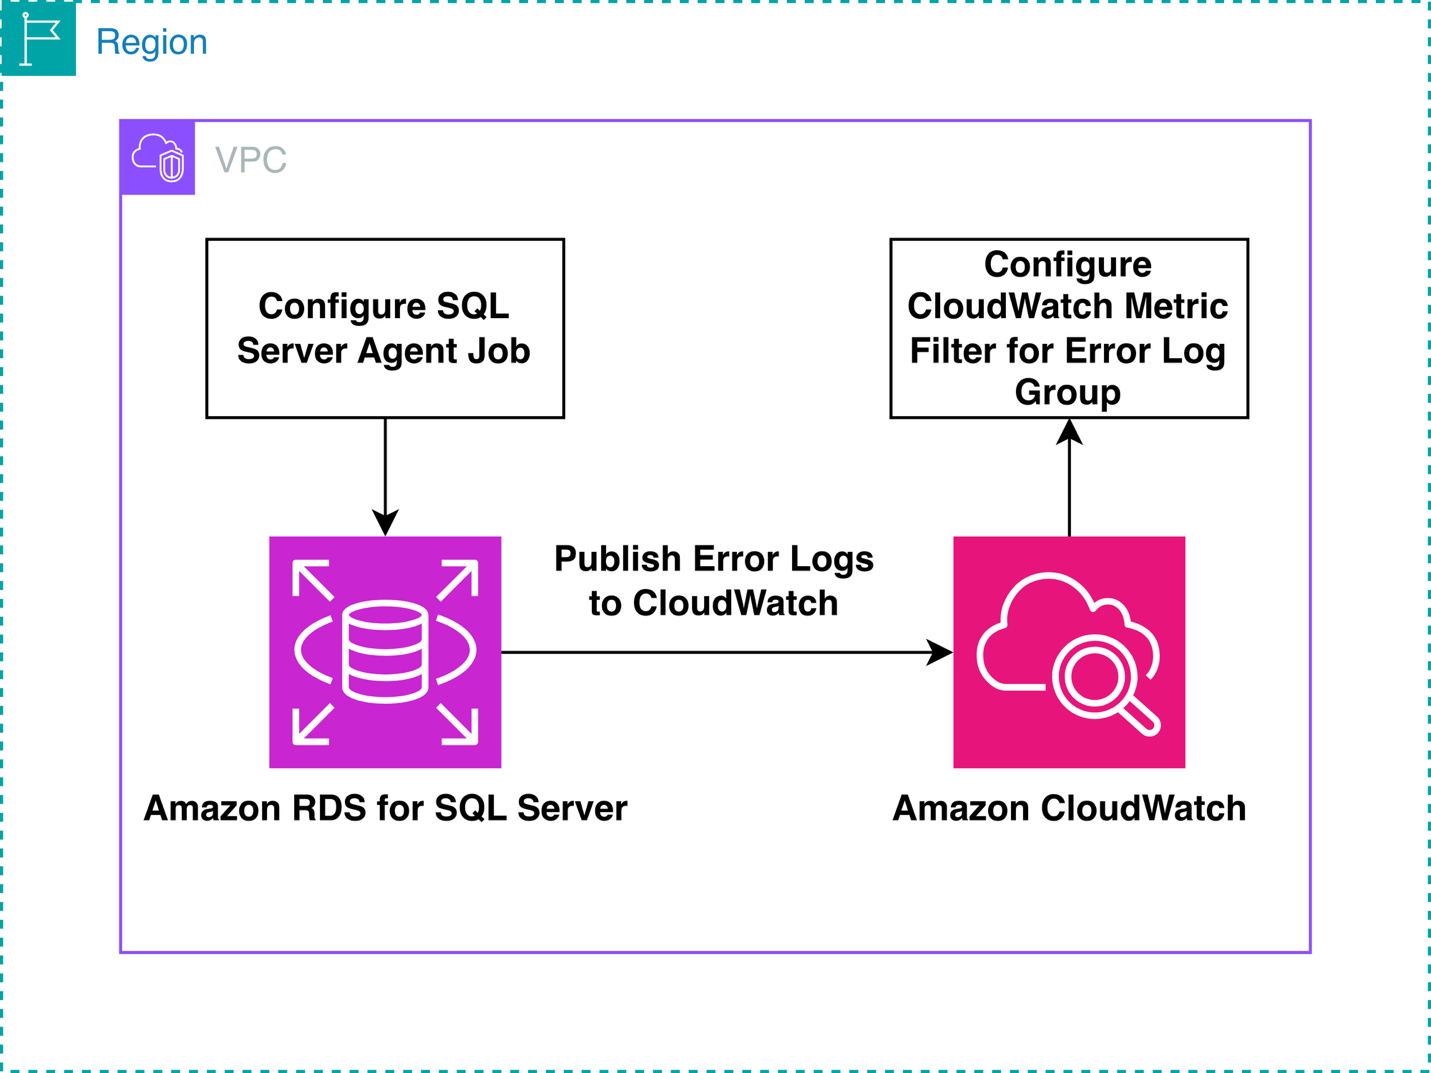
The solution uses native SQL Server and AWS capabilities to create custom CloudWatch metrics for monitoring database-level factors in Amazon RDS for SQL Server. The process includes these steps:
- Create a SQL Server Agent job with a T-SQL script that queries the desired metric (such as table size).
- Configure the job to write the metric value to the SQL Server error log using the
RAISERRORcommand. - Schedule the SQL Server Agent job to run at regular intervals.
- Utilize the automatic publishing of RDS error logs to Amazon CloudWatch Logs.
- Create a CloudWatch metric filter to extract the metric value from the log entries.
- View and monitor the custom metric in CloudWatch, including setting alarms and creating dashboards.
The following diagram shows the flow from RDS for SQL Server to CloudWatch
You gain comprehensive visibility into database-level metrics with this procedure. This solution bridges the gap between SQL Server’s internal metrics and CloudWatch’s monitoring capabilities, allowing for proactive database management.
In this example, you monitor SQL Server table size, which can help with capacity and cost planning—especially during long-term commitment purchases or when understanding the scale to which a table can grow is useful.
Prerequisites
To implement this solution, you need the following prerequisites:
- An AWS account with permissions to create and manage Amazon RDS instances
- An Amazon RDS for SQL Server DB Instance running Microsoft SQL Server Enterprise Edition, Standard Edition, or Web Edition.
- Amazon RDS for SQL Server error logs enabled to export to Amazon Cloudwatch.
- SQL Server Management Studio (SSMS) or another SQL client tool installed.
- A database user added to the SQLAgentUserRole. This SQLAgentUserRole allows users to create and manage their own jobs.
Create a test database
In SQL Server Management Studio (SSMS), choose New Query. Run the following command to create a test database:
Create a test table
In the same query window, run the following command:
Populate the test table
For this demo, you populate this test table with 10,000 rows. In the same query window, run the following command to populate the test table:
You can confirm that the test table has been populated by running the following command to get the row count:
You now have a database and table configured on your Amazon RDS for SQL Server DB instance. In the next section, you create a SQL Server Agent job to monitor the table size.
Create a SQL Server Agent Job
Next, create the SQL Server Agent Job that gathers the table size and writes it to the RDS SQL Server error logs.
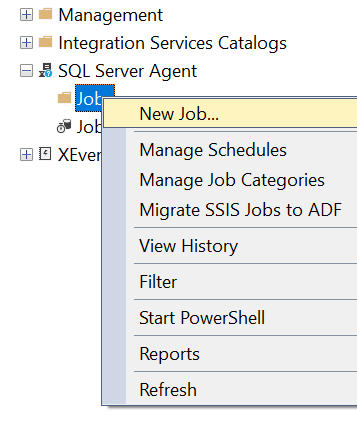
- In SQL Server Management Studio (SSMS), create a new SQL Server Agent Job.
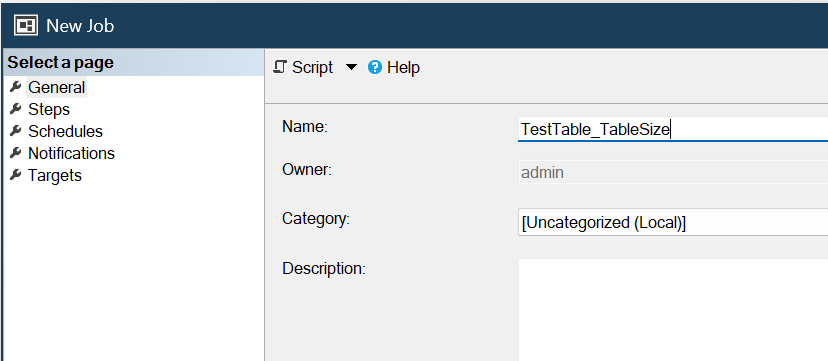
- Provide a Name for the SQL Server Agent Job.
- Select Steps.
- Provide a Step Name and the TestDB Database Name we previously created, and paste the following script in the Command Box:
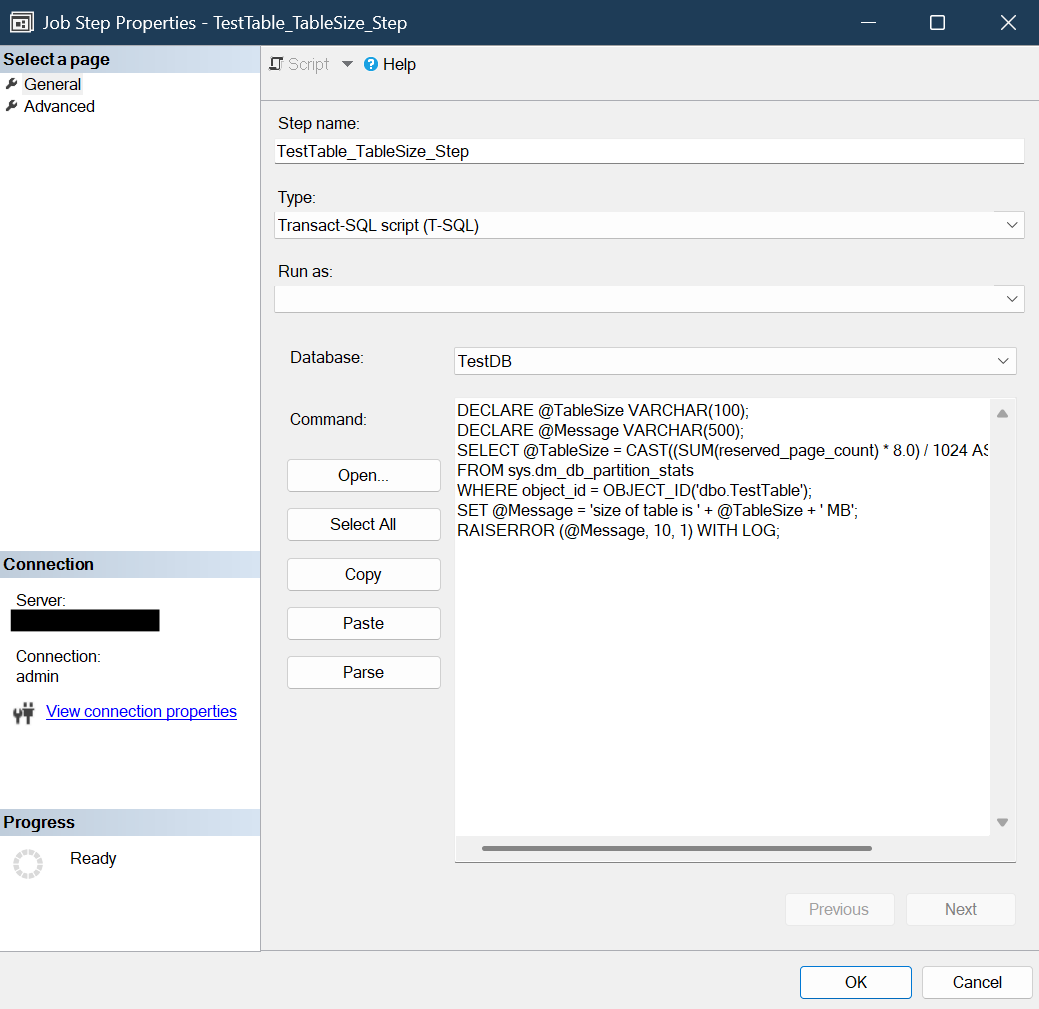
- Select OK.
- Select Schedules and New. Provide a name for the job schedule and configure your desired Job Schedule details. For this Demo, set the Frequency to Daily, and have it run every minute.
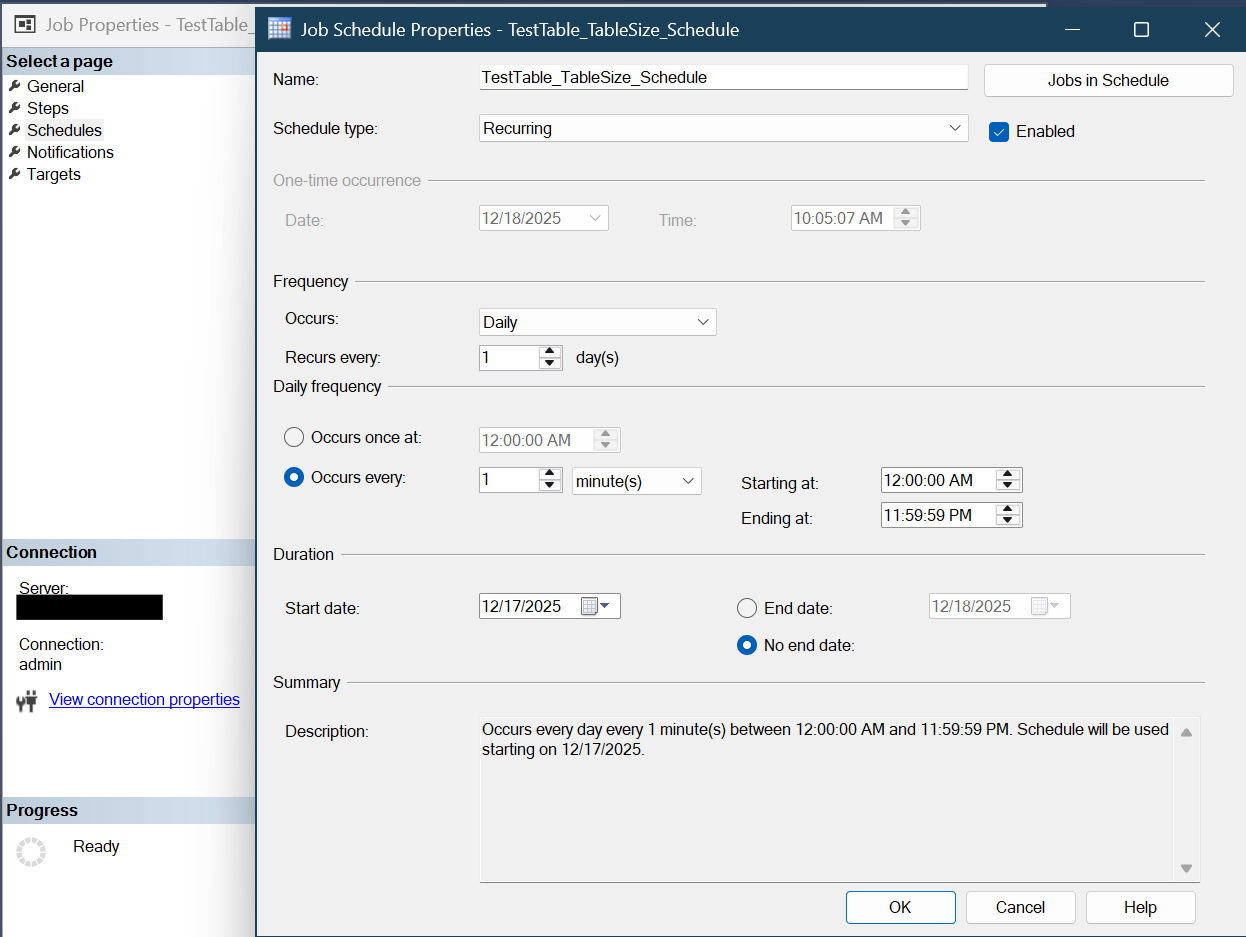
- Select OK, and then OK again to save the New SQL Server Agent Job.
Confirm table size is being published to the error logs
To ensure our script is running correctly, complete the following steps:
- Navigate to the RDS Console, select your DB Instance, and then select the Logs & Events Tab.
- Scroll Down and select the Log “log/ERROR”.
- You should see the table size being printed in the error log, for example:
Create a CloudWatch Metric Filter
Next, we create a CloudWatch Metric Filter to convert our Table Size in the error logs to a CloudWatch Metric. Review the CloudWatch pricing documentation to understand Custom Metrics costs.
- Navigate to the Cloudwatch Console, select Logs, and then select Log Management.
- Find your error log group, which should be in the format of /aws/rds/instance/<your-instance-name>/error. Select your log group.
- Then, select Metric Filters, and then select Create Metric Filter.
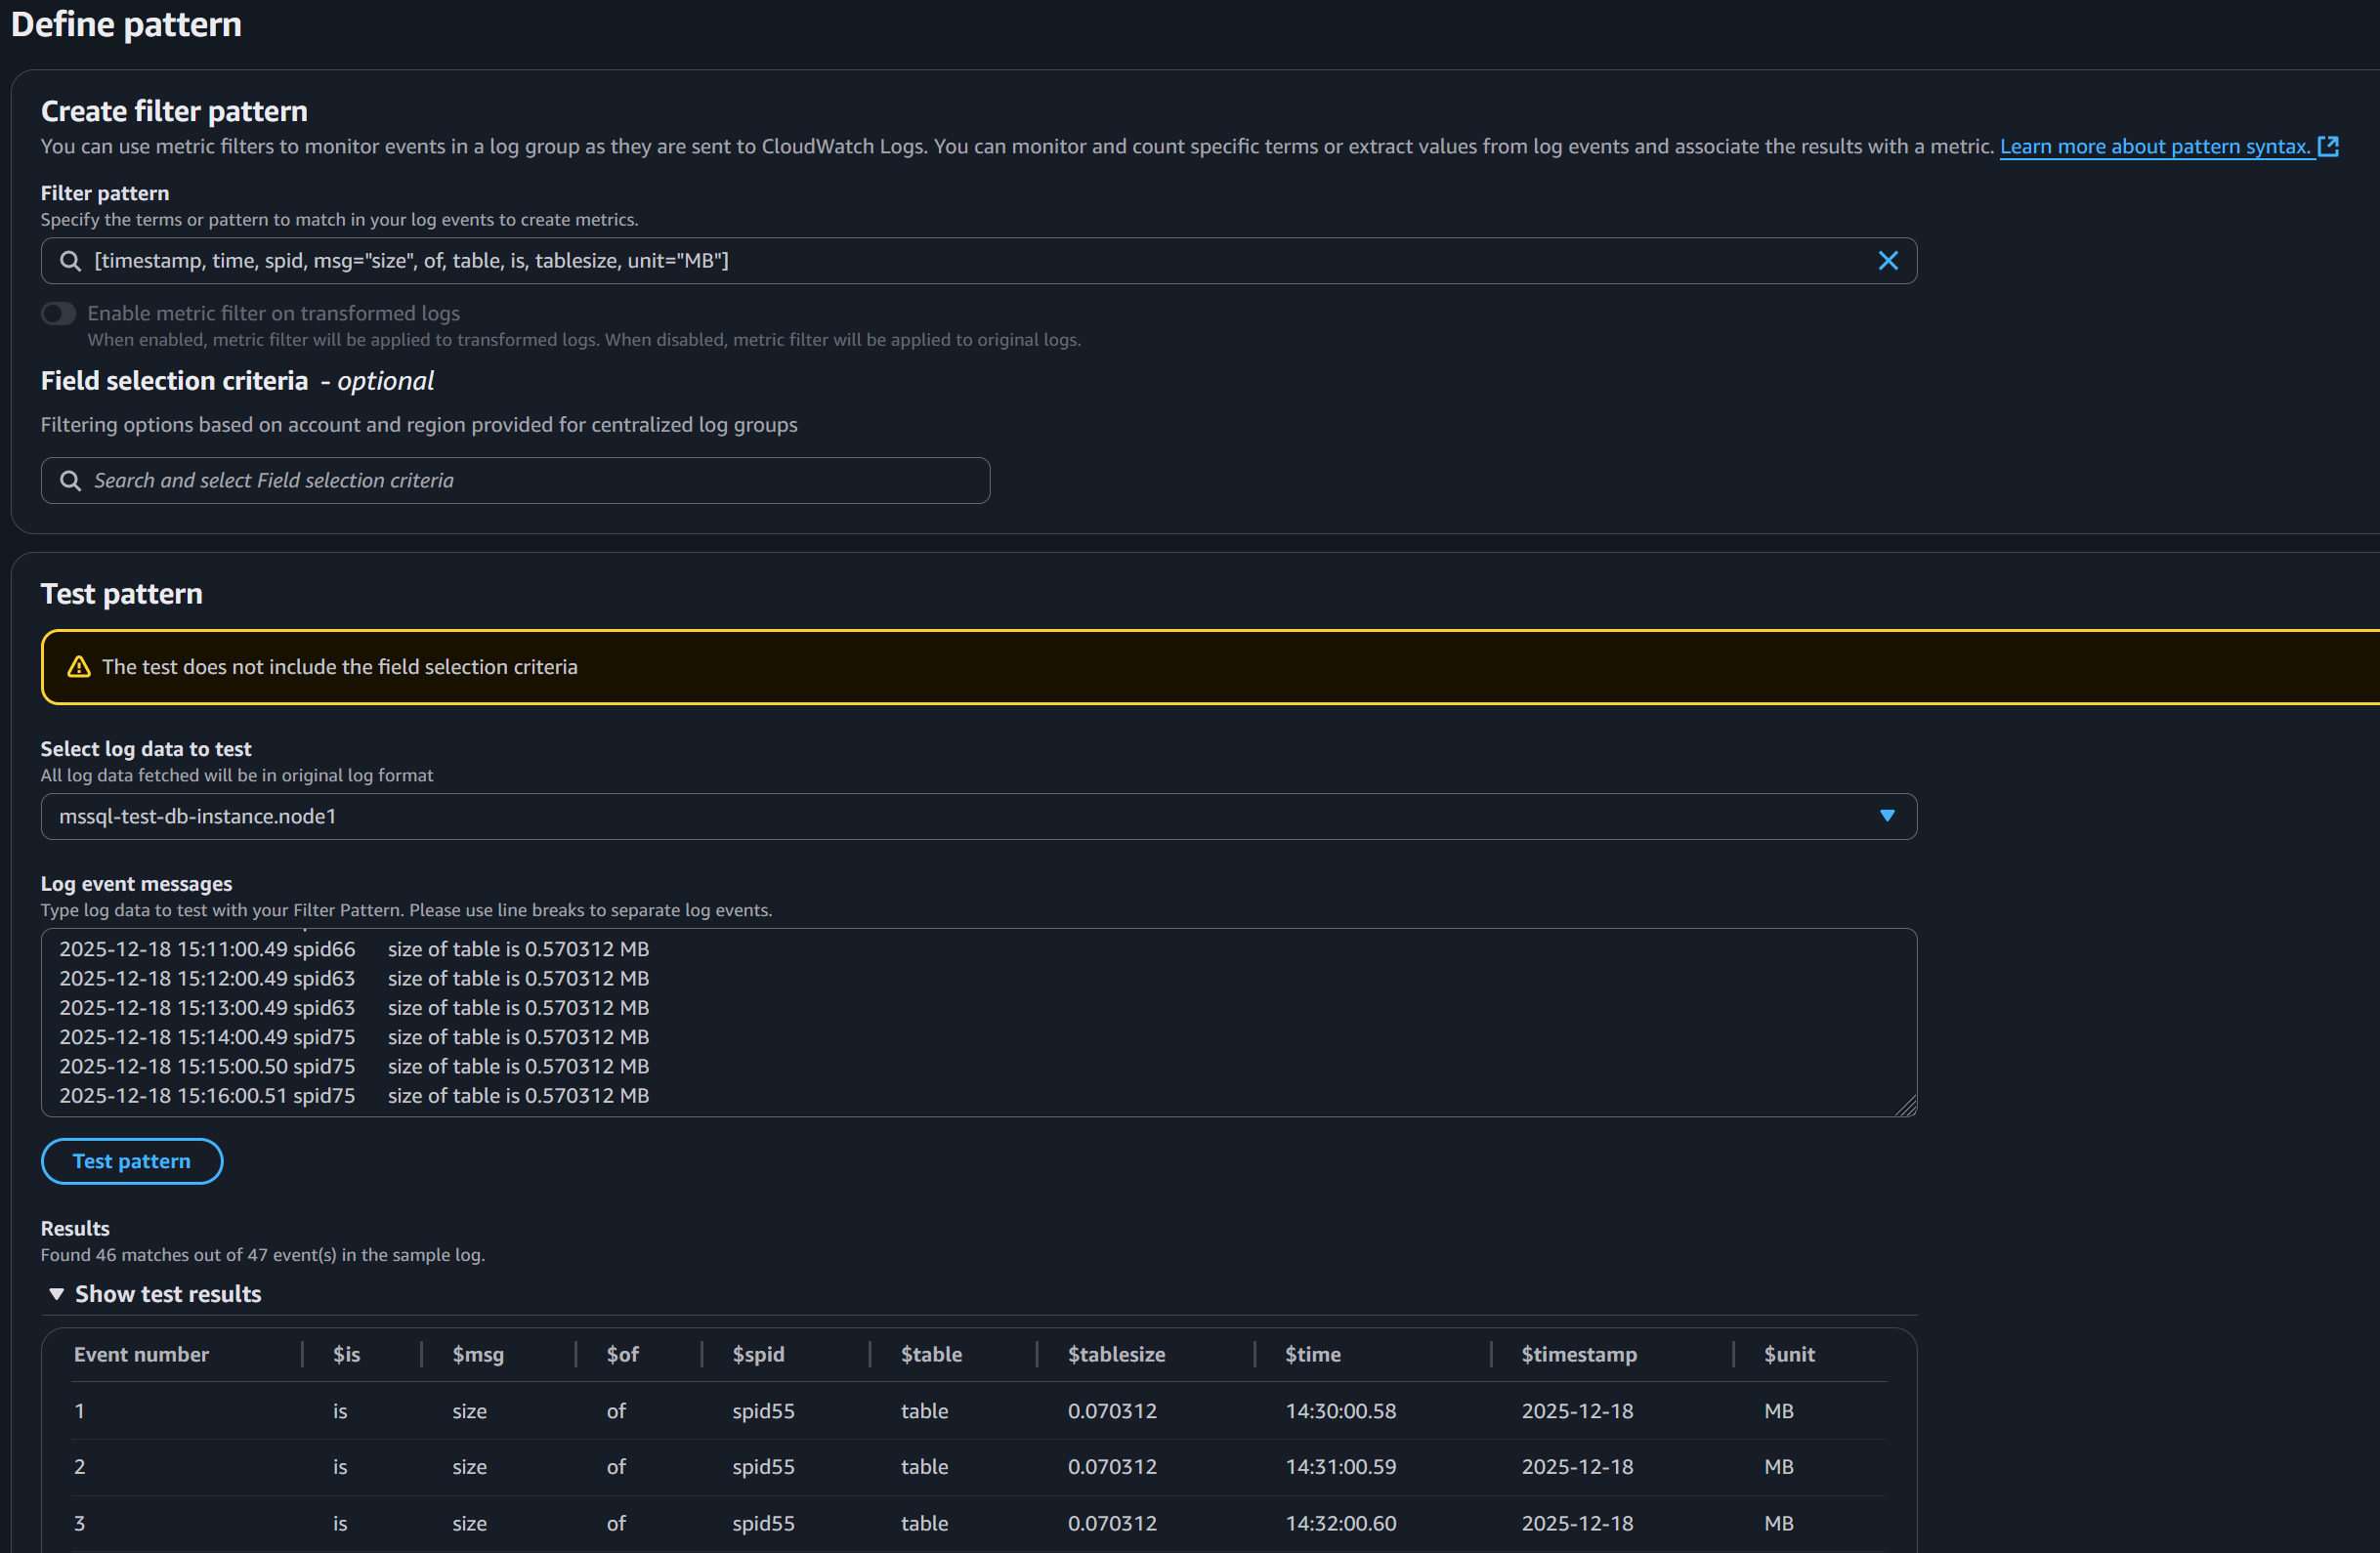
- For the Filter pattern, use:
- (Optional) If you are monitoring other metrics ensure you edit the above filter pattern appropriately
- Leave the Field select criteria empty.
- For Select log data to test, you can select your DB Instance node, which will show its log event messages, and then select Test Pattern to test with the filter pattern.
- Select Next.
- Now, we provide a Filter Name, Metric Namespace, Metric Name, and Metric Value. Provide your desired details. For this Demo, we use
TableSizeTrackeras the Filter Name,Databaseas the Metric namespace, andTableSizeMBfor the Metric name. For the Metric value, we use$tablesizeto retrieve the table size from the logs and publish it to the Metric.
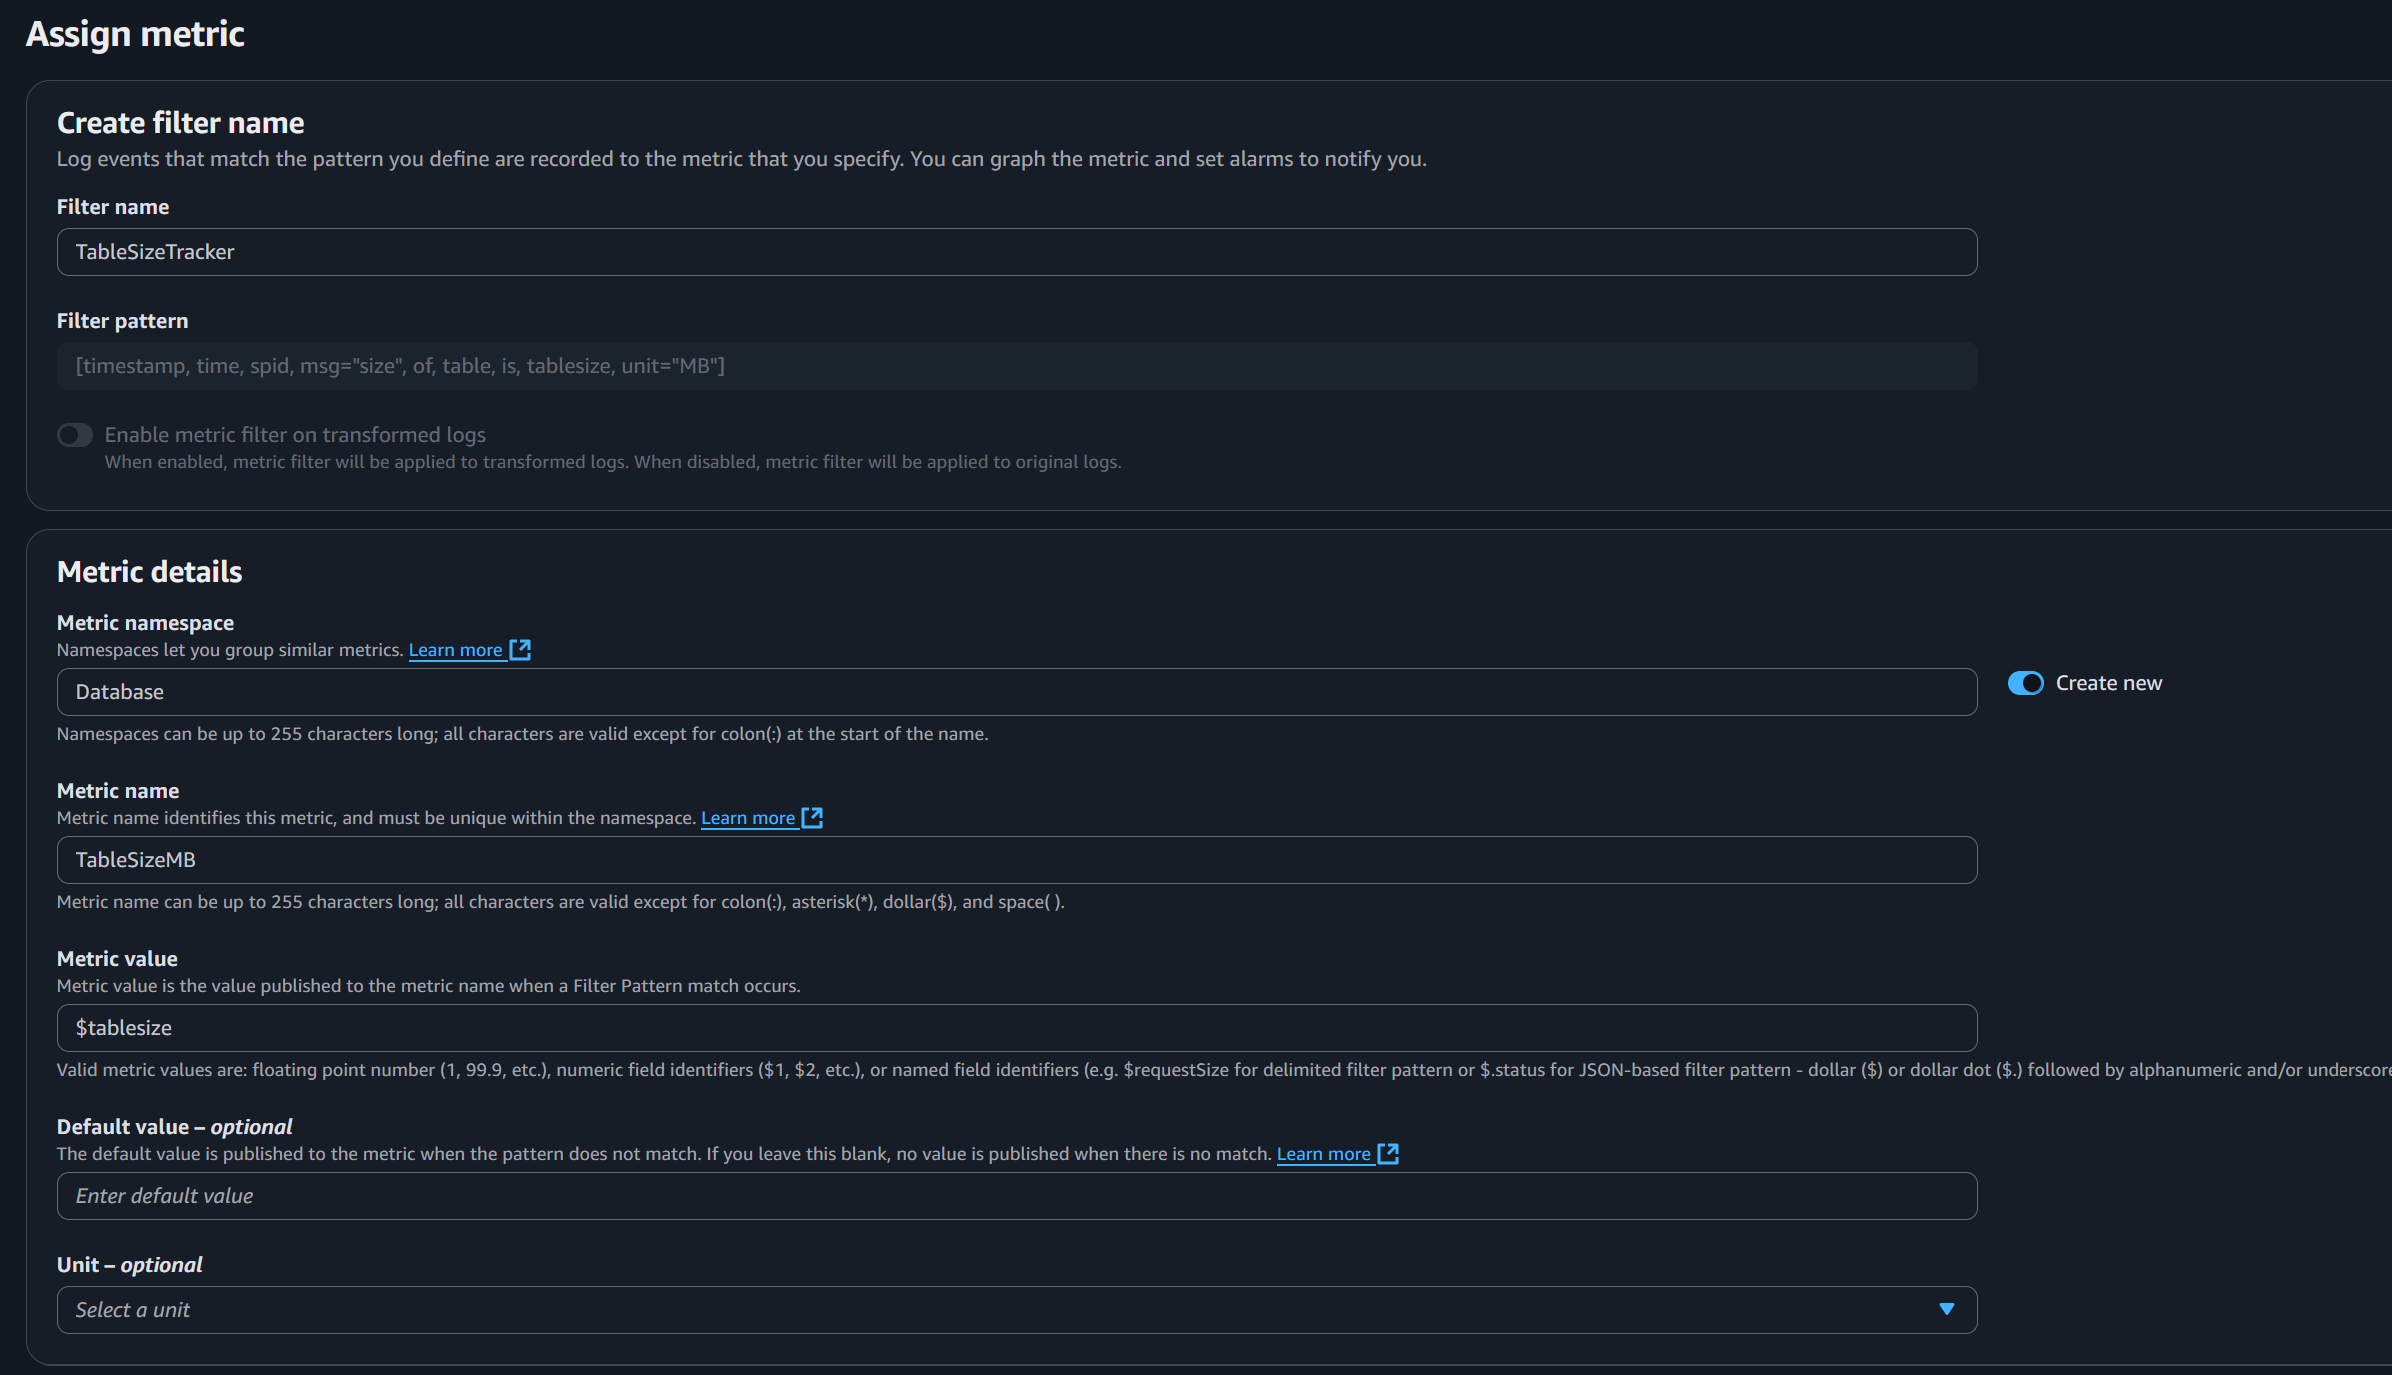
- Then select Next and save changes.
View your Custom CloudWatch Metric
Now, we can check and confirm Cloudwatch publishes the metric of the table size value. Wait a few minutes for CloudWatch to generate the namespace and metric.
- In the Cloudwatch Console, on the left-hand side, select Metrics, and then All Metrics.
- Select your Custom namespace. For this demo, it is
Database. - Select Metrics with no dimensions.
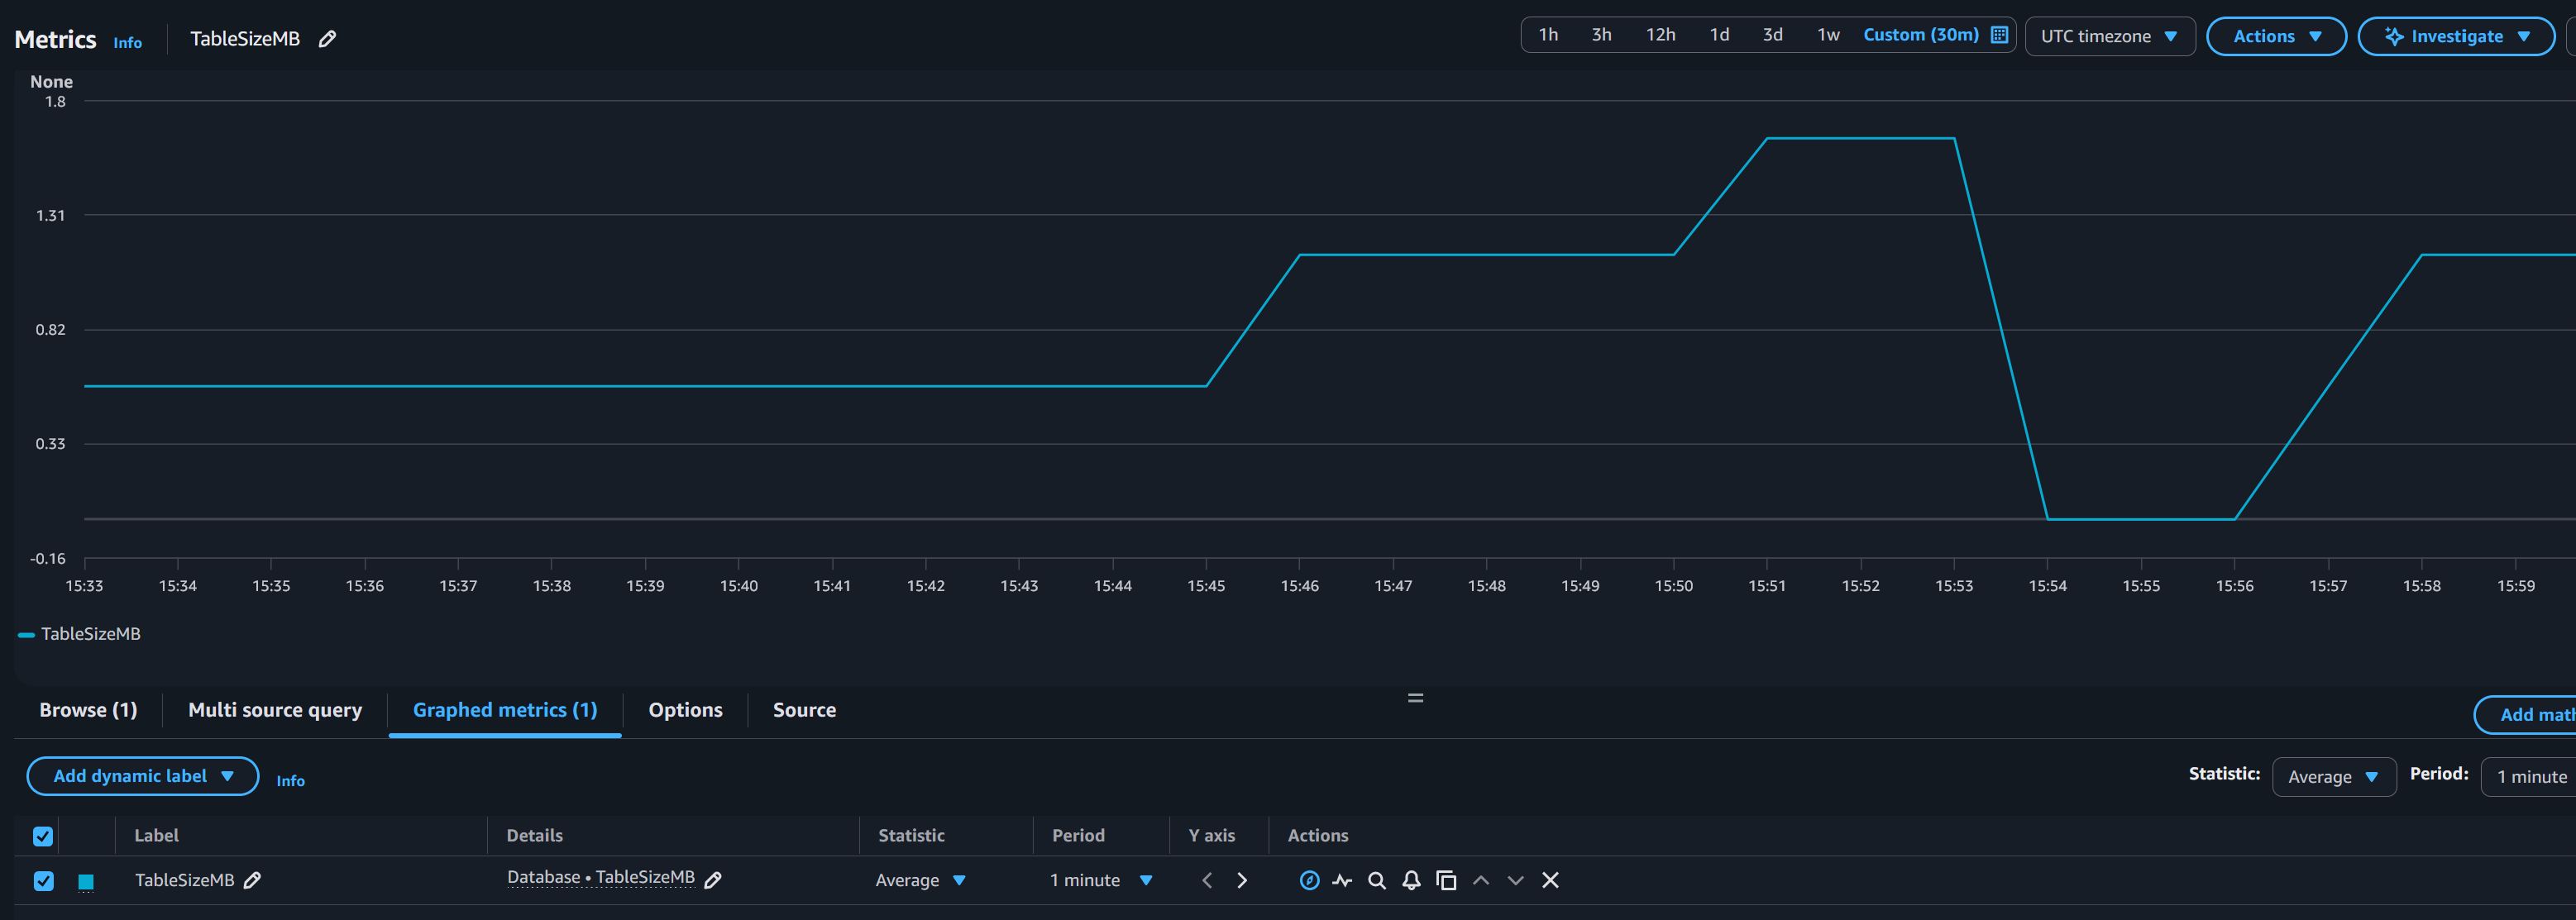
- And then select your
TableSizeMBMetric. Cloudwatch plots the table size.
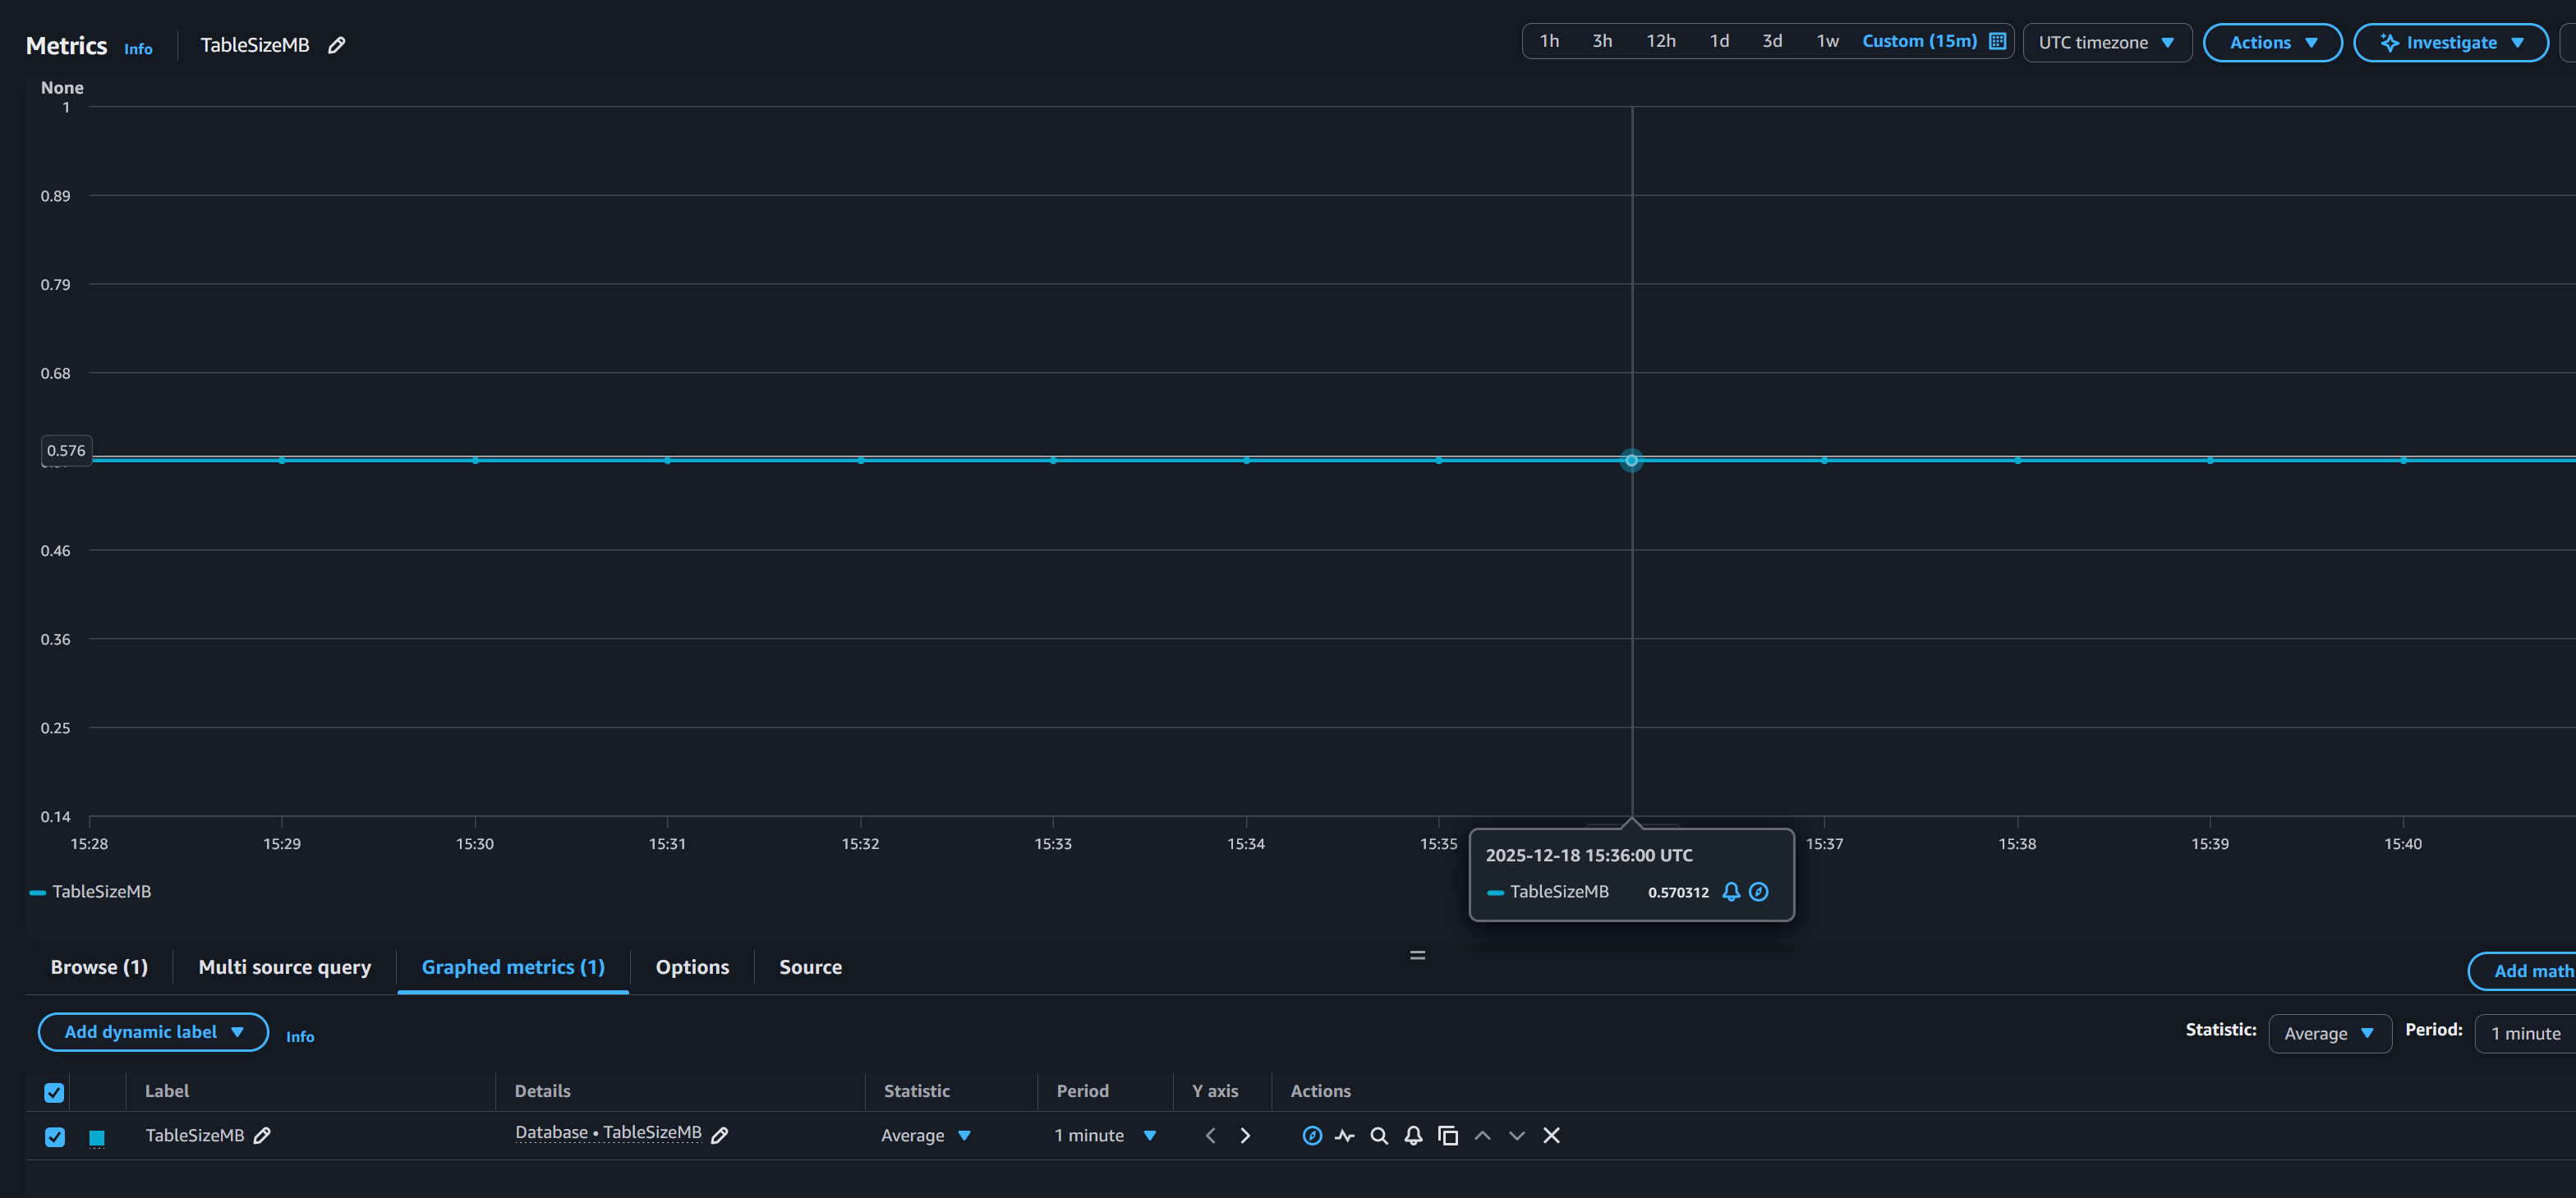
You can also rerun the command from the Populate the Table section of this post, as well as truncate the table to confirm that the table size is being reflected in Cloudwatch.
You can also implement Cloudwatch Dashboards and Cloudwatch Alarms for additional monitoring of your Table Size Metric. Review the CloudWatch pricing documentation here for the costs associated with Cloudwatch Dashboards and Cloudwatch Alarms.
Clean Up
To clean up the resources created during this demo:
- Delete the CloudWatch Metric Filter
- Delete the SQL Server Agent Job
- Delete the Table. Note: Ensure the command deletes the correct table before execution.
- Delete The Database
- Delete your RDS for SQL Server DB Instance
Conclusion
In this post, we demonstrated a practical approach to monitoring custom database metrics in Amazon RDS for SQL Server using CloudWatch. By combining SQL Server Agent jobs, error log integration, and CloudWatch metric filters, you can gain visibility into critical database factors that aren’t natively exposed by RDS.
This solution provides you with a flexible framework to monitor any database-level metric, whether it’s table size, row counts, database growth, or other custom indicators. The approach requires no additional infrastructure, leverages existing AWS and SQL Server capabilities, and scales across multiple databases and metrics.
We encourage you to adapt this solution to your specific monitoring needs and explore additional metrics that would benefit your database operations.